R E S E A R C H
Open Access
Triglyceride and glucose (TyG) index as a
predictor of incident hypertension: a 9-year
longitudinal population-based study
Rongjiong Zheng
1,2*and Yushan Mao
1,2*Abstract
Background:Hypertension and the triglyceride and glucose index both have been associated with insulin resistance; however, the longitudinal association remains unclear. This study was designed to investigate the longitudinal association between the triglyceride and glucose index and incident hypertension among the Chinese population.
Methods:We studied 4686 subjects (3177 males and 1509 females) and followed up for 9 years. The subjects were
divided into four groups based on the triglyceride and glucose index. Univariate and multivariate Cox regression models were used to analyse the risk factors of hypertension.
Results:After 9 years of follow-up, 2047 subjects developed hypertension. The overall 9-year cumulative incidence of hypertension was 43.7%, ranging from 28.5% in quartile 1 to 36.9% in quartile 2, 49.2% in quartile 3 and 59.8% in quartile 4 (pfor trend < 0.001). Cox regression analyses indicated that higher triglyceride and glucose index was associated with an increased risk of subsequent incident hypertension.
Conclusion:The triglyceride and glucose index can predict the incident hypertension among the Chinese population.
Keywords:Triglyceride and glucose index, Hypertension, Epidemiology
Background
With the population aging, hypertension (HTN) has be-come the most important risk factor for cardiovascular disease (CVD) morbidity and mortality [1–4]. According to a WHO report, it was estimated that the HTN mor-tality was about 55% worldwide in 2013 [5, 6]. Consider-ing that HTN has been one of the most serious public health issues [7], an effective and accurate predictor for the incident HTN should be needed nowadays.
Recently, the triglyceride and glucose (TyG) index has been proposed as a simple surrogate of insulin resistance (IR) [8, 9], and numerous studies have also found a rela-tionship between HTN and IR [10, 11]. Additionally, a recent cross-sectional study revealed that the TyG index is closely associated with HTN [12]; however, the longi-tudinal association remains unclear. Therefore, we
performed a 9-year longitudinal population-based study to investigate the association between the TyG index and incident HTN among the Chinese population.
Methods
Study population
The study participants, aged 20–80 years, were enrolled in the annual physical health examinations at Zhenhai Lianhua Hospital in Ningbo, China. This longitudinal population-based cohort study was conducted to investi-gate the longitudinal association between the TyG index and the incident HTN beginning from 2006 to 2015. The subjects were excluded according to the following criteria: (1). Subjects who had a history of HTN or overt cardiovascular diseases. (2). Subjects who were taking medicines that may affect blood pressure or lipids. (3). Subjects who were drinking alcohol and smoking at study entry. In total, 4686 subjects including 3177 males and 1509 females were evaluated for the study.
* Correspondence:842429171@qq.com;zhys007@sohu.com
1
Department of Endocrinology, the Affiliated Hospital of Ningbo University School of Medicine, 247 Renmin Road, Ningbo 315020, China
2Ningbo University, Ningbo, China
Full list of author information is available at the end of the article
Survey and measurements
(1). A questionnaire was completed for the initial health examinations in 2006 at the health check-up center of Zhenhai Lianhua Hospital through face-to-face interviews by a well-trained senior physician. The questionnaire included the subjects’demographic characteristics, smoking and drinking status, medical history, and family background.
(2). Anthropometric test: Standing height and body weight was measured while he/she was in light indoor clothing without shoes. Body mass index (BMI) was calculated as weight in kilograms divided by height in meters squared. Waist circumference (WC) was measured at the level midway between the lower rib margin and the iliac crest [13]. Sitting blood pressure was measured from the right arm three times with a 1-min interval between the measurements after the rest for 20 min by trained members, using an automated device (Omron HEM-7052; Omron Corp., Kyoto, Japan). The mean value of the three measurements was calculated for analysis. (3). Laboratory examinations: Venous blood samples
were obtained from the subjects in the morning after at least 12 h prior to the examination. Routine biochemical data including blood urea nitrogen (BUN), creatinine (Cr), triglyceride (TG), total cholesterol (TC), high density lipoprotein cholesterol (HDL-C), low density lipoprotein (LDL-C), serum uric acid (SUA), fasting plasma glucose (FPG), alanine aminotransferase (ALT), aspartate aminotransferase (AST),γ -glutamyltransferase (γ-GGT), Apo-A1and Apo-B were estimated using an Olympus AU640 automated analyser (Olympus, Kobe, Japan). All of the laboratories involved resoundingly completed the standardization.
Definitions
(1). HTN was defined as systolic blood pressure (SBP)≥140 mmHg, diastolic blood pressure (DBP)≥90 mmHg or current drug use for HTN in accordance with the criteria of the WHO [14]. (2). The TyG index was calculated with established
formulas according to the previous studies [15,16]: TyG = Ln [TG (mg/ml) * FPG (mg/ml) /2] (3). The estimated glomerular filtration rate (eGFR)
was calculated using the improved Chinese population Modification of Diet in Renal Disease (MDRD) study formula [17].
Statistical analysis
The fundamental characteristics of the samples were summarized by descriptive statistics. All statistical ana-lyses were performed using SPSS software (version 17.0, SPSS software, Chicago, IL, USA). Continuous variables were expressed as median (IQR) and catego-rical variables were presented as percentages (%). Con-tinuous variables were compared using the student’s t text, Mann-Whitney U test, Kruskal-Wallis H test or one-way ANOVA depending on the normality of the data. Categorical variables between groups were com-pared using Chi-square text. For a statistical inference, allpvalues are bilateral, and a pvalue of less than 0.05 was considered statistically significant.
The subjects were classified into four groups (quartile 1 to quartile 4) based on the TyG index at baseline. The classifications of the TyG index in these groups were as follows: quartile 1(Q1) (≤8.12), quartile 2(Q2) (8.13–8.46), quartile 3(Q3) (8.47–8.83), and quartile 4(Q4) (≥8.84) for male; and quartile 1(Q1) (≤7.85), quartile 2(Q2) (7.86–8.16), quartile 3(Q3) (8.17–8.52), and quartile 4(Q4) (≥8.53) for female. The basic char-acteristics of the subjects in each group were compared. The cumulative incidence of HTN was calculated by dividing the number of cases by the numbers of sub-jects followed up for each TyG group. Cox proportional hazards regression models were used to analyze the risk of incident HTN for each baseline TyG group.
Results
Basic characteristics
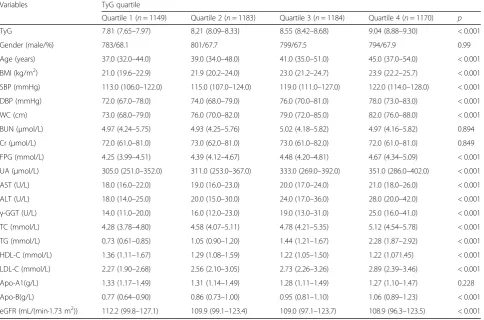
The basic demographic and clinical characteristics of the subjects are presented in Table 1. In the study, a total of 4686 subjects including 3177 males and 1509 females were evaluated at baseline. Significant differences in age, BMI, SBP, DBP, WC, TyG, FPG, UA, AST, ALT, γ-GGT, TC, TG, LDL-C, HDL-C, Apo-B and eGFR between the groups were observed (p< 0.001). In addition, age, BMI, SBP, DBP, WC, FPG, UA, AST, ALT, γ-GGT, TC, TG, LDL-C and Apo-B all tended to increase in subjects with a higher TyG index, whereas HDL-C and eGFR were significantly lower in subjects with a higher TyG index (p< 0.001).
ranging from 28.5% in quartile 1 to 36.9% in quartile 2, 49.2% in quartile 3 and 59.8% in quartile 4 (pfor trend < 0.001; Fig. 1). This tendency also holds true for 1- to 8-year cumulative incidences. These findings indicate that those with higher TyG groups are more likely to develop HTN. In addition, the subjects with incident HTN are predominantly male, and the baseline age, BMI, SBP, DBP,
WC, TyG, BUN, Cr, FPG, UA, AST, ALT,γ-GGT, TC, TG, LDL-C, and Apo-B in subjects with incident HTN were significantly higher than the other group (Table 2).
The TyG index and the risk of incident HTN
We used univariate and multivariate Cox proportional hazard models to analyse the hazard ratio for incident Table 1Baseline characteristics of the subjects according to TyG quartiles
Variables TyG quartile
Quartile 1 (n= 1149) Quartile 2 (n= 1183) Quartile 3 (n= 1184) Quartile 4 (n= 1170) p
TyG 7.81 (7.65–7.97) 8.21 (8.09–8.33) 8.55 (8.42–8.68) 9.04 (8.88–9.30) < 0.001
Gender (male/%) 783/68.1 801/67.7 799/67.5 794/67.9 0.99
Age (years) 37.0 (32.0–44.0) 39.0 (34.0–48.0) 41.0 (35.0–51.0) 45.0 (37.0–54.0) < 0.001
BMI (kg/m2) 21.0 (19.6–22.9) 21.9 (20.2–24.0) 23.0 (21.2–24.7) 23.9 (22.2–25.7) < 0.001
SBP (mmHg) 113.0 (106.0–122.0) 115.0 (107.0–124.0) 119.0 (111.0–127.0) 122.0 (114.0–128.0) < 0.001
DBP (mmHg) 72.0 (67.0–78.0) 74.0 (68.0–79.0) 76.0 (70.0–81.0) 78.0 (73.0–83.0) < 0.001
WC (cm) 73.0 (68.0–79.0) 76.0 (70.0–82.0) 79.0 (72.0–85.0) 82.0 (76.0–88.0) < 0.001
BUN (μmol/L) 4.97 (4.24–5.75) 4.93 (4.25–5.76) 5.02 (4.18–5.82) 4.97 (4.16–5.82) 0.894
Cr (μmol/L) 72.0 (61.0–81.0) 73.0 (62.0–81.0) 73.0 (61.0–82.0) 72.0 (61.0–81.0) 0.849
FPG (mmol/L) 4.25 (3.99–4.51) 4.39 (4.12–4.67) 4.48 (4.20–4.81) 4.67 (4.34–5.09) < 0.001
UA (μmol/L) 305.0 (251.0–352.0) 311.0 (253.0–367.0) 333.0 (269.0–392.0) 351.0 (286.0–402.0) < 0.001
AST (U/L) 18.0 (16.0–22.0) 19.0 (16.0–23.0) 20.0 (17.0–24.0) 21.0 (18.0–26.0) < 0.001
ALT (U/L) 18.0 (14.0–25.0) 20.0 (15.0–30.0) 24.0 (17.0–36.0) 28.0 (20.0–42.0) < 0.001
γ-GGT (U/L) 14.0 (11.0–20.0) 16.0 (12.0–23.0) 19.0 (13.0–31.0) 25.0 (16.0–41.0) < 0.001 TC (mmol/L) 4.28 (3.78–4.80) 4.58 (4.07–5.11) 4.78 (4.21–5.35) 5.12 (4.54–5.78) < 0.001
TG (mmol/L) 0.73 (0.61–0.85) 1.05 (0.90–1.20) 1.44 (1.21–1.67) 2.28 (1.87–2.92) < 0.001
HDL-C (mmol/L) 1.36 (1.11–1.67) 1.29 (1.08–1.59) 1.22 (1.05–1.50) 1.22 (1.071.45) < 0.001
LDL-C (mmol/L) 2.27 (1.90–2.68) 2.56 (2.10–3.05) 2.73 (2.26–3.26) 2.89 (2.39–3.46) < 0.001
Apo-A1(g/L) 1.33 (1.17–1.49) 1.31 (1.14–1.49) 1.28 (1.11–1.49) 1.27 (1.10–1.47) 0.228
Apo-B(g/L) 0.77 (0.64–0.90) 0.86 (0.73–1.00) 0.95 (0.81–1.10) 1.06 (0.89–1.23) < 0.001
eGFR (mL/(min·1.73 m2)) 112.2 (99.8–127.1) 109.9 (99.1–123.4) 109.0 (97.1–123.7) 108.9 (96.3–123.5) < 0.001
HTN in each TyG group in our study (Tables 3 and 4). Compared with the lowest TyG group, the hazard ratios (95% CI) for subjects in quartile 2, quartile 3 and quartile 4 were 1.38 (1.20–1.59), 2.00 (1.74–2.29) and 2.63 (2.31– 3.00), respectively (pfor trend < 0.001). The same rela-tionship between the TyG index and incident HTN was also revealed even after adjusting for age and gender (Mode 1); or age, gender, and BMI (Mode 2); or age, gender, and all clinical variables (Mode3) in Table 4. These findings indicate that a higher TyG index is associ-ated with an increased risk of subsequent incident HTN.
Discussion
This population-based study demonstrates that there is a longitudinal relationship between the TyG index and the risk of incident HTN during a 9-year period among the Chinese population. We also found that the TyG index is an independent predictor for incident HTN. Cox re-gression analysis suggests that subjects with a higher baseline TyG index are significantly associated with a higher risk of incident HTN after adjusting for the con-founders. This study also confirms that the findings of relevant cross-sectional studies, which observe an inde-pendent positive relationship between the TyG index and incident HTN [12].
IR has been the significant risk factor for the develop-ment of HTN [10, 18] and it may be the mechanism in developing HTN in the population. Firstly, hyperinsuli-nemia caused by IR may increase sympathetic nervous system activity, promote the secretion of adrenaline and norepinephrine, and finally increase cardiac output and peripheral vascular resistance [19]. The high concentra-tion of catecholamine may thicken the vascular smooth muscle, and lead to luminal stenosis or HTN [20]. Sec-ondly, IR may also increase the activity of the renin-angiotensin-aldosterone system (RAAS), promote the reabsorption of H2O and Na+ indirectly, cause water-sodium retention and increase the vascular activity with noradrenaline and AT-II, leading to the HTN eventually [21, 22]. Slater [23] also found that IR could promote sodium retention in the kidneys in an animal experi-ment. Thirdly, IR could also increase the synthesis and release of endothelin, which may contract the blood ves-sels, and decrease the synthesis of prostacyclin (PGI2) and prostaglandin E2 (PGE2), which may dilate vessels [24, 25], and finally induce the proliferation of the vascu-lar smooth muscle, resulting in blood pressure elevation. Previous epidemiological studies have shown that the TyG index was a well-known predictor for the develop-ment of diabetes mellitus [26]. Our results indicated that Table 2Baseline characteristics of the subjects according to follow-up outcomes
Variables Subjects developed HTN (n= 2047) Subjects did not develop HTN (n= 2639) p
TyG 8.55 (8.20–8.92) 8.23 (7.92–8.59) < 0.001
Gender (male/female, n) 1541/506 1636/1003 < 0.001
Age (years) 44.0 (36.0–54.0) 38.0 (33.0–46.0) < 0.001
BMI (kg/m2) 23.6 (21.8–25.4) 21.7 (19.8–23.6) < 0.001
SBP (mmHg) 124.0 (117.0–131.0) 112.0 (105.0–120.0) < 0.001
DBP (mmHg) 80.0 (75.0–84.0) 71.0 (67.0–76.0) < 0.001
WC (cm) 81.0 (75.0–87.0) 75.0 (69.0–81.0) < 0.001
BUN (μmol/L) 5.09 (4.29–5.96) 4.86 (4.15–5.66) < 0.001
Cr (μmol/L) 74.0 (64.0–83.0) 71.0 (60.0–80.0) < 0.001
FPG (mmol/L) 4.53 (4.21–4.89) 4.37 (4.09–4.66) < 0.001
UA (μmol/L) 342.0 (284.0–395.0) 306.0 (250.0–364.0) < 0.001
AST (U/L) 20.0 (17.0–25.0) 19.0 (16.0–23.0) < 0.001
ALT (U/L) 25.0 (17.0–37.0) 20.0 (15.0–30.0) < 0.001
γ-GGT (U/L) 21.0 (15.0–34.0) 16.0 (11.0–24.0) < 0.001
TC (mmol/L) 4.83 (4.28–5.50) 4.56 (3.99–5.14) < 0.001
TG (mmol/L) 1.38 (1.01–2.02) 1.07 (0.80–1.51) < 0.001
HDL-C (mmol/L) 1.26 (1.07–1.52) 1.27 (1.08–1.58) 0.020
LDL-C (mmol/L) 2.73 (2.24–3.29) 2.51 (2.04–3.03) < 0.001
Apo-A1 (g/L) 1.29 (1.13–1.50) 1.30 (1.13–1.48) 0.815
Apo-B (g/L) 0.97 (0.81–1.14) 0.85 (0.71–1.01) < 0.001
the TyG index predicted the subsequent occurrence of HTN in a positive and dose-dependent manner. There-fore, the early detection of the TyG index may be benefi-cial for early interventions to prevent HTN among the Chinese population.
The major strengths of this study were the 9-year lon-gitudinal population-based study and the large number of the subjects. This longitudinal study also expanded the observation to establish the temporal sequence be-tween the TyG index and the later risk of HTN in China. Moreover, the selection bias was less likely to appear in the present study as annual health check-ups in
state-owned companies are mandatory in China. However, certain limitations also exist in this study. First, fasting insulin was not obtained due to the lack of relevant de-vices. Second, we did not record the information on nu-tritional habits or energy intake in this study. Although we did not adjust for this possible confounding factor, we used other additional covariates indirectly related to nutritional habits, such as BMI or cholesterol. Third, taking lipid-lowering medications or nutraceuticals might have influenced the lipids or the TyG index values. However, the percentage of subjects on these agents was towards the null, we did not think that it Table 3Univariate and multivariate Cox Proportional Hazard models of development of HTN during 9-year follow-up
Variables Univariate models Multivariate models
HR (95%CI) Pvalue HR (95%CI) pvalue
Gender (male) 1.62 (1.46–1.78) < 0.001 1.33 (1.14–1.56) < 0.001
Age (years) 1.03 (1.03–1.04) < 0.001 1.03 (1.02–1.03) < 0.001
BMI (kg/m2) 1.16 (1.15–1.18) < 0.001 1.09 (1.06–1.12) < 0.001
WC (cm) 1.06 (1.05–1.06) < 0.001 1.01 (1.00–1.02) 0.017
BUN (mmol/L) 1.11 (1.07–1.15) < 0.001 1.00 (0.96–1.04) 0.967
Cr (μmol/L) 1.00 (1.00–1.01) < 0.001 1.00 (1.00–1.01) 0.018
FPG (mmol/L) 1.26 (1.21–1.30) < 0.001 1.10 (1.03–1.18) 0.006
UA (μmol/L) 1.01 (1.00–1.00) < 0.001 1.00 (1.00–1.00) 0.006
AST (U/L) 1.01 (1.00–1.01) < 0.001 1.00 (1.00–1.01) 0.648
ALT (U/L) 1.00 (1.00–1.00) < 0.001 1.00 (1.00–1.00) 0.433
γ-GGT (U/L) 1.00 (1.00–1.01) < 0.001 1.00 (1.00–1.00) 0.001
TC (mmol/L) 1.28 (1.22–1.34) < 0.001 1.16 (0.95–1.43) 0.144
TG (mmol/L) 1.29 (1.25–1.33) < 0.001 1.08 (0.94–1.24) 0.264
HDL-C (mmol/L) 0.86 (0.77–0.97) 0.010 0.96 (0.74–1.25) 0.756
LDL-C (mmol/L) 1.31 (1.24–1.38) < 0.001 0.84 (0.70–1.02) 0.073
Apo-A1 (g/L) 1.02 (0.86–1.21) 0.812 1.07 (0.86–1.33) 0.562
Apo-B (g/L) 3.47 (2.95–4.09) < 0.001 1.15 (0.78–1.70) 0.490
eGFR (mL/(min·1.73 m2)) 1.00 (0.99–1.00) < 0.001 1.00 (1.00–1.00) 0.238
TyG < 0.001 0.013
Quartile 1 1.00 (reference) 1.00 (reference)
Quartile 2 1.38 (1.20–1.59) 1.21 (1.00–1.47)
Quartile 3 2.00 (1.74–2.29) 1.49 (1.16–1.93)
Quartile 4 2.63 (2.31–3.00) 1.53 (1.07–2.19)
Table 4Risk of development HTN according to baseline TyG categories in unadjusted and adjusted models
Models Quartile 1 (n = 1149) Quartile 2 (n = 1183) Quartile 3 (n = 1184) Quartile 4 (n = 1170) p
Unadjusted 1.00 (reference) 1.38 (1.20–1.59) 2.00 (1.74–2.29) 2.63 (2.31–3.00) < 0.001
Mode 1 (Adjusted for age and gender) 1.00 (reference) 1.32 (1.14–1.52) 1.79 (1.56–2.05) 2.21 (1.94–2.53) < 0.001
Mode 2 (Adjusted for age, gender, and BMI) 1.00 (reference) 1.19 (1.03–1.38) 1.51 (1.32–1.74) 1.71 (1.48–1.96) < 0.001
Mode 3 (Adjusted for age gender and all clinical variablesa)
1.00 (reference) 1.21 (1.00–1.47) 1.49 (1.16–1.93) 1.53 (1.07–2.19) 0.013
a
would influence the results. Fourth, physical activity may affect the blood pressure or lipids. However, the duration and intensity of our subjects’ physical activity in this study was almost similar, we did not think it would affect the results either. Finally, all subjects in the present study were enrolled from one hospital, so the conclusions may differ from the general population. Given these limitations, further studies should be carried out to clarify the above factors.
Conclusion
In conclusion, our study showed that the TyG index in-dependently predicted the incident HTN. These findings suggested that the TyG index should be introduced to the routine check-ups, which could benefit for the pre-vention of HTN.
Abbreviations
ALT:Alanine aminotransferase; AST: Aspartate aminotransferase; BMI: Body mass index; BUN: Blood urea nitrogen; Cr: Creatinine; CVD: Cardiovascular disease; DBP: Diastolic blood pressure; eGFR: Estimated glomerular filtration rate; FPG: Fasting plasma glucose; HDL-C: High density lipoprotein cholesterol; HTN: Hypertension; IR: Insulin resistance; LDL-C: Low density lipoprotein; RAAS: Renin-angiotensin-aldosterone system; SBP: Systolic blood pressure; SUA: Serum uric acid; TC: Total cholesterol; TG: Triglyceride; TyG: Triglyceride and glucose; WC: Waist circumference;γ-GGT:γ -glutamyltransferase
Acknowledgements
We appreciate all participants who took part in our study.
Funding
The study was supported by a grant of Ningbo Social Development (No. 2011C50021, 2016C51007).
Availability of data and materials All data are fully available without restriction.
Authors’contributions
RJZ carried out the study design, analysis and interpretation of data, and drafted the manuscript. YSM conceived the study, participating in its design and coordination, and helped in drafting the manuscript. Both authors read and approved the final manuscript.
Ethics approval and consent to participate
The study was performed in accordance with the guidelines of the Declaration of Helsinki. The study protocol and the form of consent were approved by the Ethics Committee of the Institutional Review Board of Zhenhai Lianhua Hospital and Affiliated Hospital of Ningbo University School of Medicine. Written informed consent was obtained from all participants before our gathering of data and the study.
Consent for publication Not applicable.
Competing interests
The authors declare that they have no competing interests.
Publisher’s Note
Springer Nature remains neutral with regard to jurisdictional claims in published maps and institutional affiliations.
Author details
1Department of Endocrinology, the Affiliated Hospital of Ningbo University
School of Medicine, 247 Renmin Road, Ningbo 315020, China.2Ningbo
University, Ningbo, China.
Received: 15 August 2017 Accepted: 4 September 2017
References
1. Leiba A, Twig G, Levine H, et al. Hypertension in late adolescence and cardiovascular mortality in midlife: a cohort study of 2.3 Million 16- to 19-year-old examinees. Pediatr Nephrol. 2016;31(3):485–92.
2. Lotfaliany M, Akbarpour S, Mozafary A, et al. Hypertension phenotypes and incident cardiovascular disease and mortality events in a decade follow-up of a Middle East cohort. J Hypertens. 2015;33(6):1153–61.
3. Quan H, Chen G, Walker RL. Incidence, cardiovascular complications and mortality of hypertension by sex and ethnicity. Heart. 2013;99(10):715–21. 4. Robitaille C, Dai S, Waters C, et al. Diagnosed hypertension in Canada:
incidence, prevalence and associated mortality. CMAJ. 2012;184(1):E49–56. 5. World Health Organization. A global brief on hypertension: silent killer,
global public health crisis. World health day 2013. Report, 1–39. Geneva, Switzerland: World Health Organization. p. 2013.
6. Dregan A, Ravindrarajah R, Hazra N, et al. Longitudinal trends in hypertension management and mortality among octogenarians. Hypertension.
2016;68(1):97–105.
7. Lacruz ME, Kluttig A, Hartwig S, et al. Prevalence and incidence of hypertension in the general adult population: results of the CARLA-cohort study. Medicine (Baltimore). 2015;94(22):e952.
8. Unger G, Benozzi SF, Perruzza F, et al. Triglycerides and glucose index: a useful indicator of insulin resistance. Endocrinol Nutr. 2014;61(10):533–40. 9. Er LK, Wu S, Chou HH, et al. Triglyceride glucose-body mass index is a
simple and clinically useful surrogate marker for insulin resistance in nondiabetic individuals. PLoS One. 2016;11(3):e0149731.
10. Lytsy P, Ingelsson E, Lind L, et al. Interplay of overweight and insulin resistance on hypertension development. J Hypertens. 2014;32(4):834–9. 11. Akande TO, Adeleye JO, Kadiri S. Insulin resistance in Nigerians with
essential hypertension. Afr Health Sci. 2013;13(3):655–60. 12. Jian S. Su-Mei N2, Xue C, et al. Association and interaction between
triglyceride-glucose index and obesity on risk of hypertension in middle-aged and elderly adults Clin Exp Hypertens. 2017;24:1–8.
13. Zhou M, Ma X, Li H, et al. Serum osteocalcin concentrations in relation to glucose and lipid metabolism in Chinese individuals. Eur J Endocrinol. 2009; 161(5):723–9.
14. Subcommittee G. 1999 World Health Organization - international society of hypertension guidelines for the management of hypertension. J Hypertens. 1999;17:151–83.
15. Simental-Mendía LE, Rodriguez-Morán M, Guerrero-Romero F, et al. The product of fasting glucose and triglycerides as surrogate for identifying insulin resistance in apparently healthy subjects. Metab Syndr Relat Disord. 2008;6(4):299–304.
16. Guerrero-Romero F, Simental-Mendía LE, Rodriguez-Morán M, et al. The product of triglycerides and glucosea simple measure of insulin sensitivity. Comparison with the euglycemic-hyperinsulinemic clamp. J Clin Endocrinol Metab. 2010;95(7):3347–51.
17. Xun L, Cheng W, Hua T, et al. Assessing glomerular filtration rate (GFR) in elderly Chinese patients with chronic kidney disease (CKD): a comparison of various predictive equations. Arch Gerontol Geriatr. 2010;51(1):13–20. 18. Sung KC, Lim S, Rosenson RS. Hyperinsulinemia and homeostasis model
assessment of insulin resistance as predictors of hypertension: a 5-year follow-up study of Korean sample. Am J Hypertens. 2011;24(9):1041–5. 19. Tack CJ, Smits P, Willemsen JJ, et al. Effects of insulin on vascular tone and
sympathetic nervous system in NIDDM. Diabetes. 1996;45(1):15–22. 20. Takagi M, Tanaka Y, Yamasaki Y, et al. Responsiveness of insulin-induced
cardiac sympathetic nerve activation associates with blood pressure regulation in diabetics. Am J Physiol Endocrinol Metab. 2003;284(5):E1022–6. 21. Saitoh S. Insulin resistance and renin-angiotensin-aldosterone system. Nihon
Rinsho. 2009;67(4):729–34.
22. Zemel MB. Insulin resistance vs hyperinsulinemia in hypertension: insulin regulation of ca2 +transport and Ca2 +regulation of insulin sensitivity. J Nutr. 1995;125:1 738–43.
23. Slater EE. Insulin resistance and hypertension. Hypertension. 1991;18(3 Suppl):1 108–14.
25. Axelrod L. Insulin, prostaglandins, and the pathogenesis of hypertension. Diabetes. 1991;10:1223–7.
26. Navarro-González D, Sánchez-Íñigo L, Pastrana-Delgado J, et al. Triglyceride-glucose index (TyG index) in comparison with fasting plasma Triglyceride-glucose improved diabetes prediction in patients with normal fasting glucose: the vascular-metabolic CUN cohort. Prev Med. 2016;86:99–105.
• We accept pre-submission inquiries
• Our selector tool helps you to find the most relevant journal
• We provide round the clock customer support
• Convenient online submission
• Thorough peer review
• Inclusion in PubMed and all major indexing services
• Maximum visibility for your research
Submit your manuscript at www.biomedcentral.com/submit