Volume 02, No. 4, April 2016
P
age
11
Optimization of Process Parameters of Aluminium Alloy
Material While Machining in High Speed Lathe Machine in
Wet Condition by Using Grey-Taguchi
Sibabrata Mohanty*,
Gopal krushna mohanta**
, Vikash kumar
Mahto***, Vineet Vimal Minj****, Ch Chandra Sekhar patro*****,
*Assistant Professors, Department of Mechanical Engineering, Gandhi Institute of Engineering and Technology, Gunupur, Rayagada Odisha,
**Assistant Professors, Department of Mechanical Engineering, Gandhi Institute of Engineering and Technology, Gunupur, Rayagada Odisha,
***B.Tech Mechanical Students, Gandhi Institute of Engineering and Technology, Gunupur, Rayagada Odisha
***B.Tech Mechanical Students, Gandhi Institute of Engineering and Technology, Gunupur, Rayagada Odisha
***B.Tech Mechanical Students, Gandhi Institute of Engineering and Technology, Gunupur, Rayagada Odisha
ABSTRACT
In today’s rapidly changing scenario in manufacturing industries, applications of optimization techniques in metal cutting processes is essential for a manufacturing unit to respond effectively to severe competitiveness and increasing demand of quality product in the market. The main objective of this study is to know under what parametric setting Cutting force and surface roughness is to be reduce in order to improve Surface finish and increase the tool life by changing the machining parameters of turning process. In this work, an attempt has been made to solve the correlated multiple criteria optimization problem of turning process by considering three different process parameters viz. Spindle Speed, feed and depth of cut. Grey Relational Analysis has been adopted to convert multiple objectives of the optimization problem into a single objective function, denoted as Grey Relational Grade. The overall Grey Relational Grade has been optimized by using Taguchi method. Analysis of variance (ANOVA) has been conducted for Grey relational grade (G R G) to find the optimal process parameters. Signal to Noise (S/N) Ratio has been found for GRG to find the optimal levels of the process parameters. Finally a conformation test has been made and the results have been plotted.
Keywords:Turning, Optimization, Grey-Taguchi and ANOVA
1.0 INTRODUCTION
Volume 02, No. 4, April 2016
P
age
12
contribution of each factors and their quantitative percentage during operation. To get the accurate percentage of contribution L27 orthogonal array is used in ANOVA analysis
whereas for Taguchi’s method L9 orthogonal array is used. K. G. Nikam et al. [2] found that
thehighest surface finish (lowest Ra) is obtained at a cutting speed of 200 m/min, feed rate of
0.2 mm/revolutions and a depth of cut of 0.5mm.The results of ANOVA for surface roughness show that feed rate is most significant parameter which affects the surface finish than other cutting parameters. Vikas B. Magdum et al. [3] This study used for optimization and evaluation of machining parameters for turning on EN8 steel on Lathe machine. This study investigates the use of tool materials and process parameters for machining forces for selected parameter range and estimation of optimum performance characteristics. Suha K. Shihab [14] concluded that cutting force components are influenced principally by the depth of cut, while the effect of both cutting speed and feed rate is small. On the other hand, the depth of cut has the most significant effect on the MRR; the cutting speed has less significant effect whereas feed rate has the lowest effect.
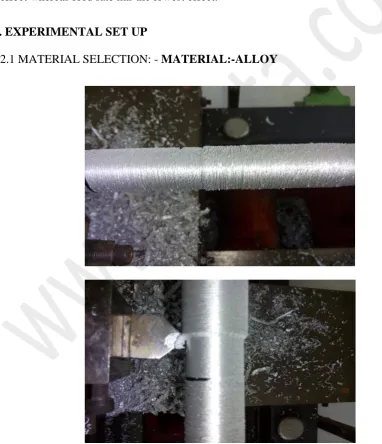
2. EXPERIMENTAL SET UP
2.1 MATERIAL SELECTION: - MATERIAL:-ALLOY
Volume 02, No. 4, April 2016
P
age
13
2.2 SURFACE ROUGHNESS:
Surface roughness, often shortened to roughness, is a measure of the texture of a surface. It is measured by an instrument called Surface roughness Tester.
Figure 2. Shows surface roughness tester
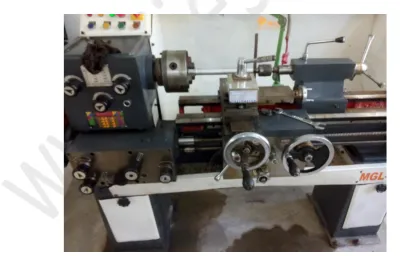
2.3 HIGH SPEED LATHE MACHINE:
It consists of 8 spindle speeds ranging from 70 R.P.M, 116, 186, 269, 315, 525, 842, and 1250. Each speed consists of 4 different feeds.
Volume 02, No. 4, April 2016
P
age
14
2.4 TOOL DYNAMOMETER:
It is a device used to measure the force exerted by tool to the work piece. We are measuring three types of forces (Fx, Fy, Fz). Fx=Feed force, Fy=Thrust force, Fz=cutting force
Figure.4 Shows tool dynamometer set up
2.5 MACHINING PARAMETERS:
In this investigation, for implementation of the concept of Design of Experiments; Speed, Feed and Depth of Cut are taken as input parameters and their levels are shown in table 1.
Thrust force (Fy), Feed force (Fx) and Cutting force (Fz) being the output parameters.
Condition Speed( RPM) Feed( mm/rev) Depth of Cut( mm)
High(+1) 315 0.690 1.5
Medium(0) 269 0.380 1.0
Low(-1) 186 0.094 0.5
Volume 02, No. 4, April 2016
P
age
15
Exp No
INPUT PARAMETERS
OUTPUT PARAMETERS Surface
roughness (Ra) Force
Speed Feed
Depth of Cut
Cutting Force(Fz)in Kgf
Feed Force(Fx) in Kgf
Thrust Force(Fy) in Kgf
Resultant Force in Kgf
(Actual)
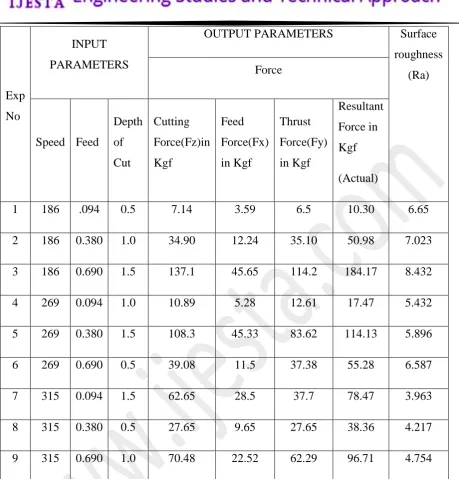
1 186 .094 0.5 7.14 3.59 6.5 10.30 6.65
2 186 0.380 1.0 34.90 12.24 35.10 50.98 7.023
3 186 0.690 1.5 137.1 45.65 114.2 184.17 8.432
4 269 0.094 1.0 10.89 5.28 12.61 17.47 5.432
5 269 0.380 1.5 108.3 45.33 83.62 114.13 5.896
6 269 0.690 0.5 39.08 11.5 37.38 55.28 6.587
7 315 0.094 1.5 62.65 28.5 37.7 78.47 3.963
8 315 0.380 0.5 27.65 9.65 27.65 38.36 4.217
9 315 0.690 1.0 70.48 22.52 62.29 96.71 4.754
Table 2. Shows experimental design matrix, Cutting force& Ra value for ALLOY.
3.0 OPTIMIZATION USING GREY RELATIONAL ANALYSIS COUPLED WITH TAGUCHI METHOD
Volume 02, No. 4, April 2016
P
age
16
experimental results are first normalized to convert the experimental data to grey relational coefficients. The Turning process parameters and three materials are optimized using Grey – Taguchi to get the minimum cutting force and surface roughness. Taguchi method is a powerful tool in quality optimization for manufacturing process.
3.1Methodology used in Grey Relational Analysis:
Getting experimental data: The experimental value for the four output responses are tabulated and are taken to optimization.
Normalization of experimental data: As the desired objective is to minimise cutting force and surface roughness, hence the experimental data is normalized by using the smaller -the-better (S.B) criterion the normalized data can be expressed below.
Here xi(k) is the value after the grey relational generation, min yi (k) is the smallest value of
yi (k) for the kth response, and max yi(k) is the largest value of yi(k) for the kth response .
Calculation of quality loss Estimates: An ideal sequence is x0 (k) for the responses.
The quality loss for each ith trial is estimated as x0(k) - xi(k).
Calculation of Grey Relational Coefficients: The purpose of grey relational grade is
to reveal the degrees of relation between the sequences say, [x0(k) and xi(k),i=1,
2,3...,16]. The grey relational coefficient xi (k ) can be calculated as
Then we have to find out Grey relational grade by using formula:
Volume 02, No. 4, April 2016
P age
17
Exp No INPUT PARAMETERSOUTPUT PARAMETERS Grey
relational
co-efficient
Ei (k) Force
Speed Feed
Depth of Cut Cutting Force(Fz) in Kgf Feed Force(Fx) in Kgf Thrust Force(Fy) in Kgf Resultant Force in Kgf (Actual) Normalisation value Taguchi loss(∆i)
1 186 .094 0.5 7.14 3.59 6.5 10.30 1 0 1
2 186 0.380 1.0 34.90 12.24 35.10 50.98 0.76 0.24 0.67
3 186 0.690 1.5 137.1 45.65 114.2 184.17 0 1 0.33
4 269 0.094 1.0 10.89 5.28 12.61 17.47 0.95 0.05 0.90
5 269 0.380 1.5 108.3 45.33 83.62 114.13 0.40 0.60 0.45
6 269 0.690 0.5 39.08 11.5 37.38 55.28 0.74 0.26 0.65
7 315 0.094 1.5 62.65 28.5 37.7 78.47 0.6 0.4 0.55
8 315 0.380 0.5 27.65 9.65 27.65 38.36 0.83 0.17 0.74
9 315 0.690 1.0 70.48 22.52 62.29 96.71 0.50 0.50 0.5
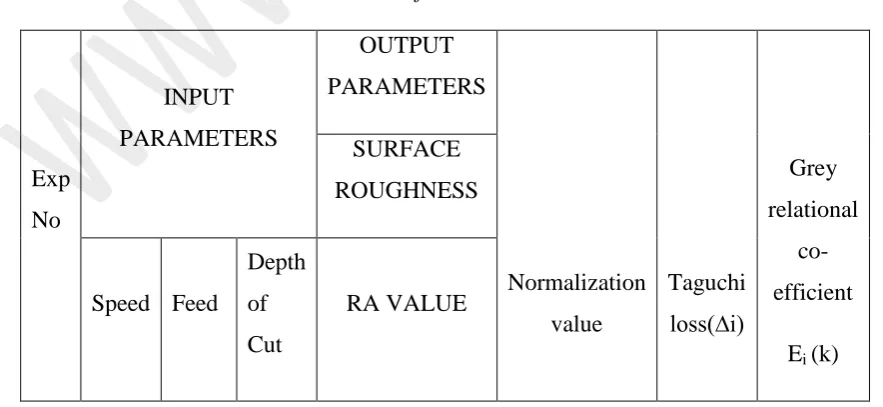
Table 3. Shows the normalised value, Taguchi loss and grey relational co-efficient for cutting force. Exp No INPUT PARAMETERS OUTPUT PARAMETERS Grey relational co-efficient
Ei (k)
SURFACE ROUGHNESS
Speed Feed
Depth of Cut
RA VALUE Normalization
value
Volume 02, No. 4, April 2016
P
age
18
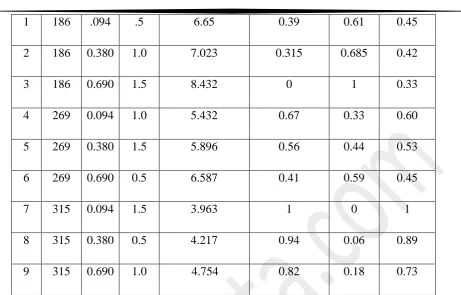
1 186 .094 .5 6.65 0.39 0.61 0.45
2 186 0.380 1.0 7.023 0.315 0.685 0.42
3 186 0.690 1.5 8.432 0 1 0.33
4 269 0.094 1.0 5.432 0.67 0.33 0.60
5 269 0.380 1.5 5.896 0.56 0.44 0.53
6 269 0.690 0.5 6.587 0.41 0.59 0.45
7 315 0.094 1.5 3.963 1 0 1
8 315 0.380 0.5 4.217 0.94 0.06 0.89
9 315 0.690 1.0 4.754 0.82 0.18 0.73
Table 4. Shows the normalised value, Taguchi loss and grey relational co-efficient for Surface Roughness.
No of experiment
Grey relational
co-efficientEi (k) for
Cutting force
Grey relational
co-efficientEi (k) for Surface
roughness
Grey relational
grade(Yi)
1 1 0.45 0.725
2 0.67 0.42 0.545
3 0.33 0.33 0.33
4 0.90 0.60 0.75
5 0.45 0.53 0.49
6 0.65 0.45 0.55
7 0.55 1 0.775
8 0.74 0.89 0.815
9 0.5 0.73 0.615
Volume 02, No. 4, April 2016
P
age
19
4 RESULT AND DISCUSSION:
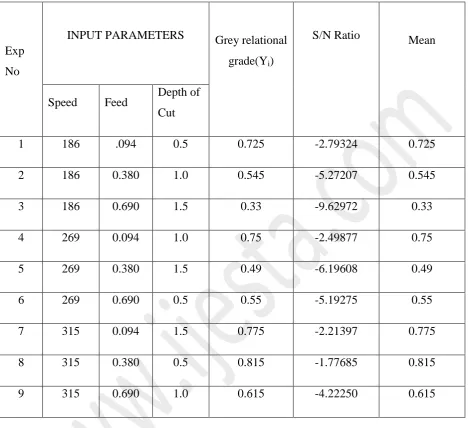
Exp No
INPUT PARAMETERS Grey relational
grade(Yi)
S/N Ratio Mean
Speed Feed Depth of
Cut
1 186 .094 0.5 0.725 -2.79324 0.725
2 186 0.380 1.0 0.545 -5.27207 0.545
3 186 0.690 1.5 0.33 -9.62972 0.33
4 269 0.094 1.0 0.75 -2.49877 0.75
5 269 0.380 1.5 0.49 -6.19608 0.49
6 269 0.690 0.5 0.55 -5.19275 0.55
7 315 0.094 1.5 0.775 -2.21397 0.775
8 315 0.380 0.5 0.815 -1.77685 0.815
9 315 0.690 1.0 0.615 -4.22250 0.615
Table 6. Shows SN ratio and mean obtained from MINI TAB Software
Volume 02, No. 4, April 2016
P
age
20
Taguchi Analysis: grey relational grade versus A, B, C
Response Table for Signal to Noise Ratios Larger is better
Level A B C 1 -5.898 -2.502 -3.254 2 -4.629 -4.415 -3.998 3 -2.738 -6.348 -6.013 Delta 3.161 3.846 2.759 Rank 2 1 3
Linear Model Analysis: SN ratios versus A, B, C
Estimated Model Coefficients for SN ratios
Term Coef SE Coef T P Constant -4.42177 0.1184 -37.358 0.001 A 1 -1.47657 0.1674 -8.821 0.013 A 2 -0.20743 0.1674 -1.239 0.341 B 1 1.91978 0.1674 11.469 0.008 B 2 0.00677 0.1674 0.040 0.971 C 1 1.16749 0.1674 6.975 0.020 C 2 0.42399 0.1674 2.533 0.127
S = 0.3551 R-Sq = 99.5% R-Sq(adj) = 98.0%
Analysis of Variance for SN ratios
Source DF Seq SS Adj SS Adj MS F P A 2 15.1775 15.1775 7.5887 60.19 0.016 B 2 22.1916 22.1916 11.0958 88.00 0.011 C 2 12.2269 12.2269 6.1134 48.49 0.020 Residual Error 2 0.2522 0.2522 0.1261
Total 8 49.8481
Volume 02, No. 4, April 2016
P
age
21
5. CONCLUSIONS
In the above study, the use of GRA-based hybrid Taguchi method has been proposed and adopted for the solution of multi-objective optimization in a turning process. Application of GRA can eliminate multi co linearity of the output responses and transform these correlated responses into uncorrelated quality indices called Grey Relational Grade. Absence of correlation between the responses is the basic assumption for applying Taguchi optimization technique. It can be recommended that the GRA based hybrid Taguchi method is good, for example, in the case of (chemical and pharmaceutical) industries when there are hundreds of response variables.
REFERENCES:
i. A. Manna, B. Bhattacharayya ――A Study of the Effects of Machining Parameters on
the Surface Roughness in the End-Milling Process‖‖. (2003)
ii. E. Kýlýc¸kap, O. C¸ akýr, M. Aksoy, A. Inan ――Study of tool wear and surface
roughness in machining of homogenized SiC-p reinforced aluminium metal matrix composite‖‖(2005).
iii. Yusuf Ozcatalbas ――Investigation of the machinability behaviour of Al4C3 reinforced
Al-based composite produced by mechanical alloying technique‖ Composites Science
and Technology 63 (2003) 53–61
iv. Singh, H. S., Khanna, R. A., Garg M. T., ―Effect of Cutting Parameters on MRR and
Surface Roughness in Turning EN-8‖, Current Trends in Engineering Research, Vol. 1, pp. 100-104, 2011.
v. Singh, D. H., Verma, M. D., ―Experimental Investigation of Surface Roughness and
MRR in dry turning of EN-8 on CNC Lathe‖, International Conference on Advancements and Futuristic Trends in Mechanical and Materials Engineering, Vol. 7, pp. 980-987, 2012.
vi. Kumar, K. J., Ratnam, C. S., Murthy, B. R. ―Optimization of Surface Roughness In
Face Turning Operation In Machining of EN-8‖, International journal of Engineering Science & Advance Technology, Vol. 2, pp. 807-812, 2012.
vii. Mandal, N. M., Doloi, B. B., Das, R. G., "Optimization of flank wear using Zirconia
Toughened Alumina (ZTA) cutting tool: Taguchi method and Regression analysis‖, Measurement, Vol. 44, pp. 2149-2155, 2011.
viii. Negrete, C. R., ―Optimization of cutting parameters using robust design for
minimizing energy consumption in turning of AISI 1018 steel with constant material removal rate‖, 11th Global Conference on Sustainable Manufacturing - Innovative Solutions, Vol. 8, pp. 149-152, 2013.
ix. Xavior, M. J., Adithan, M. P., ―Determining the influence of cutting fluids on tool
Volume 02, No. 4, April 2016
P
age
22
x. Yadav, A. S., Bangar, A. H., Sharma, R. K. and Pal, D. G., ―Optimization of Turning
Process Parameters for Their Effect on En 8 Material Work piece Hardness by Using Taguchi Parametric Optimization Method‖, International Journal of Mechanical and Industrial Engineering, vol.1, pp. 36-40, 2012.
xi. Aggarwal A., Singh H., Kumar P., Singh M., 2008. Optimizing power consumption
for CNC turned parts using response surface methodology and Taguchi's technique—
A comparative a nalysis, Journal of Materials Processing Technology, Vol. 200, No.
1– 3, pp. 373–384.
xii. Chen W.C., Lin S.-B., 2013. Process parameters optimization of multiple quality
characteristics in plastic injection molding using BPNN and GA, Journal of Applied
Physics and Mathematics, Vol. 3, No. 6, pp. 373-375.Deng J.L., 1989. Introduction to
grey system, Journal of Grey System, Vol. 1, No. 1, pp. 1-24.
xiii. S. K. Madhavi et.al, 2015 Optimization of turning process parameters by using