Volume 8, Issue 2 (2019) pp. 195-208
195 | Page Original Article
The New Revised Confidence Intervals for the Estimation
of Cost and Time in Project Completion
Mohammad Taghi Hajiali
*, Dr. Kamran Shahanaghi
Department of Industrial Engineering, Faculty of Industrial Engineering, University of Science and Technology, P.O.Box: 16846, Tehran, Iran
*Corresponding Author E-mail: [email protected]
Received: 24 October 2018, Revised: 05 December 2018, Accepted: 20 December 2018
ABSTRACT
One of the main challenges facing project managers is the evaluation of project progress and its earned value as well as the estimation of cost and time in project completion. In this paper, we attempt to develop a method which is based on confidence limits. The proposed method is of two approaches which distinguish the risks of activities implementation and the critical path in determination of confidence interval for completion cost and time. The above approach has applied a p-factor for weight determination in confidence intervals. In the final part, we will discuss the ways of applying these proposed methods and their importance with an example and also demonstrate the superiority of the above methods over the unmodified ones in a confidence interval.
Keywords: Earned Value, Confidence Interval, Critical Path, P-factor, Completion Cost,
Completion Time.
Introduction
Estimation of time and cost in project completion is one of the important and fundamental issues in the topic of project management. It has been revealed that in many projects, EVM output estimate for the final cost is of a high reliability (Lipke et al., 2009). The current status of project monitoring problem requires significant improvements for the development of cost estimation tools and also the optimal capability in reliable predictions at its time of implementation. All projects are already under a variety of risks and unexpected events which are certainly effective on the cost and time estimation of project completion. We take advantage of some
parameters and concepts in project management such as the concept of ES (Earned Schedule) and schedule adherence index/p-factor (which is used for risk assessment in the implementation) and also we will use some statistical tools like confidence intervals. The main objective of this article is to improve the estimates which are based on statistical approaches like confidence intervals, so that the desired risk can be entered into the estimates.
Problem Statement
Hajiali & Shahanaghi Int. J. Adv. Stu. Hum. Soc. Sci. 2019, 8(2):195-208
196 | Page
of project management. Barraza et al. (2004) used the concept of probable S curve (SS) in the calculation of project estimates. The above method is formulated on the basis of changeable nature of completion cost and time; thus random S curves will be generated through simulation. Lee (2005) introduced a project scheduling simulation software which will make the project completion possible regarding the input from user. The topic of EAC evaluation based on earned value is a common issue, which was primarily emerged for costs evaluation and management but later applied in completion time estimation. Cioffi (2006) offered a new formula for increasing the efficiency of earned value management. Vandevoorde and Vanhoucke (2006) compared the traditional and common methods and parameters of earned value in estimation (i.e. Sp & SPI) and also recently introduced methods in those years (i.e. SPI(t) & SV(t));
finally, they presented a structure to suit the type of project completion process. Vinter et al. (2006) investigated the possibility of using a data envelopment analysis for the evaluation of project completion in a space consisting of several projects; this evaluation is done through the system of earned value management and multidimensional control system. Vandevoorde and Vanhoucke (2007) investigated the careful evaluation of methods which are based on an earned schedule; it could be concluded from the above analysis that earned schedule parameters have a greater power in establishing a relationship between project completion time and earned value parameters. Lipke et al. (2009) offered a method to enhance the ability of project manager in the estimation of completion time; this method is composed of statistical techniques and earned value
parameters. Plaza and Turetken (2009) have discussed about the impact of learning on the performance of the project team and provided a developed method of earned value. Cheng et al. (2010) estimated the cost of construction projects by a revolutionary vector machine inference model. In their activities, they attempted to present a combination of genetic algorithms and vector machine which is called a revolutionary vector machine by importing effective factors in construction projects. Leu and Lin (2008) presented individual control charts for evaluating and identifying rapid changes in project parameters using statistical quality control techniques. Naderpour and Mofid (2012) reviewed earned value management in civil projects. Moslemi et al. (2013) offered a fuzzy approach for the concepts of earned value management. This idea has been based on the uncertainty of completion cost and time. Acebes et al. (2013) have offered a graphic method and structure for project monitoring and control. This is risky for integrating the dimensions of cost and schedule.
Review of Literature
197 | Page
environment. Caron et al. (2013) provided a model composed of Bayesian structure for further improvements of the estimates; in fact, the idea of this was to enter the opinions of expert into the model. Hunter et al. (2013) investigated the control and monitoring of costs in the form of earned value management systems. Khamooshi and Golafshani (20130) have presented a new approach in earned time management. Elshaer (2013) reviewed the impact of sensitive information on the estimation of earned value amounts; in his work, he attempted to update the parameters by offering some scales proportional to the kind of sensitivity. Nowadays, the issue of comprehensive and accurate project cost management
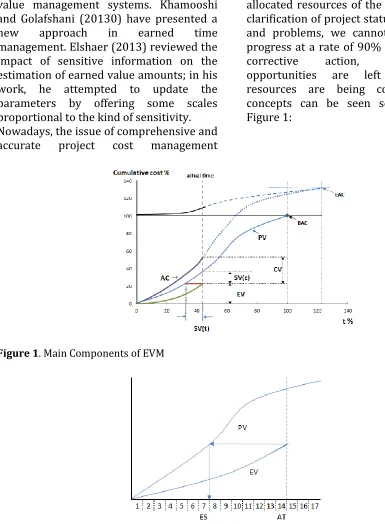
including resource planning, costs estimation, budgeting and cost control, has become one of the main concerns of project administrators and practitioners. For applying the earned value, we need a basic plan (planned value) which can be defined as the integration of scope and allocated resources of the project. For the clarification of project status and its issues and problems, we cannot wait until its progress at a rate of 90% and then take a corrective action, because no opportunities are left and project resources are being consumed. EVM concepts can be seen schematically in Figure 1:
Figure 1. Main Components of EVM
Hajiali & Shahanaghi Int. J. Adv. Stu. Hum. Soc. Sci. 2019, 8(2):195-208
198 | Page
AC= Actual Cost EV=earned value PV=planned value BAC= Budget At Completion
CPI= =Cost Performance Index
SPI= =Schedule Performance Index
EAC=estimate at complete SV(t) =schedule variance
SV(c) =cost variance CV =cost variance
ES =earned scheduling AT=actual time SAC= schedule at complete
P-Factor Indicator
In the most complex projects, many of the factors that were not considered in the initial time of implementation or were not observable, may occur in the along with great changes in the implementation with predetermined schedule (Loch et al., 2006). Direct application of EVM concepts and standards in such a condition will make the implementation risky and significantly influence the final cost of project implementation and completion time. P-factor is used to illustrate the impact of changes on the schedule or actual implementation. This indicator was first proposed by Lipke (2004); the way of
measuring this indicator is shown in equation 1:
N: A set of project activities
: design value of activity (i) at the moment of ES
: earned value of activity (i) at the current time of AT
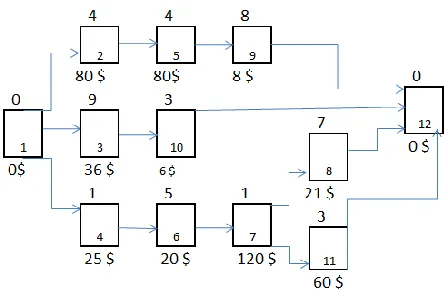
Such an indicator is responsible for the evaluation of implementation adherence in the schedule. Another remarkable point is that this indicator achieves some values in the interval [0,1], in which number 1 means a detailed and complete implementation according to the schedule. Generally, lack of accurate determination at the beginning of the project creates a degree of risk for cumulative EV (Amor, 2002). Since such an indicator will be used in the calculation of confidence interval, so we will make an example of its calculation. Suppose that the following project with the diagram of prerequisite relationships is like Figure 3; the time of activities is written on its top and costs are listed below. The Gant chart of activities has been shown in Figure 4:
199 | Page
Figure 4. Gant Chart of Activities
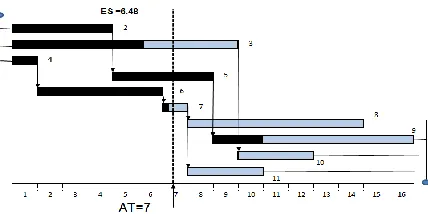
Real progress of the project until the seventh month is shown in Figure 5. By doing some calculations about work
progress as well as the re-adjustment of values, we will reach to final results in Figure 6.
Figure 5. Project Progress on the Basis of Schedule
Figure 6. The Actual Progress of the Project According to Initial Schedule Baseline
Hajiali & shahanaghi Int. J. Adv. Stu. Hum. Soc. Sci. 2019, 8(2):195-208
200 | Page
And finally, by replacement of values, we will have:
Confidence Intervals for Completion Time and Cost
One of the present statistical tools for the estimation of variables is providing specific intervals with a certain confidence level which instead of the point estimation of a variable (like completion time and cost), offers an interval for it. An interval estimation is done by the introduction of the two statistics L(X) & L(U) in which (L<U). Consider equation 2 (Ang et al., 1975).
( 2) It can be shown in relation to normal distribution that the values of these statistics will be calculated as follows.
In which is the population mean, s is sample standard deviation, n is the number of samples and is the value of normal distribution in . When we have small amounts of data, t distribution (t-student) can be used instead of normal distribution (z), also there is an urgent need for a finite population correction factor to reform the standard deviation. (These conditions mostly occur in reality where ).
In which N is the total number of our samples.
Lipke (2006 and 2009) investigated the data of schedule and cost indicators periodically and built a confidence interval for them. Lipke (2006) demonstrated that periodic values of SPIm and CPIm have a
log-normal distribution.
The Proposed Method
In this part, we will examine developed confidence intervals and the importance of critical path along with undeveloped confidence intervals for the calculation of completion time and cost. This work is presented in two sections which will be discussed in the following:
Creating a Confidence Interval for the Critical Path to Determine the Exact Time of Completion
One of the issues mostly related to the area of confidence interval determination for the completion time, is the time progression of critical path during the project implementation. For further explanation, we focus on the equation for
201 | Page
good condition at the schedule display. For further explanation in this field, take a scenario as an example in which a number of critical activities have delays and considerable arrears compared to their initial plan at the end of a reporting period, while non-critical activities are ahead of their predetermined schedule and as a result the SPI index value will be equal to 1. Obviously, such a value for SPI mistakenly implies this that the project is precisely being developed according to its objective without any delay, while in fact it has some delays and arrears. In other words, SPI index can hide the actual function of schedule. However, the significant point is that the critical path has a reasonable contribution in completion time determination due to its longest duration in the project, but this point is not being considered in offering confidence intervals for the schedule. In this section, we want to provide an example presenting the importance of confidence interval determination for the critical path along with the main confidence interval based on the overall index of SPI. Before presenting the example, we will introduce some critical path indexes. The proposed method considers the following issues:
First, we need to provide the main baseline of the critical path (CriPv) that is possible by incremental sum of planned value quantities for critical activities. Next, the critical path earned value (CriEV) will be displayed and finally we attempt to obtain (CriEs) value which is the critical path earned schedule through the following equation. (m value refers to the related month or period)
After determination of (CriEs) value, we can simply measure schedule performance index of the critical path (SPIcri).
The Apportionment of the Range of Probability Level in A Non-Equal Way on the Either Side of Confidence Interval Based On P-Factor Index
As Lipke et al. (2009) demonstrated the apportionment of confidence interval into the upper and lower limit has been done in a completely equal way (i.e.
Hajiali & Shahanaghi Int. J. Adv. Stu. Hum. Soc. Sci. 2019, 8(2):195-208
202 | Page
more concerned. However, there are many cases in which the emphasis on the accuracy of upper limit is more than the lower one.
This issue is very obvious in the most industrial projects which have a deadline for their implementation. It is very evident in oil and gas projects, because in cases of delivery delay, a lot of costs (in the form of lost profits) will be incurred on stakeholders. This issue emphasizes the projects in which one of the variables of time or cost is of a greater importance. It can be concluded that there are many projects in various industries which give different importance to the upper and lower confidence limit in time or cost completion. The objective of this section is to provide confidence intervals in which the confidence level for the upper and lower limit has been distributed unevenly by P-factor index. At the end, we will note a case for the explanation of the two mentioned methods. A new scale will be determined through the multiplication of the half of P-factor index by the value of
confidence level. )
With respect to the justification of this multiple, it can be implied that in cases where the value of P factor is equal to 1, we are precisely moving ahead according to schedule without any risks; Now by placing the value of 1 instead of the P factor, it can be seen that the values
will be equal and this implies an even distribution of confidence levels. At the same time, if the value of P factor is near to zero, it means that we will face some risks in the continuation of the project and the cost or time of completion will be increased. With respect to this approach, it can be concluded that more contributions of confidence levels should be allocated to
upper limit which significantly causes this:
As a result, this non-equation causes the upper limit to have an upward shift from its balance value (away from the mean value) and on the other hand causes the lower limit to be closer to the mean value.
As a result of these reforms in the value of Z, the confidence intervals for values of indexes will be presented in the form of the following equations 3 and 4. (Le: lower limit of effective; Ue: upper limit of effective)
(3)
(4) In cases where the number of our observations (n) is limited, we can use t distribution instead of the normal one resulting in the equations 5 and 6.
(5)
(6) Note that the value of n-1 shows the degree of freedom for t distribution.
Finally, we have provided update conditions for time intervals and the actual spent cost of the current time by applying equations 7 to 10.
(7)
(8)
(9)
203 | Page
: Value of the upper limit of effective for the estimation of completion final cost
Value of the lower limit of effective for the estimation of completion final cost
Value of the upper limit of effective for the estimation of completion final time
Value of the lower limit of effective for the estimation of completion Regarding the importance of critical path confidence intervals analysis (which was shown in the previous section), we will present its related equations in this part.
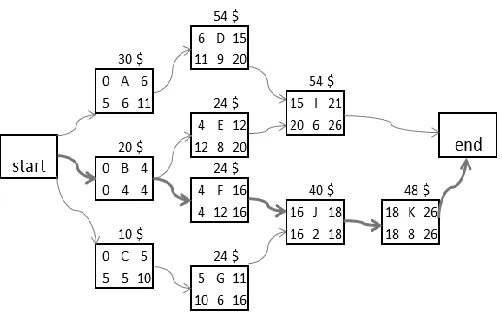
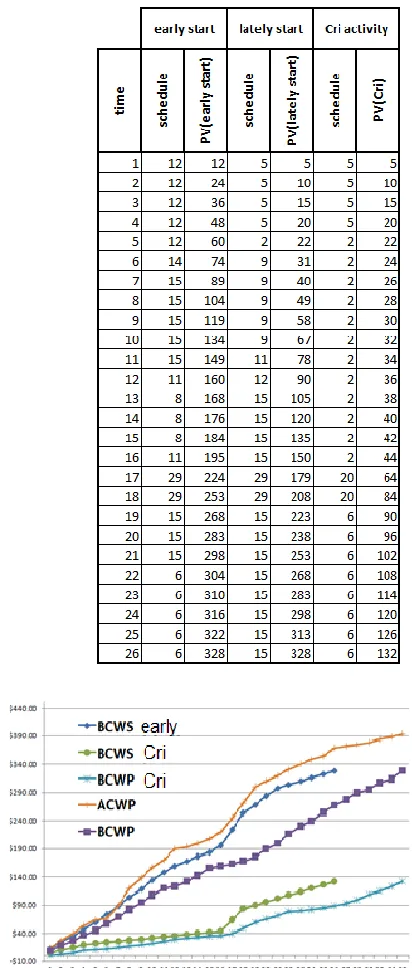
In this section, we examine the existing errors in confidence interval method with an example and then we will do reforms by the help of the mentioned methods. The given project duration is about 26 months according to its preliminary schedule whose PDM network is shown in Figure 7. The results of Table 2 are obtained by the related calculations of network diagram and activities duration. The analysis of the project baseline has been done under the three different scenarios (earliest-most recent-critical) in Table 3 and Figure 8.
Figure 7. PMD Network
Hajiali & Shahanaghi Int. J. Adv. Stu. Hum. Soc. Sci. 2019, 8(2):195-208
204 | Page
Table 3. Project Baseline
Figure 8. The Diagram of Project Progress
The diagram of project progress is shown in the above figure. It should be noted that the final time of project completion is in the 32th month. Now, we
will focus on the evaluation of applied methods in confidence interval determination by Lipke et al. (2009) for the estimation of completion time; the
205 | Page
shown in Figure 10, if we calculate the confidence intervals just on the basis of overall value of SPI, our upper limit value will be very close to the final value and even sometimes less than the final time
(32 months). The central index is also of an upward trend and somehow causes a disruption in the lower limit (imbalances over time).
Figure 9. The Confidence Intervals of Completion Time for the Entire Project
Figure 10. The Confidence Intervals of Completion Time Based on Critical Path
Due to the virtual display of work progress by SPI index, we will be confused mistakenly, while the index value presents a better performance for the time progression of the project. This issue is clearly observable from the diagram of confidence intervals of critical path schedule in Figure 10 and offers more stable results of completion time confidence intervals. Our recommendation is to use the critical path confidence
interval alongside the display of confidence interval for completion time (based on the SPI of entire project).
The idea of critical path confidence level application is recommended in conditions where the distribution of monthly values of SPIm is not following the normal log
Hajiali & Shahanaghi Int. J. Adv. Stu. Hum. Soc. Sci. 2019, 8(2):195-208
206 | Page
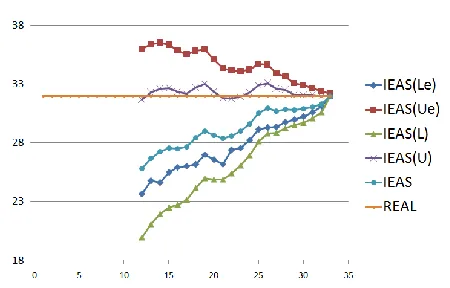
The second part of the present topic is the uneven distribution of Z value which is proportional to P-factor values as its related conditions were mentioned before. By monthly calculation of these values and their actions in presented confidence intervals and an upward shift of intervals, the results of confidence intervals for the estimation of completion final time will be
predicated in Figure 11. In order to compare the obtained results, we displayed again the initial estimations obtained from unadjusted (raw) Z value in Figure 11. As it is seen, by this adjustment, the limits of high and low estimates will be in a much better range than the original condition. The same procedure is applied in the estimation of completion cost.
Figure 11. Revised Confidence Intervals Along with Unrevised Ones
Conclusion
In this article, we investigated the issue of project completion time and cost estimation. One of the key issues that affect the estimation of project completion time is the critical path. In the first section of the proposed method, we referred to the significance of confidence interval (which is formed according to the overall index of SPI) and, finally, we attempted to create confidence intervals for the time of project completion by introducing schedule performance index of critical path (SPIcri). It is noteworthy that the application of this index is far more recommended especially when the overall index of SPI offers an unrealistic display of project progress. In the second section of proposed method, the significance of an uneven distribution of confidence level between the upper and lower limit due to the existence of risks was being emphasized and a method was provided for doing it. This distribution was
based on the coefficient of P-factor (which is known as a level of risk). At the end, we displayed the presented results compared to previous methods by providing an empirical example and proved that the revised confidence intervals are more accurate.
References
Amor J. (2002) Scheduling programs with repetitive projects using composite learning curve approximations. Project Management Journal 33:16–29.
Ang, A.H. and Tang, W.H. (1975), Probability Concepts in Engineering Planning and Design. Vol. 1: Basic Principles.
207 | Page
D.E. Lee, (2005) Probability of project completion using stochastic project scheduling simulation, Journal of Construction Engineering and Management 131 (3) .318–310
D.F. Cioffi, (2006) Designing project management: a scientific notation and an improved formalism for earned value calculations, International Journal of ProjectManagement 24 (2) 136–144.
Franco C., Fabrizio R., Alessandro M. (2013) A Bayesian Approach to Improve Estimate at Completion in Earned Value Management.
Fernando A., Javier P., José Manuel G., Adolfo L.P. (2013) Beyond Earned Value Management: A Graphical Framework for Integrated Cost, Schedule and Risk Monitoring. Procedia - Social and Behavioral Sciences 74 181 – 189.
G.A. Barraza, W.E. Back, F. Mata, (2004) Probabilistic forecasting of project performance using stochastic S curves, Journal of Construction Engineering and Management130 (1) 25–32.
G. Vitner, S. Rozenes, S. Spraggett, (2006) Using data envelope analysis to compare project efficiency in a multi-project environment, International Journal of ProjectManagement 24 (4) 323–329.
Hazır, Ö., & Shtub, A., (2011). Effects of the information presentation format on project control. Journal of the Operational Research Society, 62, pp. 2157-2161.
HomayounKhamooshi,Hamed
Golafshani(2013). EDM: Earned Duration Management, a new approach to schedule performance management and measurement. International Journal of Project Management , In Press, Corrected Proof, Available online 19 December 2013.
Howard H., Richard F., Dewey B. (2013). Improved cost monitoring and control through the Earned Value Management System. Acta Astronautica, Volume 93, January 2014, Pages 497-500.
Leila Moslemi N., Shahram S., Amir S. (2013) A fuzzy approach for the earned value management. International Journal of Project Management xx. in press
Loch C., De Meyer A., Pich M. (2006) Managing the unknown: A new approach to managing high uncertainty and risk in project. John Wiley and Sons, Inc., New Jersey.
M. Vanhoucke, S. Vandevoorde, (2007) A simulation and evaluation of earned value metrics to forecast the project duration, Journal of the Operational Research Society 58 (10) 1361–1374.
M. Plaza, O. Turetken, (2009) Amodel-based DSS for integrating the impact of learning in project control, Decision Support Systems 47 (4) 488–499
Min-Yuan C., Hsien-Sheng P., Yu-Wei W., Te-Lin C. (2010). Estimate at Completion for construction projects using Evolutionary Support Vector Machine Inference Model. Automation in Construction 19 619–629.
Raafat Elshaer(2013), Impact of sensitivity information on the prediction of project's duration using earned schedule method. International Journal of Project Management, Volume 31, Issue 4, May 2013, Pages 579-588.
Hajiali & Shahanaghi Int. J. Adv. Stu. Hum. Soc. Sci. 2019, 8(2):195-208
208 | Page
S.S. Leu, Y.C. Lin, (2008) Project performance evaluation based on statistical process control techniques, Journal of Construction Engineering and Management 134(10) 813–819.
Vanhoucke, M., (2011). On the dynamic use of project performance and schedule risk information during project tracking. Omega, 39, pp. 416-426
Vanhoucke, M., (2012). Measuring the efficiency of project control using fictitious and empirical project data. International Journal of Project Management, 30, pp. 252-263.
W. Lipke, O. Zwikael, K. Henderson, F. Anbari, (2009) Prediction of project outcome: the application of statistical methods to earned value management
How to cite this article: Mohammad Taghi Hajiali, Dr.Kamran Shahanaghi, The