Evaluation of Commercial Trout Feeds: Feed Consumption, Growth, Feed
Conversion, Carcass Composition and Bio-economic Analysis
Introduction
Feed and feeding are among the most important factors influencing growth, feed utilization and tissue composition of the fish in intensive culture. Thus, much work has been carried out to elucidate nutritional requirements, feeding rates, growth and feed conversion ratios of salmonids. The basic nutrient requirements of the salmonids have been estimated (e.g. Cho, 1990; Cho and Cowey, 1991; Cowey, 1992; NRC, 1993) and recommendations made regarding daily feeding rates (Austreng et al., 1987; Storebakken and Austreng, 1987; Cho, 1990; Storebakken et al., 1991; Alanärä, 1992a; 1992b). Although diets are formulated in accordance with the intended nutritional composition required, even with substantial attempts to balance nutrition and energy contents during the formulation, the composition of the final feed may deviate somewhat from the expected levels due to variations in the manufacturing process and the physical characteristics of the resultant pellets (Tacon, 1993; De Silva and Anderson, 1995; Thomas and van der Poel, 1996).
Most of the feeding studies on salmonids have been performed in northern countries and data for fish held at elevated water temperatures are limited. Thus, there seems to be a general agreement that most of the current feeding charts should be used with precaution and need to be refined and adapted to specific conditions by taking into account additional
parameters such as genotype, growth potential, culture system and diet properties (Jobling et al., 1995; Johansen and Jobling, 1998). As stated by Tacon (1993) feeding of fish within each husbandry system and under prevailing environment conditions should be considered as being unique and evaluated on its own merits. Consequently, evaluating the performance of the diets in or near commercial culture conditions and developing reliable feeding charts applicable to specific conditions may have great importance for optimising growth, feed conversion, quality of the product (Jørgensen et al., 1996) and economic rationalization of the production.
Rainbow trout (Oncorhynchus mykiss, Walbaum) with an annual production of ca 40 thousand tons is the most widely cultured species in Turkey. Trout are usually cultured at relatively high altitudes, but some lowland farms may experience temperatures over 21°C during the summer months. Although extruded feeds have been widely used in many countries, steam pelleted feeds are still the main or standard feeds for raceway rainbow trout culture in Turkey. Basic records are not kept, thus there is no reliable information on feeding rates, growth and feed conversion. The objective of the present study was to evaluate (daily consumption, growth, feed conversion, tissue composition and bio-economy) three commercial trout feeds over a full on-growing period under summer-autumn ambient environmental conditions.
Abstract
Feed consumption (FC), growth, condition factor (CF), feed conversion (FCR), tissue composition and the bio-economics of production were examined in juvenile rainbow trout (Oncorhynchus mykiss) fed three commercial steam pelleted feeds over 22 weeks. Fish were held in six 300 l fiberglass tanks with two replicates of 50 fish (initial weight ca.16.5 g and CF ca. 1.24) per treatment. The trial was run at ambient temperature (10.8-23.3ºC) under natural summer-autumn photoperiod (40º55'N 40º12'E) and the fish were fed to apparent satiation twice per day.
All feeds exhibited characteristics of a typical “standard” trout grower and among the main nutrient components only protein contents slightly differed from manufacturer’s declarations. Mean weights of the fish at the end of the trial were 383.6, 359.6 and 366.9 g, the final weight of the fish given feed A being significantly higher than those given feeds B and C (P<0.05). CF increased during the course of trial and was ca 1.6 at termination with small differences among groups. Mean daily feed consumption varied from 1.1 to 4.4% of body weight (bw), but overall means of the groups showed slight variations, 2.11-2.22% of bw. FCR and the protein efficiency ratios (PER) were within the ranges 1.04-1.12 and 2.03-2.08 and did not differ significantly among groups. Feed did not influence on dressing percentage, but it seemed to affect on lipid content of the tissue. Feed cost of kg weight gain was highest for feed C, while it was similar for other two feeds.
Key Words: Rainbow trout, Oncorhynchus mykiss, feeding, feed consumption, growth, feed conversion, tissue composition, bio-economic analysis
øbrahim Okumuú1,*
, Mehmet Derya Mazlum2
1
Karadeniz Technical University, Faculty of Marine Sciences, Department of Fisheries, 61530 Çamburnu, Trabzon, Turkey
2
Kaúüstü Primary School, Yomra, Trabzon, Turkey
* Corresponding Author: Tel.: +90. 462 752 28 05/ext. 125; Fax: +90. 462 752 21 58; E-mail: [email protected]
Materials and Methods
The trial was designed as three treatments (i.e., feeds called A, B, and C) with two replicates and performed under ambient conditions (long to decreasing day-lengths and relatively high water temperatures) in North-eastern Turkey (40º55' N 40º12' E) for 22 weeks from July to December. Four hundred and fifty juveniles (mean weight of 16.5 g) were divided randomly amongst six circular fibreglass tanks with a volume of 0.32 m3. Prior to the start of trial the fish were acclimated to trial conditions and the feeds for three days. All tanks were supplied with stream water during the first three months and after that 50:50% mixture of stream and brackish water of the Black Sea. Water input increased from 1.1 up to 16 l/min depending on fish size, stocking density and temperature.
Water temperature and feed given were recorded daily, while dissolved O2content in the water outlet
was measured weekly. Growth rates (weight gain) were followed by bulk-weighing the fish in each tank to the nearest 2 g at 31, 62, 93, 124 and 155 days, hereafter termed P0 (initial), P1, P2, P3, P4 and P5,
each time after a day of feed deprivation. In addition, individual weights (±0.01 g) and total lengths (±1 mm) of 20 fish from each tank were taken to estimate condition factors. The fish were also weighed individually at the end of the experiment. Those fish handled individually (weighed or measured) were anaesthetised (50 ppm MS-222) before handling. At the end the trial ten fish from each group were sacrificed and used for flesh composition and carcass
weight (dressing) determinations.
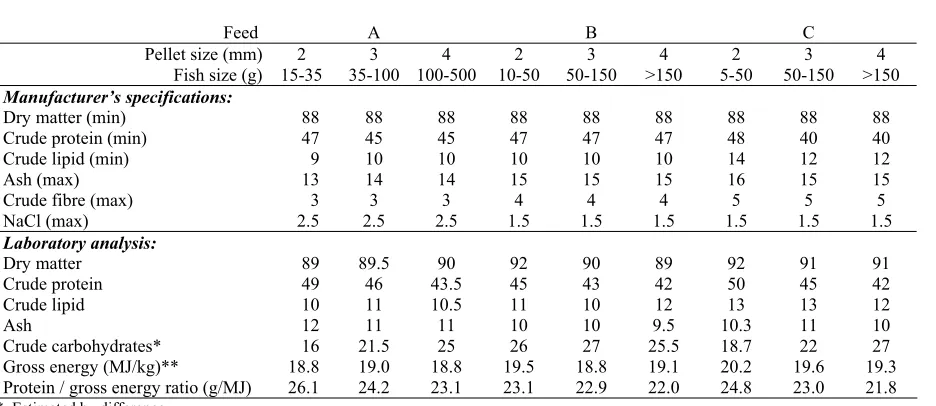
Pellet sizes and proximate compositions of the feeds are given in Table 1, but due to commercial reasons it was not possible to obtain exact formulations. Pellet size was increased according to manufacture’s recommendations as the fish grew. Feeding was conducted manually 7 days a week two times (9 a.m. and 4 p.m.) a day to satiation by observation of the feeding activity. The amount of feed given at each meal was recorded and uneaten feed in tanks were collected twice a week.
Feeds and tissue (flesh) samples of the fish, five individual from per group, were analysed in triplicate for dry matter, crude protein, crude lipid and ash. Crude protein (N x 6.25) was determined after acid digestion (Kjeldahl, total nitrogen x 6.25), lipid after extraction with petroleum ether in a Soxhlet apparatus, dry matter after drying at 100-105ºC for 24 h and ash after combustion at 550ºC for 12 h. Nitrogenfree extract (NFE) was estimated as 100 -(protein + lipid + ash + water), while gross energy values were calculated assuming that the energy value of protein, lipid and carbohydrate are 23.7, 39.5 and 17.2 MJ/kg, respectively (NRC, 1993).
The feeds were evaluated using following parameters calculated from the data collected: i) Specific Growth Rates (SGR, %/day) = [(lnWT
-lnWt)/T-t] x100; ii) Condition Factor (CF) = (W / L3)
x 100; iii) Coefficient of Variation (CV) = (SD/w) x100; iv) Feed Consumption (FC, % w/day) = (feed given – feed uneaten / W) x 100; v) Feed Conversion Ratio (FCR) = Total feed consumption / Weight gain; vi) Protein Efficiency Ratio (PER) = (WT-Wt) /
Table 1. Approximate composition and calculated values of feeds tested.
Feed A B C
Pellet size (mm) Fish size (g)
2 15-35 3 35-100 4 100-500 2 10-50 3 50-150 4 >150 2 5-50 3 50-150 4 >150 Manufacturer’s specifications:
Dry matter (min) Crude protein (min) Crude lipid (min) Ash (max) Crude fibre (max) NaCl (max) 88 47 9 13 3 2.5 88 45 10 14 3 2.5 88 45 10 14 3 2.5 88 47 10 15 4 1.5 88 47 10 15 4 1.5 88 47 10 15 4 1.5 88 48 14 16 5 1.5 88 40 12 15 5 1.5 88 40 12 15 5 1.5 Laboratory analysis: Dry matter Crude protein Crude lipid Ash Crude carbohydrates* Gross energy (MJ/kg)**
Protein / gross energy ratio (g/MJ) 89 49 10 12 16 18.8 26.1 89.5 46 11 11 21.5 19.0 24.2 90 43.5 10.5 11 25 18.8 23.1 92 45 11 10 26 19.5 23.1 90 43 10 10 27 18.8 22.9 89 42 12 9.5 25.5 19.1 22.0 92 50 13 10.3 18.7 20.2 24.8 91 45 13 11 22 19.6 23.0 91 42 12 10 27 19.3 21.8
*. Estimated by difference
. Okumu and M.D. Mazlum/ Turk. J. Fish. Aquat. Sci. 2: 101-107 (2002) 103
protein intake, vii) Dressing percentage =
(Wgutted)/Wungutted) x 100, where WT and Wt are
weights (g) of the fish at day T and t, respectively;
Wgutted and Wungutted are the weights of gutted and
ungutted fish; L is total length of the fish (cm). Bio-economic analyses of the feeds were performed using weight gains, total amount of feed consumed and the prices of the feeds and fish. All other running costs were assumed equal and were not taken into account.
The mean and standard deviation (±SD) were calculated for parameters in each group and one-way analysis of variance (ANOVA) was used to test for differences among feeds or groups, and where significant differences (P<0.05) were found a multiple comparison test (Tukey) was used to determine the different group(s).
Results
Water temperature and dissolved oxygen fluctuated between 10.8-23.3˚C, and 8.0-9.7 mg/l (Figure 1), while salinity (during the last two periods) was around 7.0-10.0‰.
No disease or parasite problems occurred during the trial and there were no mortality. All the feeds tested were well accepted by the fish. The changes in live weights, SGR and CF are presented in Figures
2-4 and summarised in Table 2.
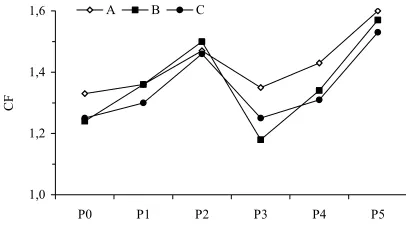
Mean weights of the fish increased from around 16.5 g to 359.6-383.6 g, and the final mean weight of the fish fed with feed “A” were significantly higher than those of other groups (P<0.05). The initial size variations (CV) within the groups and changes during the trial differed significantly (P<0.05), but final values were not significant (Table 2). SGR values were highest in all groups with mean values of around 4% during the first period, declined gradually during following three periods and almost levelled of just over 1.0 in the last period (Figure 3). With exception of the last two periods, SGR significantly differed between the successive periods in all groups (P<0.01). CF also increased considerably showing fluctuations in all groups (Figure 4) and fish fed with feed “A” had a slightly higher final CF values than those of the fish fed “C”.
Similar to final body weights, mean carcass (gutted) weights of the group receiving feed “A” was significantly greater than those of other groups. Feeds had no significant effects on carcass composition. On the other hand, dry matter (r=0.96), lipid (r=0.88) and protein (r=0.92) contents of tissue (expressed as %) tended to increase with fish size, but no significant correlation was observed between CF and carcass components. There was a weak correlation between final body weight and CF (r=0.62).
Table 2. Growth, condition factor, stocking densities, feed consumption and conversion, protein efficiency ratio and tissue composition of rainbow trout fed three commercial feeds (mean ± SD). Superscript letters (e.g. “a” and “b”) indicate significant differences at p<0.05 or less between treatments of factors.
Feeds
Parameters A B C
Wi 16.54±3.48 16.51±3.24 16.50±2.70
Live weight (g)
Wf 383.6±96.3b 359.6±93.3a 366.9±84.2a
CVi 21.06±3.88 b 19.61±1.40 b 16.27±5.11a
Coefficient of variation (CV, %)
CVf 25.1±2.43 a 26.02±3.00 a 22.95±0.12a
ǻCV (CVf/CVi) 1.19±0.1a 1.33±0.2b 1.41±0.3b
(g/day) 2.37±0.08 2.21±0.12 2.26±0.14
Weight gain (%/day) 3.18±0.08 3.09±0.06 3.08±0.1
SGR (%/day) 2.03±1.13 1.99±1.13 2.00±1.08
Initial 3.90±0.11 3.88±0.06 3.89±0.10 Stocking density (kg/m3)
Final 90.5±3.06 84.8±4.47 86.5±5.23 Initial 1.23±0.14 1.24±0.09 1.25±0.11 Condition factor
Final 1.60±0.50 1.57±0.11 1.53±0.09
PER 2.08±0.00 2.07±0.10 2.03±0.07
Gross energy Consumption (MJ/kg gain) 17.6±0.01a 19.4±0.07b 19.8±0.12b Final carcass weight (g) 335.3±37.8 322.6±25.7 323.2±49.3
Dressing percentage 88.4±1.52 90.7±1.96 89.1±1.8
Tissue approximate analysis: Dry matter
Crude protein Crude lipid Ash
26.8±1.31 18.4±0.33 6.8±0.29b 1.5±0.24
25.9±0.87 18.2±0.37 5.8±0.34a 1.7±0.16
10 15 20 25
P1 P2 P3 P4 P5
Periods
T (°C
)
7 8 9 10 11
DO (mg/l
)
T (ºC) DO (mg/l)
Figure 1. Mean values (with monthly ranges) water temperature and dissolved oxygen of rearing water during the study period.
0 50 100 150 200 250 300 350 400
P0 P1 P2 P3 P4 P5
Periods
W
eight (g
)
A B C
Figure 2. Increments in mean weight of rainbow trout fed three commercial feeds.
1,0 1,5 2,0 2,5 3,0 3,5 4,0 4,5
P1 P2 P3 P4 P5
Periods
SG
R (
%
/d
ay
)
A B C
Figure 3. Variations in specific growth rates during the trial period.
1,0 1,2 1,4 1,6
P0 P1 P2 P3 P4 P5
Periods
CF
A B C
Figure 4. Variations in condition factors during the trial period.
FC and FCR values are presented in Table 3. Total feed supplies for feeds “A”, “B”, and “C” during trial was 57.8, 57.6 and 58.4 kg, respectively. FC was around 3.8-4.4% of bw (16.5-56.5 g) during the first period and decreased gradually to 1.1-1:3% through end of the trial. There were significant variations in FC between the groups during the first two periods, but the values were very similar when the entire trial period was evaluated. FCR values were high during the first period, particularly for feeds “B” and “C”, and fluctuated slightly during the rest of the trial. In spite of some differences during the first three periods, mean FCR values ranging between 1.04 and 1.12 did not differ significantly over the entire trial. Fish fed with feed “A” had a significantly lower intake of energy per kilogram gain, whereas PER values were very similar for all feeds (Table 3).
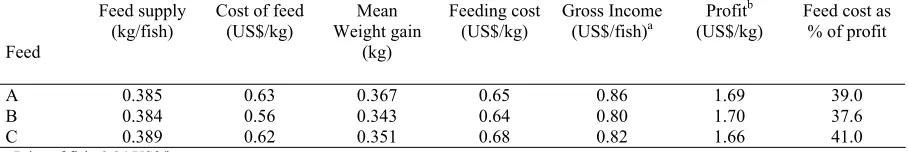
Bio-economic analysis of the feeds showed that feeding cost (US$/kg weight gain) of the feed “C” was slightly higher than those of the feeds “A” and “B” (Table 4). Thus, profit from the later feeds was slightly higher than the former.
Discussion
Three commercial steam pelleted rainbow trout feeds were evaluated at summer-autumn temperatures ranging from 10.8 to 23.3ºC over a full rearing period. Fish grew from around 16.5 to 360-384 g mean weight during 22 weeks trial period. The feeds had significant effect only on the final weights of the fish. Daily feed consumption and total amount of feed supplied during the entire trial indicated that the feeding was not restricted. Thus, differences in growth performances of the fish can be attributed into quality of the feeds.
. Okumu and M.D. Mazlum/ Turk. J. Fish. Aquat. Sci. 2: 101-107 (2002) 105
effects of these differences were responsible for differences in final weights of the groups.
Experimental fish grew quite rapidly reaching over 350 g in five months. This is much faster than growth in commercial farms of the region where they hardly reach size of 60-80 g during the same period. These marked differences have been caused by several factors, including water quality parameters, general husbandry and feeding practices. Water temperature certainly has major influence on food consumption and growth. Optimum growth temperature for rainbow trout has been accepted as 15-17ºC (Stevenson, 1987; Cho and Cowey, 1991; Sumpter, 1992), whereas during the warmest seasons maximum values were 20.0-21.5ºC (Solbé, 1988). Particularly during the first three periods of the trial, water temperatures were almost over 20ºC and around optimum only during the last two periods. Temperatures with daily maximums of up to 23.3ºC did not seem to have observable adverse effect on survival, feeding and growth. Alanärä (1992a) reported a positive relationship between FCR and temperature, but up to 15-18°C after that the growth rate declines. Similarly, Oliva-Teles and Rodrigues (1993) claimed that protein and energy digestibility may improve at high temperatures. Apart from the effects of daily variations during the third period, high temperatures experienced in present study have not cause observable feed losses or reductions in growth rate. Thus, in spite of higher temperatures of around recommended maxima, feeding activity and growth can be sustained as long as dissolved oxygen levels are adequate. In fact, oxygen consumption at optimum
(around 16ºC) and a higher temperature (21.5ºC) may not differ significantly (Oliva-Teles and Rodrigues, 1993). In addition, rainbow strains originating from cold (northern Europe) and from warmer regions (southern Europe) may have different temperature optima for feeding and growth (Sumpter, 1992).
The growth rates (SGR) of the experimental fish for the entire trial were around 2.0%. These values were the same magnitude as reported by Austreng et al. (1987) and higher than that observed by Storebakken et al. (1991) for approximately similar size fish fed with full ration at around optimum temperatures. Size variation increased in all groups during the course of the trial (Table 2). At least some part of this can be accounted for competition for food (Jobling et al., 1995, Johansen and Jobling, 1998) and space, as the stocking density was quite high. Increments in size variation seemed to be higher amongst fish received feeds “B” and “C” than those fish fed with feed “A”. This may indicate that increases in size variation with time were associated with growth depensation (Johansen and Jobling 1998). In spite of marked fluctuations, CF increased considerably in all groups during the trial and there were slight differences in final values (Table 2; Figure 4). These final values approaching 1.6 indicate full feeding (Johansson et al., 1995).
Dressing percentages correlated negatively with body weights. This was because the head, fins and viscera made up a disproportionately large part of the fast growing fish as compared with small ones (Johansson et al., 1995). Changes in tissue composition mainly related to water and lipid content, Table 3. Mean (±SD) of FC and FCR values in each trial period. Superscript letters as in Table 2.
FC (%W/day) FCR
Periods A B C A B C
P1
P2
P3
P4
P5
3.82±0.19a 2.46±0.01b 1.85±0.13a
1.31±0.05a 1.11±0.01a
4.37±0.13b 2.32±0.11b 1.83±0.24a
1.29±0.03a 1.31±0.13a
4.42±0.04b 2.10±0.01b 1.91±0.13a
1.35±0.00a 1.27±0.15a
1.08 ±0.08b 1.23±0.03b 1.17±0.09a
1.09±0.11a 0.89±0.01a
1.25±0.03b 1.16±0.02ab 1.29±0.12b
1.11±0.14a 1.00±0.11a
1.29±0.06b 1.07±0.00b 1.18±0.06a
1.06±0.03a 1.06±0.17a
Overall 2.11±1.09 2.22±1.27 2.21±1.29 1.04±0.00 1.12±0.05 1.11±0.03
Table 4. Bio-economical analysis of the feeds.
Feed
Feed supply (kg/fish)
Cost of feed (US$/kg)
Mean Weight gain
(kg)
Feeding cost (US$/kg)
Gross Income (US$/fish)a
Profitb (US$/kg)
Feed cost as % of profit
A 0.385 0.63 0.367 0.65 0.86 1.69 39.0
B 0.384 0.56 0.343 0.64 0.80 1.70 37.6
C 0.389 0.62 0.351 0.68 0.82 1.66 41.0
a: Price of fish: 2.34 US$/kg
protein level was not affected by feeds. Tissue lipid content of the fish fed with feed “A” was higher than that of the other fish, although, crude lipid level of that feed was slightly lower than the others. A positive relationship between tissue lipid content and weight were also found by Johansson et al. (1995). Lack of relationship between condition factor and dressing percentage indicates that the increased CF was at least partly due to increasing gut percentage and lipid deposits in the peritoneal cavity (Storebakken and Austreng, 1987; Storebakken et al., 1991).
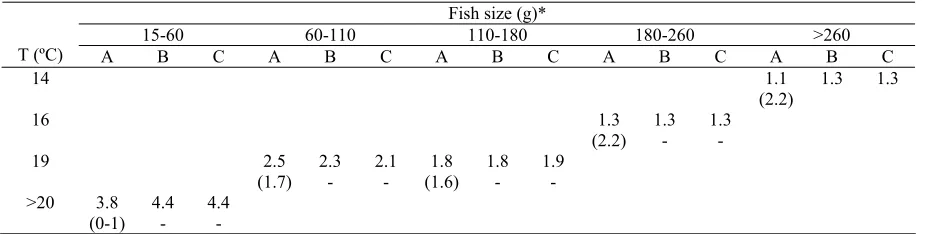
There were no significant differences between the groups concerning the food consumption and feed conversion ratios. Only feed “A” had manufacturer’s “feeding chart” and daily feeding rates recommended at temperatures over 18ºC were considerably lower than values assessed in this trial, while rates suggested for near optimum temperatures is almost twice of the determined values (Table 5). Determined feed consumption at high temperatures was also higher than feeding rates recommended for standard grower feeds by some European feed manufacturers (e.g. Provitrout, Ewos), while observed values at 14-18ºC are similar or less than feeding rates recommended by some authors (Stevenson, 1987; Brannon, 1991; Cho, 1992;). Alanärä (1992a,b) claimed that maximum feeding activity occurs at temperatures of 15-17ºC, and decreases after that. The findings of the present study seemed to indicate that feeding rates were sufficient for good growth over these temperatures as well.
Feed utilization by fish are influenced factors such as biological value of the feed, ratio between the nutrients, well being of the fish (Storebakken and Austreng, 1987). This may limit the practical value of comparing feed conversion estimates from different trials. However, the FCR values of the present study ranging between 0.9 and 1.3 seems to be within range of values (1.0-1.5) reported for rainbow trout fed a well balanced diets at around optimum temperatures (Storebakken and Austreng, 1987; Storebakken et al.,
1991; Alanärä, 1992a,b). These values are also comparable to those obtained in self-feeding studies (Alanärä, 1992a; Cho, 1992). Thus, the study showed that it is possible to achieve a FCR of around 1.0 with hand feeding during a full on-growing period under ambient temperatures ranging from 10.8 to 23.3°C.
Feed “B” was the cheapest of three and feeding cost (US$/kg weight gain) of the group received it was the lowest, while it was highest for the group given feed “C” which had medium final body weight. Thus, profits from the feeds provided maximum and minimum final weights were very close. This indicates that there seems to be room for manoeuvring for feed manufacturers to increase product diversity and trout producers to have more choices.
In conclusion, the results of the trial show that: i) feeds exhibited typical characteristics of the standard growers and in spite of some slight differences all the parameters investigated are within the acceptable limits; ii) daily feed consumption rates were as high as 4.0% of bw at high temperatures and differed markedly from the recommended feeding charts; iii) feed consumption, growth and feed conversion values were similar or better than those obtained at optimum temperatures, therefore, precise relationships between these variables and water temperature need further studies; iv) feed provided lowest final weight also provided the lowest feeding cost.
References
Alanärä, A. 1992a. Demand feeding as a self-regulating feeding system for rainbow trout (Oncorhynchus mykiss) in net-pens. Aquaculture, 108: 347-356. Alanärä, A. 1992b. The effect of time-restricted demand
feeding on feeding activity, growth and feed conversion in rainbow trout (Oncorhynchus mykiss) in net-pens. Aquaculture, 108: 357-368.
Austreng, E., Storebakken, T. and Asgard, T. 1987. Growth rate estimates for cultured Atlantic salmon and rainbow trout. Aquaculture, 60: 157-160.
Brannon, E.L.1991. Rainbow trout culture. R. Stickney (Ed.), Culture of Salmonid Fishes, CRC Press, USA,
Table 5. Estimated daily feed consumption rates (% live weight) of rainbow trout at different water temperatures. The manufacturer’s recommendations are given in brackets.
Fish size (g)*
15-60 60-110 110-180 180-260 >260
T (ºC) A B C A B C A B C A B C A B C
14
16
19
>20 3.8 (0-1)
4.4
-4.4
-2.5 (1.7)
2.3
-2.1
-1.8 (1.6)
1.8
-1.9
-1.3 (2.2)
1.3
-1.3
-1.1 (2.2)
1.3 1.3
. Okumu and M.D. Mazlum/ Turk. J. Fish. Aquat. Sci. 2: 101-107 (2002) 107
pp. 21-55.
Cho, C.Y. 1990. Fish nutrition, feeds and feeding: with special emphasis on salmonid aquaculture. Food Rev. Int., 6: 333-357.
Cho, C.Y. 1992. Feeding systems for rainbow trout and other salmonids with reference to current estimates of energy and protein requirements. Aquaculture, 100: 17-123.
Cho, C.Y. and Kaushik, S.J. 1990. Nutritional energetics in fish: Energy and utilization in rainbow trout. World Review of Nutrition and Dietetics, 61: 132-172. Cho, C.Y. and Cowey, C.B. 1991. Rainbow trout,
Oncorhynchus mykiss. R.P. Wilson (Ed.), Handbook of Nutrient Requirements of Finfish, CRC Press, 131-143.
Cowey, C.B. 1992. Nutrition: estimating requirements of rainbow trout. Aquaculture, 100: 177-189.
De Silva, S.S. and Anderson, T.A. 1995. Fish Nutrition in Aquaculture. Chapman & Hall, London, 319 p. Goddard, S. 1996. Feed Management in Intensive
Aquaculture, Chapman & Hall, New York, 194 p. Jobling, M., Arnesen, A.M., Baardvik, B.M., Christiansen,
J.S. and Jørgensen, E.H. 1995. Monitoring feeding behaviour and food intake: Methods and applications. Aquaculture Nutrition, 1: 131-143.
Johansen, S.J.S. and Jobling, M. 1998. The influence of feeding regime on growth and slaughter traits of cage-reared Atlantic salmon. Aquaculture International, 6: 1-17.
Johansson, L., Kiessling, A., Åsgård, T. and Berglund, L. 1995. Effects of ration level in rainbow trout,
Oncorhynchus mykiss (Walbaum), on sensory characteristics, lipid content and fatty acid composition. Aquaculture Nutrition, 1: 59-66.
Jørgensen, E.H., Baardvik, B.M., Eliassen, R. and Jobling, M. 1996. Food acquisition and growth of juvenile
Atlantic salmon (Salmo salar) in relation to spatial distribution of food. Aquaculture, 143: 277-289. Lovell, T. 1989. Nutrition and Feeding of Fish. Chapman &
Hall, New York, xi+260 pp.
National Research Council (NRC), 1993. Nutrient Requirements of Fish. National Academy Press, Washington, D.C., 114 pp.
Oliva-Teles, A. and. Rodrigues, A.M 1993. The effect of high temperature and diet protein level on metabolic utilization of diets by rainbow trout. S.J. Kaushik and P. Luquet (Ed.), Fish Nutrition in Practice, INRA, Paris: 301-305.
Solbé, J. 1988. Water quality. L.M. Laird and T. Needham (Ed.), Salmon and Trout Farming, Ellis Horwood, England: 69-86.
Steveson, J.P. 1987. Trout Farming Manual, 2nd edition, Fishing News Books, England, 259 pp.
Storebakken, T. and Austreng, E. 1987. Ration level for salmonids II. Growth, feed intake, protein digestibility, body composition and feed conversion weighing 0.5-1.0 kg. Aquaculture, 60: 207-221. Storebakken, T., Hung, S.S.O., Calvert, C.C. and
Plisetskaya, E.M. 1991. Nutrient partitioning in rainbow trout at different feeding rates. Aquaculture, 96: 191-203.
Sumpter, J.P. 1992. Control of growth of rainbow trout (Oncorhynchus mykiss). Aquaculture, 100: 299-320. Tacon, A.G.J. 1993. Aquaculture nutrition and feeding in
developing countries: A practical approach to research and development. S.J. Kaushik and P. Luquet (Ed.), Fish Nutrition in Practice, INRA, Paris: 731-741 Thomas, M. and van der Poel, A.F.B. 1996. Physical quality