© Central Fisheries Research Institute (CFRI) Trabzon, Turkey and Japan International Cooperation Agency (JICA)
Growth Performance, Nutrient Utilization of Nile Tilapia Oreochromis
niloticus Fed Housefly Maggot Meal (Magmeal) Diets
Introduction
Several feed ingredients have been investigated in an attempt to find substitutes for fish meal in the diets of tilapia. These include animal protein sources such as the fishery by-product, shrimp meal, and terrestrial animal by-products such as hydrolysed feather, bone meal and blood meal. Plant protein sources including soybean meal, cottonseed meal, groundnut meal, sunflower, rapeseed, sesame seed, copra, macadamia and palm kernel were also evaluated, along with aquatic plants such as Azolla
pinnata, duckweed (Lemnaceae) and single-cell
proteins (Ogunji, 2004; El-Sayed, 1999; El-Sayed and Tacon, 1997).
These feeds are not only considerably cheaper than fish meal but also enjoy high availability and accessibility in certain regions of the world. Unfortunately, attempts to use these ingredients to replace the fish meal component in farmed tilapia diets have met with variable success with some leading to reduced feed efficiency and growth. Some of the factors which may have contributed to the variation in the results obtained are summarised by Ogunji (2004) to include the protein composition and amino acid profile of alternative feeds; apparent digestibility of feeds; phosphorus content of alternative feeds; anti-nutritional factors in alternative feeds (especially in plant protein sources) and palatability/acceptability of alternative feeds.
Interests to study the use of housefly maggot meal (magmeal) as substitute for fish meal in fish diets have increased in recent times. Magmeal which
is of animal origin has been reported to posses a great potential (Adesulu and Mustapha, 2000; Fasakin et al., 2003; Ajani et al., 2004; Ogunji et al., 2006). Based on cost effectiveness, availability and crude protein content, the housefly larvae grown on animal waste seem to have an immense potential as a good protein source for fish. Magmeal is of high biological value. The percentage of crude protein ranges between 39-55%, lipid 12.5-21%, and crude fiber 5.8-8.2%. Magmeal is also rich in phosphorus, trace elements and B complex vitamins (Teotia and Miller, 1973). Examination of the comparative amino acid profiles of fish and fly larvae protein showed that no essential amino acid was limiting (Spinelli et al., 1979). According to Ogunji et al. (2007) the incorporation of magmeal into tilapia diets seems to have no oxidative stress generating effect on fish metabolism. It contains no compound that stimulates the generation of reactive oxygen species and can effectively be used as an alternative protein source in Nile tilapia fingerling production.
The effect of magmeal however, has not been fully investigated in fish production. This study therefore, attempts to evaluate the growth performance and nutrient utilization of Nile tilapia
Oreochromis niloticus fed magmeal diets when
fishmeal is partially substituted.
Materials and Methods
House fly maggots used for magmeal were produced in Nigeria from poultry droppings. The production was carried out according to the Abstract
A 56 day study was carried out to evaluate the growth performance and nutrient utilization of Nile Tilapia fed diets containing housefly maggot meal (magmeal). Three isoenergetic diets respectively containing 31.20, 34.0 and36.10% crude protein were formulated. Fishmeal was replaced partially with magmeal. Results of the study showed a good overall growth performances and status of experimental fish. Standard growth rate was between 2.58 – 3.08; food conversion ratio ranged from 1.12 to 1.45; Protein efficiency ratio was between 2.21–2.47, while hepatosomatic Index and condition factor were ranged between 3.08–3.14; and 2.47–2.89, respectively. Fish survival was 100%. These recommend the suitability of magmeal in diets for Nile tilapia fingerling. However, the apparent crude protein digestibility of diet 3 (65.71%) containing highest magmeal dietary inclusion level, decreased significantly compared to diet 1 and 2 (76.26%, 77.04%). This may be due to the effect of elevated ash concentration of magmeal used in the diet formulation.
Key words: alternative protein sources, magmeal, fishmeal substitute.
Johnny Ogunji1,*, Rahat-Ul-Ain Summan Toor2, Carsten Schulz3, Werner Kloas4 1
Ebonyi State University, Department of Animal Production and Fisheries Management, Nigeria. (Institute of Freshwater Ecology and Inland Fisheries Berlin, Germany).
2
Anatomy University of Agriculture, Dept. of Veterinary, Faisalabad 38040, Pakistan. 3
Institut für Tierzucht und Tierhaltung Christian-Albrechts-Universität zu Kiel, Germany. 4
Institute of Freshwater Ecology and Inland Fisheries Berlin, Germany. (Institute of Biology, Dept. of Endocrinology, Humboldt University Berlin, Germany.)
* Corresponding Author: Tel.: + 234.806 7558863 E-mail: ogunjijo@yahoo.com
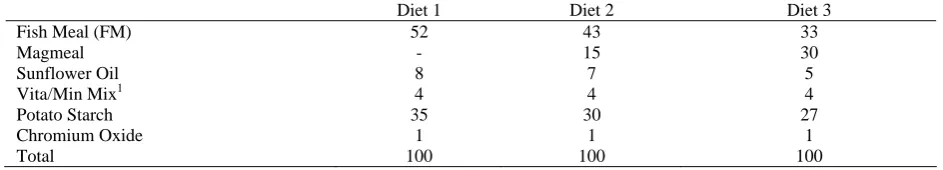
description of Ajani et al. (2004) and Adesulu and Mustapha (2000). Three isoenergetic diets were formulated with fishmeal being replaced partially with magmeal. Fishmeal was included in Diet 1(control) at the level 52% without any magmeal. The ratio of fishmeal and magmeal inclusion level for diet 2 and diet 3 are 43:15% and 33:30% respectively. Proximate composition of fishmeal and magmeal used for diet formulation is presented in Table 1. One percent chromium oxide was included in all diets for assessment of digestibility (Table 2). All dry diet components, including chromic oxide, vitamin and mineral mixture, were thoroughly mixed with sunflower oil. Water was added and the feed was pressed into pellets of 1 mm diameter. The feeds were stored at 5°C until used. The proximate and amino acid composition of the experimental diets are presented in Table 3.
Tilapia fingerlings were obtained from the Institute of Freshwater Ecology and Inland Fisheries Berlin. They were transferred to the Institute of Animal Science, Humboldt University Berlin, Germany, where the experiments took place. Twenty fingerlings (initial weight 2.85±0.03 g) were stocked in each of the 18 experimental tanks containing 240 litre of water. The experimental tanks are organised in two recirculation systems. Each recirculation system comprised of 9 tanks and a filtration unit with a sedimentation chamber for settlement of particulate matter and a trickling filter filled with plastic tubes for biological purification. Water temperature, pH, and dissolved oxygen were similar in both recirculation systems. Experimental diets were assigned to triplicate tanks spread uniformly among the two recirculation systems. The fish were manually fed 5% of their body weight in two portions per day at 9:00 and 15:00 for 56 days. The ration was completely consumed and has been established in previous experiments, not to limit fish growth (Ogunji and Wirth, 2000; Ogunji et al., 2007). A week to the end of experimental feeding, faeces was collected by siphoning from the tanks three hours after feeding. Fish tanks were however cleaned before siphoning. Faeces samples collected each day per tank were pooled together in containers and stored at -20°C until freeze dried and consequently analysed.
Freeze-dried samples of fish at the beginning and end of the experiments as well as samples of the test diets and faeces were analyzed for proximate composition. Every analysis was carried out in duplicate. Protein (N x 6.25) was determined by the Kjeltec System (Tecator Sweden ) and crude fat by Soxtec System HT (Tecator, Sweden) using petroleum ether. Ash was determined by burning in a muffle furnace at 550°C for 10 hours. Gross energy was calculated using the following factors: crude protein = 23.9 kJ/g, crude lipids = 39.8 kJ/g and NFE = 17.6 kJ/g (Schulz et al., 2005).
To estimate the amino acid concentrations of the experimental diets, 5 mg of the freeze-dried samples
were hydrolyzed with 6N HCl at 110°C for 24 hours. No protecting reagents were added to avoid destruction of sulphur amino acids. Methione was therefore not measured. Other analytical procedures followed the description of Ogunji and Wirth (2001). Chromic oxide in diets and faeces were analysed using the method described by Petry and Rapp (1970). However, a correction was made when preparing the standard solution for photometric measurement using potassium chromate (K2CrO4) at concentrations of 10
– 100 mg per litre CrIV. Beckman Beckman Coulter DU 800 Spectrophotometer (Beckman Coulter Inc., Palo Alto, CA, USA) was used to measure the extinctions of standard and samples.
From the experimental data obtained in replicate tanks, weight gain, specific growth rate (SGR) and food conversion ratio (FCR), Protein efficiency ratio (PER), Survival percent, Condition factor (Cf) and Hepatosomatic Index (HSI) were calculated as follows:
FCR = Food Fed/Live Weight Gain;
SGR = (ln W2 - ln W1/T2-T1) x 100.
Where; W2 = final weight of fish, W1 = initial
weight of fish, T1 = begin of experiment (day) and T2
= end of experiment (day).
Protein efficiency ratio (PER) = live weight gain (g)/protein fed (g)
Protein to energy ratio (P/E ratio) was calculated as mg protein/kJ gross energy.
Survival (%) = F2/F1× 100
Where: F1 = number of fish at the end of
experiment, F2 = number of fish at the beginning of
experiment. All calculations were based on each of the triplicate tank per treatment.
Hepatosomatic Index = liver weight [g]/ total fish weight (g)-1 × 100.
Condition factor (Cf ) = W2 / L2 3 × 100.
Where W2 = final fish weight and L2 = standard
length
The apparent digestibility coefficients (ADCs) of dry matter, crude protein, crude fat and energy were calculated as follows:
ADC (%) 100 – 100 × (% Cr2O3 feed / % Cr2O3
faeces) × (% nutrient faeces / % nutrient feed)
Table 1. Proximate composition of fish meal and magmeal used for diet formulation (% dry matter)
Components Fish Meal Maggot Meal
Dry matter 91.0 94.24
Crude protein 70.69 28.63
Crude fat 7.80 23.30
Ash 18.30 29.65
NFE1 3.21 18.42
Gross energy2 (kJ/g) 20.6 19.36
1
Nitrogen free extract + fibre, (NFE) = 100 - (% protein + % fat + % ash).
2 Calculated by: Crude protein = 23.9 kJ/g, Crude lipids = 39.8 kJ /g, NFE = 17.6 kJ/g (Schulz et al., 2005)
Table 2. Ingredient composition of experimental diets fed to Oreochromis niloticus (%)
Diet 1 Diet 2 Diet 3
Fish Meal (FM) 52 43 33
Magmeal - 15 30
Sunflower Oil 8 7 5
Vita/Min Mix1 4 4 4
Potato Starch 35 30 27
Chromium Oxide 1 1 1
Total 100 100 100
1Vitamin and Mineral mix (Spezialfutter Neuruppin - VM BM 55/13 Nr. 7318) supplied per 100 g of dry feed: Vitamin A 12000 I.E; Vitamin D3 1600 I.E; Vitamin E 160 mg; Vitamin K3 6.4mg; Vitamin B1 12 mg; Vitamin B2 16 mg; Vitamin B6 12 mg Vitamin B12 26.4 μg; Nicotinic acid 120 mg; Biotin 800 μg; Folic acid 4.8 mg; Pantothenic acid 40 mg, Inositol 240 mg; Vitamin C 160 mg; Antioxidants (BHT) 120 mg; Iron 100 mg; Zinc 24 mg; Manganese 16 mg; Cobalt 0.8 mg; Iodine 1.6 mg; Selenium 0.08 mg.
Duncan’s multiple range test (P<0.05) using SPSS for Windows (Version 12). Values are expressed as means ± SE.
Results
The proximate composition of magmeal used for diet formulation indicated a poorer quality than that reported in literature (Table 1). The effect of magmeal diets on growth performance and nutrient utilisation of Nile tilapia are shown in Table 4. During the experiment no mortality was recorded. Highest weight gain and SGR were observed in tilapia fed diet 1, followed by fish fed diet 2 and diet 3 which did not significantly differ. Feed conversation was the most efficient in fish fed diet 1 compared to diet 2 and diet 3. Although, fish fed diet 1 (containing 100 % fishmeal protein) showed the best growth performance, inclusion of maggot meal resulted in statistically comparable PER ranging between diet 1 and diet 3. The Cf of fish fed diet 2 was higher in comparison to fish fed diet 1 and 3 while HSI was on a comparable level between the experimental groups.
In general body composition of tilapia fed varying experimental diets resulted in higher crude protein and lipid compared with the initial status. Although crude ash content in the final body composition of the experimental fish increased with the increase in dietary magmeal utilisation crude protein amount remained equal between the
experimental groups. The crude lipid and moisture content was significantly influenced by the diets. Fish fed diet 2 and 3 showed lower moisture and higher crude lipid content in comparison with those fed with diet 1. Gross energy content of experimental groups were not affected by varying diets and ranged between (Table 5).
Apparent digestibility coefficients for dietary dry matter and crude lipids did not differ among the feeding groups. Crude protein digestibility of diet 3 was significantly decreased in contrast to diet 1 and 2. Gross energy digestibility was the highest in diet 1 and diet 2 in comparison to diet 3 (Table 6).
Discussion
Table 3. Proximate nutritional (% dry matter) and amino acid composition (g/100 g dietary protein) of experimental diets**
Diet 1 Diet 2 Diet 3
Proximate composition
Dry Matter 88.8 93.5 93.7
Crude protein 36.1 34.0 31.2
Crude lipid 13.3 15.1 16.3
Crude ash 13.5 16.6 18.1
NFE 1 37.1 34.3 34.4
Gross Energy (kJ/g) 2 20.5 20.2 20.0
P/E ratio3 17.6 16.8 15.6
Amino Acids
AspAcid 5.48 5.45 4.99
GlutAcid 9.19 9.00 7.93
Serine 2.08 2.09 1.91
Histidin* 2.02 2.42 2.37
Glycine 2.40 2.36 1.98
Threonine* 3.57 3.65 3.31
Arginine* 2.99 2.88 2.42
Taurine 0.51 0.87 0.18
Alanine 3.75 3.82 3.37
Tryptophan* 0.31 0.31 0.30
Valine* 4.43 4.76 4.34
Phenylalanine* 1.59 1.69 1.51
Isoleucine* 4.27 4.54 4.07
Leucine* 2.97 3.05 2.72
Lysine * 3.82 4.26 3.17
* Essential Amino Acids; Values for methionine were insignificant due to oxidation during hydrolysis and were not included. ** All values are means of duplicate determinations
1 Nitrogen free extract + fibre, (NFE) = 100 - (% protein + % fat + % ash).
2 Calculated by: Crude protein = 23.9 kJ/g, Crude lipids = 39.8 kJ/g, NFE = 17.6 kJ/g (Schulz et al., 2005); 3 P/E = Protein to energy ratio in mg protein kJ-1 gross energy.
Table 4. Growth performance of O. niloticus fingerlings fed experimental diets*
Diet 1 Diet 2 Diet 3
Initial wt. (g) 2.89±0.03a 2.85±0.0ab 2.82±0.01b Final wt. (g) 16.23±0.44a 13.51±0.57 b 11.96±0.38b Weight gain (g) 13.34±0.45a 10.66±0.58 b 9.14±0.38b
SGR1 3.08±0.06a 2.78±0.08b 2.58±0.05b
FCR2 1.12±0.05a 1.29±0.06b 1.45±0.04c
PER3 2.47±0.07 2.29±0.10 2.21±0.07
HSI4 3.08±0.10 3.14± 0.09 3.10± 0.04
Cf5 2.47± 0.05a 2.89± 0.08b 2.66± 0.09a
Survival (%) 100 100 100
* All values are mean of triplicate feeding groups and values in the same row with different superscripts are significantly different (p<0.05) 1Specific growth rate (%/d) = (InW
2 - InW1/ T2 -T1) × 100 2Food conversion ratio = food fed (g)/live weight gain (g); 3Protein efficiency ratio = live weight gain (g)/protein fed (g),
4 Hepatosomatic Index = liver weight (g) * total fish weight (g)-1 × 100, based on a sub-sample of n=15 per experimental group 5 Condition factor = W
2/ L23 × 100
Table 5. Initial and final composition of tilapia fingerlings fed experimental diets (%)*
Initial Status Diet 1 Diet 2 Diet 3 Moisture 72.93±3.0 72.58±2.3a 70.69±6.0b 71.37±1.1b Crude protein 13.96±2.6 15.29±1.6 15.58±3.3 14.90±0.8 Crude lipid 6.02±1.1 6.46±2.1a 7.57±3.0b 7.27±1.0b Crude ash 4.08±0.4 4.50±0.4a 4.59±1.0a 5.03±2.0 b
NFE 1 3.01±1.0 1.16±0.5 1.58±2.8 1.43±1.0
Gross Energy (kJ/g) 2 6.26±0.1 6.43±0.08a 7.01±0.15b 6.71±0.05ab
there is a need to standardize the production of magmeal so as to realize comparable nutrient compositions of the feed stuff.
The good overall growth performances and no mortality obtained in each experimental group of this study confirm the suitability of chosen nutritional composition for tilapia juvenile. FCR values below 1 have been reported, although generally it ranges between 1.2 and 1.5 for fish fed well prepared diets (De Silva and Anderson, 1995). Ogunji and Wirth (2000) used fish meal diets and reported that FCR 1.19; SGR 3.39 at the dietary protein content of 33.32% DM, indicated the most efficient utilisation of feed by Oreochromis niloticus fingerlings (average initial weight 4 – 5 g).
Nevertheless, weight gain, FCR and SGR decreased with higher dietary inclusion of in this study. This may be related to the dietary protein to energy ratio (P/E ratio) which decreased from 17.6 in diet 1 to 15.6 in diet 3. Protein is an essential nutrient that must be included in the diet at appropriate levels to ensure adequate growth and health of fish. Adequate energy must be supplied so that dietary protein is used for growth (protein synthesis) rather than metabolized for energy. It is therefore important to maintain a proper ratio of protein to energy in the diet. Excessive energy can cause reduced feed intake and will result in decreased growth rates. Significantly higher body lipid in fish fed diet 2 and 3 (Table 5) may support this speculation. Inadequate protein, as well results in decreased growth (SRAC, 1998). Ogunji and Wirth (2002) reported that decreased growth and body protein retention were observed in O. niloticus fingerlings fed diets containing extremely low crude protein content of 0.81% DM and P/E ratios of 0.42. The dietary P/E ratio recommended as optimal for growth of tilapia has been established between 16.26 mg kJ-1 and 19.43 mg kJ-1 (Mazid et al., 1979; De Silva et al., 1989; Ogunji and Wirth, 2000). The PE ratio for diet 3 in this study therefore seems suboptimal.
Cf and HSI in all the three feeding groups showed no significant difference with the exception of higher Cf calculated for fish fed diet 2. The condition factor is an index reflecting interactions between biotic and abiotic factors in the physiological condition of fish. It shows the fish welfare during the various stages of life cycle (Angelescu et al., 1956). As such, the condition of the experimental fish in this
study seemed comparable and adequate. The HSI of 3.08–3.14 found in this study did not differ between the dietary groups. In contrast, when Afuang et al. (2003) fed O. niloticus (initial weights of 15.5–17.0 g) on varying amounts and extracts of Moringa (Moringa oleifera) leaf meals to replace fish meal the relative liver weight was significantly influenced. They reported that the HSI ranging from 1.5 to 2.7 correlated with body lipid incorporation and was obviously influenced by dietary nutrient intake and availability. Similarly, the higher HSI values observed in the present study also seem to be a result of high body lipid and obviously liver lipid deposition. Significant highest body lipid and energy contents accompanied with higher HSI were found in fish fed diet 2 and 3 containing higher dietary lipid levels. Hence body composition is mainly influenced by the dietary lipid supply and availability as it has been demonstrated in other fish species such as sunshine bass (Nematipour, 1992), bagrid catfish (NG et al., 2001) or Eurasian perch (Xu et al., 2001; Mathis et al., 2003). Increasing dietary crude ash contents at higher maggot meal inclusion rates enhanced body ash incorporation in fish fed diet 2 and 3. It has been reported that dietary mineral composition influenced crude ash incorporation in body tissues of salmonids (Skonberg et al., 1997) and tilapia (Pouomogne et al., 1997).
The dietary apparent digestibility coefficients for dry matter, crude protein and gross energy did not significantly differ between fish groups fed diet 1 and 2. However, fish fed diet 3 showed a significant difference in crude protein, crude and gross energy. This may be due to the effect of elevated ash concentration of magmeal used in the diet formulation. An inverse relationship has been established between ash content and digestibility of dietary components (Gully, 1980; Hajen et al., 1993). A greater influence of this factor was evident among the fish group fed diet 3 formulated with the highest magmeal inclusion level. It has been reported that dietary ash content has a negative correlation with protein digestibility (Robiana et al., 1997). Köprücü and Özdemir (2005) reported lower ADCs of dry matter, protein, average amino acid, lipid and energy were observed in tilapia fed crayfish exoskeleton meal and gammarid meal than other test ingredients due to high content of ash and Chitin in the ingredients.
It has been suggested that maggot meal as a feed Table 6. Apparent digestibility coefficients (ADCs, %) of dry matter, crude protein, crude lipid and gross energy of Tilapia O. niloticus fingerlings fed varying test diets*
Diet 1 Diet 2 Diet 3
Dry Matter (%) 79.79±0.83 82.33±1.00 79.57±2.10
Crude Protein (%) 76.26±1.12a 77.04±1.12a 65.71±0.40b
Crude lipid (%) 95.07±0.80 94.85±0.19 94.96±1.24
Gross Energy (kJ/g) 1 56.13±0.81a 54.79±0.13a 51.10±1.80b
* All values are mean and standard deviation of triplicate feeding groups (n=3), groups and values in the same row with different superscripts are significantly different (p<0.05); ADC (%) 100 – 100 × (% Cr2O3 feed / % Cr2O3 faeces) × (% nutrient faeces / % nutrient feed);
ingredient may have low digestibility. Fasakin et al. (2003) attributed the reduction in growth performance of experimental fish fed full–fat maggot meal to low protein digestibility of the feed stuff among other reasons. On the contrary Adesulu and Mustapha (2000) claimed that the superiority of maggots over other protein sources in fish diet must be due to the tender, easily digested nature of maggots. Fish bones and their hard parts are milled together which decreases their availability. These assumptions however have not been verified.
Crude lipid digestibility did not differ in all feeding groups. This indicates that O. niloticus fingerlings effectively utilise the crude lipid supplied by magmeal and fishmeal in the diets. Hanley (1987) studied the co-efficient of digestibility for gross energy of several feed-stuffs used in Nile tilapia (Oreochromis niloticus). From his results it was apparent that the energy of the animal based feedstuffs was more available to Nile tilapiathan that in plant based feedstuffs.
Conclusion
Results of this study show an excellent overall growth performances and status of tilapia.. These recommend the suitability of magmeal in diets of tilapia O. niloticus fingerlings. However, the significantly decreased crude protein digestibility of diet 3 containing magmeal at 30% dietary inclusion rate in contrast to diet 1 and 2 raises a question that calls for more research.
It is important to determine the apparent digestibility coefficient of magmeal as an alternative fish feed ingredient. The effect of magmeal crude protein content on the digestibility of formulated diets ought to be verified. There is also a need to determine the best production and processing method of magmeal to ensure the availability of consistent quality of the product.
Acknowledgements
Dr Johnny O. Ogunji is grateful to the Alexander von Humboldt Foundation (AvH) Germany, for the award of a Post Doctoral Research Fellowship under which this work was performed. He thanks Mrs Victoria Ogunji for her support in the course of this study. The authors are grateful to Hanno Slawski for his invaluable assistance during the sample collection and analyses.
References
Adesulu, E.A. and Mustapha, A.K. 2000. Use of housefly maggots as a fishmeal replaces in tilapia culture: A recent vogue in Nigeria. In: K. Ftzimmons and J.C. Filho (Ed.). Proceedings of the Fifth International Symposium on Tilapia Aquaculture. 3–7 September, Rio de Janeiro: 138–143.
Ajayi, O.O. 1998. Evaluation of full fat/ defatted maggot meal in the nutrition of African catfish, Clarias
gariepinus. MSc. thesis. Akure Nigeria: Federal University of Technology.
Afuang, W., Siddhuraju, P. and Becker, K. 2003. Comparative nutritional evaluation of raw, methanol extracted residues and methanol extracts of moringa (Moringa oleifera Lam.) leaves on growth performance and feed utilization in Nile tilapia (Oreochromis niloticus L.). Aquaculture Research, 34(13): 1147-1159.
Ajani, E.K., Nwanna, L.C. and Musa, B.O. 2004. Replacement of fishmeal with maggot meal in the diets of Nile tilapia, Oreochromis niloticus. World Aquaculture, 35: 52–54.
Angelescu, V., Gneri, F.S. and Nani, A. 1958. La merluza del mar argentino (biologia e taxonomia). Secr. Mar. Serv. Hidrog. Nav. Publico, H1004: 1-224.
De Silva, S.S. and Anderson, T.A. 1995. Fish nutrition in aquaculture. Chapman and Hall, London, 31 pp. De Silva, S.S., Gunasekera, R.M. and Atapattu, D. 1989.
The dietary protein requirements of young tilapia and an evaluation of the least cost dietary protein levels. Aquaculture, 80: 271–284.
El-Sayed, A.F.M. 1999. Alternative dietary protein for farmed tilapia Oreochromis spp. Aquaculture, 179: 149–168.
El-Sayed, A.F.M. and Tacon, A.G.J. 1997. Fish meal replacers for tilapia: a review. Cahiers Options Mediterraneennes, 22: 205–224.
Fasakin, E.A., Balogun, A.M. and Ajayi, O.O. 2003. Evaluation of full-fat and defatted maggot meals in the feeding of Clariid catfish Clarias gariepinus
fingerlings. Aquaculture Research, 34: 733–738. Gado, M.S., El-Aggory, S.M., Elgawaad, A.A. and
Mahmoud, A.K. 1982. The possibility of applying insect protein in broiler rations. Natr. Abst, Rev., 53: Abst. 76.
Gully, D.D. 1980. Effect of mineral ash content on Atlantic menhaden meal (Brevoortia tyrannus) digestibility by rainbow trout (Salmo gairdneri). J. Colorado-Wyoming Acad. Sci., 12-17
Hajen, W.E., Higgs, D.A., Beames, R.M. and Dosanjh, B.S. 1993. Digestibility of various feed stuffs by post juvenile Chinook salmon (Oncorhnchus tshawytscha) in sea water. 1. Validation of technique. Aquaculture, 167: 259-272.
Köprücü, K. and Özdemir, Y. 2005. Apparent digestibility of selected feed ingredients for Nile tilapia (Oreochromis niloticus). Aquaculture, 250: 308–316. Lee, S.M. 2002. Apparent digestibility coefficients of
various feed ingredients for juvenile and grower rockfish (Sebastes schlegeli). Aquaculture, 207: 79– 95
Mathis N., Feidt, C. and Brun-Bellut, J. 2003. Influence of protein/energy ratio on carcass quality during the growing period of Eurasian perch (Perca fluviatilis). Aquaculture 214: 453-464.
Mazid, M.A., Tanaka, Y., Katayama, T., Rahman, M.A., Simpson, K.L. and Chichester, C.O. 1979. Growth response of Tilapia zilli fingerlings fed isocaloric diets with variable protein levels. Aquaculture, 18: 115-122.
Nematipour G.R., Brown M.L. and Gatlin, D..M. 1992. Effects of dietary carbohydrate: lipid ratio on growth and body composition of hybrid striped bass. J. World Aquacult. Soc., 3: 128–132.
nemurus (Cuvier & Valenciennes), determined using semipurified diets of varying protein level. Aquaculture Nutrition, 7: 45-51.
Ogunji, J.O. 2004. Alternative protein sources in diets for farmed tilapia. Animalscience.com Reviews 2004 No. 13; Nutrition Abstracts and Reviews, 74(8): 23– 32. Ogunji, J.O. and Wirth, M. 2002. Influence of dietary
protein deficiency on growth, amino acid, and fatty acid composition of Tilapia Oreochromis niloticus
fingerlings. The Israeli Journal of Aquaculture – Bamidgeh, 54(2): 57–65.
Ogunji, J.O. and Wirth, M. 2001. Alternative protein sources as substitutes for fish meal in the diet of young Tilapia Oreochromis niloticus (Linn.) Israeli Journal of Aquaculture – Bamidgeh53(1): 34–43. Ogunji, J.O. and Wirth, M. 2000. Effect of dietary protein
content on growth, food conversion and body composition of Oreochromis niloticus fingerlings, fed fish meal diet. J. Aqua. Trop. 15(4): 381–389. Ogunji, J.O., Nimptsch, J., Wiegand, C. and Schulz, C. 2007.
Evaluation of the influence of housefly maggot meal (magmeal) diets on catalase, glutathione S-transferase and glycogen concentration in the liver of
Oreochromis niloticus fingerling. Comparative Biochemistry and Physiology, 147: 942–947
Ogunji, J.O., Kloas, W., Wirth, M., Schulz, C. and Rennert, B. 2006. Housefly Maggot Meal (Magmeal): An Emerging Substitute of Fishmeal in Tilapia Diets. Conference on International Agricultural Research for Development; Deutscher Tropentag, October 11-13, Bonn Germany http://www.tropentag.de/2006/ abstracts/full/76.pdf.
Pereira-de Silva, E.M. and Pezzato, L.E. 1999. Alimentary ingredients and the feeding behaviour of Nile tilapia Oreochromis niloticus. Acta Scientiarum, 21: 297–301. Pereira-de Silva, E.M. and Pezzato, L.E. 2000. Response of
Nile tilapia (Oreochromis niloticus) to the attraction and palatability of used ingredients in the feeding of fishes. Brazilian J. of Animal Science, 29: 1273–1280. Petry, H. and Rapp, W. 1970. Zur Prolematik der
Chromoxidbestimmung in Verdauungsversuchen. Z. Tierphysiologie Tierernährung Futtermittelkunde, 27: 181–189.
Pouomogne, V., Takam, G. and Pouemegne, J.B. 1997. A preliminary evaluation of cacao husks in practical diets for juvenile Nile tilapia (Oreochromis niloticus).
Aquaculture, 156: 215–223.
Robiana, L., Moyano, F.J., Izquierdo, M.S., Socorro, J., Vergara, J.M. and Montero, D. 1997. Corn gluten and meat and bone meals as protein sources in diets for gilthead seabream (Sparus aurata): nutritional and histological implication. Aquaculture, 157, 347–359. Schulz, C., Knaus, U., Wirth, M. and Rennert, B. 2005.
Effects of varying dietary fatty acid profile on growth performance, fatty acid, body and tissue composition of juvenile pike perch (Sander lucioperca) Aquaculture Nutrition, 11: 1–11.
Skonberg, D.I., Yogev, L., Hardy, R.W. and Dong, F.M. 1997. Metabolic response to dietary phosphorus intake in rainbow trout (Oncorhynchus mykiss) . Aquaculture, 157:11-24.
SRAC. 1998. Improving feeds for hybrid striped bass. Southern Regional Aquaculture Center Kentucky State University (SRAC) Publication No. 304. www.aces.edu/dept/fisheries/aquaculture/pdf/304fs_0 00.pdf
Smith, R.R. 1979. Methods for determination of digestibility and metabolizable energy of feed stuffs for finfish. In: Proc. World Symp. on Finfish Nutrition and Fish feed Technology, 20–23 June, Berlin Heenemann GMBH. Hamburg: 453–459.
Spinelli, J., Mahnken, C. and Steinberg, M. 1979. Alternative sources of protein for fish meal in Salmonid diets. Proc. World Symp. on Finfish Nutrition and Fish feed Technology, 20–23 June. Berlin Heenemann GMBH. Hamburg: 132 – 143. Teotia, J.S. and Miller, B.F. 1973. Fly Pupae as a dietary
ingredients for starting chicks. Poultry Science, 53: 1830-1835.
Wang, K.W., Takeuchi, T. and Watanabe, T. 1985. Effect of dietary protein levels on growth of Tilapia niloticus. Bulletin of the Japanese Society of Scientific Fisheries, 51: 133–140.
Watanabe, T., Verakunpiriya, V., Watanabe, K., Kiron, V. and Shuichi, S. 1997. Feeding rainbow trout with non-fish meal diets. Fisheries Science, 63: 258–266. Xu, X.L., Fontaine, P., Melard, C. and Kestemont, P. 2001.
Effects of dietary fat levels on growth, feed efficiency and biochemical compositions of Eurasian perch