Copyright © 2015 IJECCE, All right reserved
Sensitivity Analysis of a Minutiae-Based Matching
Algorithm in Fingerprint Recognition Systems using
Matlab
Boi-Ukeme J. O.
Department of Electrical/Electronic Engineering, University of Benin, Benin City, Edo State, Nigeria
Email: [email protected]
Emagbetere, J. O.
Department of Electrical/Electronic Engineering, University of Benin, Benin City, Edo State, Nigeria
Email: [email protected]
Abstract – This paper analyses a fingerprint recognition algorithm built using a minutiae-based approach in order to establish the significance of the various building blocks of the algorithm. In order to achieve this, from a database of extracted fingerprint images as input to the system sensitivity analysis would be done on the building by varying individual blocks while keeping the other blocks constant and we can monitor the effect on the performance of the algorithm by applying a mathematical test of significance (t-test).
Keywords – Fingerprint Recognition Algorithm, Minutiae-Based Approach, Sensitivity Analysis, T-Test.
I.
I
NTRODUCTIONBiometric recognition refers to the use of distinctive physiological characteristics, called biometric identifiers for recognizing individuals[5]. Various methods of biometric recognition exists one of which is fingerprint recognition. Among all biometric traits, fingerprints have one of the highest levels of reliability and has been extensively used by forensic experts in criminal investigations. The two fundamental premises on which fingerprint recognition is based are: fingerprint details are permanent and fingerprints of an individual is unique. The uniqueness of fingerprints has been accepted over time because of lack of contradiction and relentless repetition. [5]
A fingerprint refers to the flow of ridge patterns in the tip of the finger. The ridge flow exhibits anomalies in local regions of the fingertip (Figure 1), and it is the position and orientation of these anomalies that are used to represent and match fingerprints.
Fig.1. A fingerprint Image [6]
Fingerprints are the most used biometrics in applications where a high level of security is required [4].The application of fingerprint recognition in such areas for example crime, election and other very vital aspects of society leaves no room for error. So many algorithms have been developed to tackle the problem of fingerprint recognition and this raises several questions- which algorithm should we adopt and how reliable are these algorithms? it is against this background a database containing extracted images of different fingerprints was created, sensitivity of the recognition system to variations in the different recognition processes was tested using a mathematical approach.
II.
B
ACKGROUNDS
TUDYFingerprints are the most used biometrics technique for personal identification[2].A lot of work has been done in the area of fingerprint recognition. The existing popular fingerprint matching techniques can be broadly classified into three categories depending on the types of features used:[8]
1. Minutiae-based 2. Correlation-based 3. Euclidean distance-based
In matching, features extracted from the input fingerprint are compared against those in a template, which represents a single user (retrieved from the system database based on the claimed identity). The result of such a procedure is a degree of similarity (also called matching score)or an acceptance/rejection decision [11].Mary Lourde and Dushyant Khosla carried out a study on the minutiae-based, correlation-based, and Euclidean distance-based matching techniques and it was concluded that the issue of selection of an optimal algorithm for fingerprint matching in order to design a system that matches the expectations in performance and accuracy is of great concern to designers [8]. This conclusion was as a result of the False accept rate(FAR) and False reject rates (FRR)that were recorded irrespective of the technique used.
parameter in matching block is the selection of tolerance distances and transformation method. When tolerance values are increasing, then false accept rate is also rising. When transformation of input minutiae set is not precise, then false reject rate value is high [3]. For the purpose this work, we study the matching block.
It is possible to optimize this minutiae-based model in order to reduce the FRR and the FAR such that we may not need to combine algorithms. The first step in a quest to optimize a model is a sensitivity analysis. This would aid in the determination of input parameters that have the greatest effect on the entire algorithm. Hence, in an attempt to minimize the FAR and FRR recorded in Minutiae-based matching technique, this paper analyses the minutiae-based method, applies the method of mathematical sensitivity analysis to determine which parameters are most important in the development of this algorithm and recommends that more care should be taken when designing such areas.
III.
S
ENSITIVITYA
NALYSISSensitivity analysis also can be used to provide insight into the robustness of model results when making decisions
Sensitivity analysis methods.
There are different methods used in analyzing the sensitivity of a system. They can be classified as:[1] 1. Mathematical
2. Statistical 3. Graphical
Mathematical approach
Mathematical methods assess sensitivity of a model output to the range of variation of an input. These methods do not address the variance in the output due to the variance in the inputs, but they can assess the impact of a range of variation in the input values on the output (Morgan and Henrion, 1990).
Statistical approach
Statistical methods involve running simulations in which inputs are assigned probability distributions and assessing the effect of variance in inputs on the output distribution. Depending upon the method, one or more inputs are varied at a time. Statistical methods allow one to identify the effect of interactions among multiple inputs.
Graphical approach
Graphical methods give representation of sensitivity in the form of graphs, charts, or surfaces. Generally, graphical methods are used to give visual indication of how an output is affected by variation in inputs. Graphical methods can be used as a screening method before further
4. Test of Significance
1. Building a database of fingerprint images
A database of ten (10) fingerprint images was created from already captured images this is to ensure that fingerprint images were of high quality and hence prevent error that could arise as a result of feature extraction. 2.Building the algorithm using matlab software
The algorithm is developed based on minutiae matching. Minutiae matching essentially consists of finding the best alignment between the template (set of minutiae in the database) and a subset of minutiae in the input fingerprint, through a geometric transformation. Similar algorithms have been used in literature [3,12] and the stages required are presented in Figure 2. These stages are embedded in the fingerprint recognition tool of MATLAB software.
Fig.2. Block Diagram of fingerprint recognition algorithm.
1.
Histogram equalization
Copyright © 2015 IJECCE, All right reserved that the pixel intensity is OFF and for 1 the intensity of the
pixel would be ON. This process enables the image to be easily enhanced and takes it a step further to being enhanced.
3.
Fingerprint ridge thinning
This process involves the reduction in width of ridges in the fingerprint image after it has been successfully binarized. The ridges are reduced till they are 1pixel wide, this is done by removing the excess surrounding pixels around the main pixel.
1.
H-break removal
This is the removal of h-shaped minutiae that are in form of the crossed minutiae from binarized thinned image. This is made possible because when the ridges are 1 pixel wide, it makes it very possible to identify the h-break in the fingerprint image. When the fingerprint image has not been thinned it would be impossible to remove the h-breaks for the fingerprint.
2.
Spurs removal
This is the removal of spurious minutiae from the thinned image after the h-breaks have been removed and then the minutiae are clearly visible. This process cannot occur without the fingerprint image being thinned
3.
Minutiae marking
After thinning the ridges in the fingerprint image and the h-break and spurs have been removed, the minutiae in the resulting image can now be marked. This points out the minutiae that are in the resulting fingerprint image thereby making the processes of fingerprint matching easy to be accomplished. This process cannot be done without the thinning process occurring.
4.
Minutiae matching
This is the process whereby the 2 fingerprint images that are compared are checked if they match or not. This is made possible with the aid of the minutiae marking whereby the minutiae that are marked and checked if they are the same for both images. When the fingerprint images are matching, we proceed to the next stage of the program but if they do not match, the next fingerprint image from the database is processed and compared again with the previous fingerprint image and the process is continued until the matching fingerprint image is attained.
After applying the rules above when a fingerprint image is compared with another fingerprint image it generates a matching score which ranges from 0-100. The closer these scores are to hundred the more similar the image is, hence for a match we get a matching score of 100.
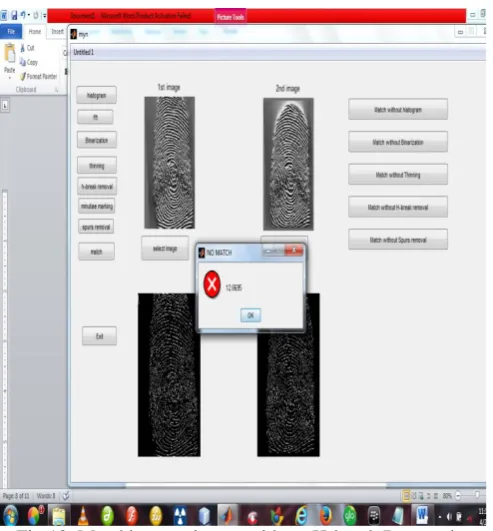
The environment of the algorithm designed in MATLAB is presented in Figure 3 to Figure 6
Fig.3. Selecting an image from the database
Fig.5: Selecting the second image from the database
Fig.6. Two images of different samples selected and ready
The steps followed in other to achieve sensitivity analysis using a mathematical approach include:
5. The complete algorithm is tested with one fingerprint (test sample) compared with a database of (ten) 10 fingerprint Images (database samples) and the various matching scores are noted. This forms the base case. 6. Case 1: Histogram equalization procedure is eliminated and the effect on the matching result of the 1 fingerprint compared with a database of ten(10) fingerprint images selected is noted for the level of mismatch.
7. Case 2: Binarization procedure is eliminated and the effect on the matching result of the 1 fingerprint compared with a database of ten(10) fingerprint images selected is noted for the level of mismatch.
8. Case 3: Ridge thinning process is eliminated and the effect on the matching result of the 1 fingerprint compared with a database of ten(10) fingerprint images selected is noted for the level of mismatch. The next process to be removed would be the removal of h-breaks. 9. Case 4: The next step would be to consider the elimination of image spurs removal and its effect on the matching result of the 1 fingerprint compared with a database of ten(10) fingerprint images selected.
In each of the cases above the value of interest is the matching score. A minutiae-based fingerprint matching system usually returns the number of matched minutiae on both query and reference fingerprints and uses it to generate similarity scores. According to forensic guidelines, when two fingerprints have a minimum of 12 matched minutiae, they are considered to have come from the same finger [13].
In order to achieve the steps as outlined above, the technique used in the MATLAB software is the inclusion of different match buttons with each processes removed from the buttons as shown . The first button for example, processes the input images using all the enhancement processes except histogram equalization, so when clicked the input images are enhanced and compared for match
4. Test of Significance (t-Test)
The t Test is one of the most commonly used techniques for testing a hypothesis on the basis of a difference between sample mean values. Explained in layman's terms, the t test determines a probability that two populations are the same with respect to the variable tested..
Copyright © 2015 IJECCE, All right reserved 𝑆𝐸(𝑋 − 𝑌 ) = 𝑆𝑥
2
𝑛𝑥+ 𝑆𝑦2
𝑛𝑦 ... Equation 3[10]
Where,
𝑋 = Mean of the first set of data 𝑌 = Mean of the Second set of data 𝑛𝑥 = Sample size of first set of data 𝑛𝑦 = Sample size of first set of data
The value of the t-statistic is then compared with the value obtained from the table under the degree of freedom (df) calculated using Equation 4.
df = nx + ny - 2... Equation 4 [10]
If the value of t-statistic is greater than the value of t that is obtained from the t-table using the degree of freedom then we reject the null hypothesis and conclude that the data are significantly different otherwise we conclude that there is no significant difference in the data compared. In terms of fingerprint recognition, this implies that we reject the null hypothesis when the process removed has a significant effect on the matching score while we accept the null hypothesis when the process removed has no significant effect on the matching score.
V.
R
ESULTSHaving carried out the sensitivity analysis as discussed above, the effect on the matching score of our algorithm is as shown in Figure 6 - Figure 10. The results are presented for two images compared and then the effect on the other images are presented in a Table 1 and graphs on Figure 11
1.
Comparing the images with the exclusion on
histogram equalization can be seen below. note: the
message box indicates the percentage of match
between the two images.
Fig.7. Matching one image without histogram equalization
2. Matching without Binarization
Fig.8. Matching one image without Binarization
3. Matching without Ridge Thinning
4. Matching without H-break Removal
Fig.10. Matching one image without H-break Removal
5. Matching without Spurs Removal
Fig.12. Radar chart showing the matching scores for various cases of sensitivity
Copyright © 2015 IJECCE, All right reserved t value obtained from t-table [9] at a 99.9% confidence
level is;t = 3.686
VI.
D
ISCUSSION OFR
ESULTSThere are five stages in processing the fingerprint images for recognition, when the images compared are processed through all the stages the results in column 1 of table 1 were obtained, this is the base case.Subsequently, isolating one stage at a time and testing the performance of the model on the test samples, the results in column 1-6 of table 1 were obtained.
A test sample was matched with a database of ten (10) fingerprint images and the results under the matching scores column on table 1 were obtained. From these results, a percentage score closer to 100% means that the fingerprint images compared are a match (they are most likely obtained from the same fingerprint), while that closer to zero (0%) means that the fingerprint images compared mismatch (they are most likely obtained from different fingerprint images).
The effect of each process removed can be observed by a comparison of the matching scores obtained in that case with the matching scores obtained in the base case, this comparison can be done in two ways.
1. By plotting the values on a radar chart as shown in figure 12, by visual inspection of this chart, it is observed that case of removal of ridge thinning has the greatest effect on the matching scores obtainedwhen compared with the base case, this is because the data obtained from the case of ridge thinning removed is clearly different when compared with the base case and other cases, while other processes removed seemed to have little or no effect on the matching scores obtained compared with the base case, but this is not enough for us to conclude that there is a significant difference or similarity when comparison is made with the base case.
2. In order for us to confidently reject or accept a null hypothesis, a test of significance must be carried out to see how the base data deviates from the other data obtained from other cases.Hence, the t-statistic values are obtained and presented in the last column of Table 1. The t-statistic value is compared with that obtained from the t-table. The t-statistic is greater than that obtained from the t-table in cases 2 and 3 while for cases 1, 4 and 5 the value is less. Hence, in cases 2 and 3 we say that we reject the null hypothesis and conclude that the data obtained in cases 2 and 3 are significantly different from that obtained in the base case. In order words absence of ridge thinning and binarization would have a significant effect on the matching of fingerprint images
VII.
C
ONCLUSIONIn this work, a mathematical approach for sensitivity analysis in which we assessed the impact of a range of variation in the input values on the output model of a Minutiae-based fingerprint recognition algorithm as presented shows that Ridge thining and binarization are the most significant processes responsible for false
matching that occur in the use of such a system for fingerprint recognition.
R
EFERENCES[1] H. Christopher Frey, Sumeet R. Patil, Identification And Review
Of Sensitivity Analysis Methods, Civil Engineering Department, North Carolina State University, . (pp12,13,14,15)
[2] BEBIS G., DEACONU T., GEORGIOPOULOS M., Fingerprint
Identification Using Delaunay Triangulation, Proc. of Int. Conf.
onInformation Intelligence and Systems, pp. 452-459,
Washington, DC, USA, 1999.
[3] Łukasz WIĘCŁAW, A Minutiae-Based Matching Algorithms In
Fingerprint Recognition Systems, Journal Of Medical
Informatics & Technologies Vol. 13/2009, ISSN 1642-6037
[4] Philippe Parra, Fingerprint Minutiae Extraction And Matching
For Identification Procedure, Department of Computer Science and Engineering, University of California, San DiegoLa Jolla, CA 92093-0443
[5] Maltoni, D.,Maio, D., Jain, A., Prabhakar, S, Handbook Of
Fingerprint Recognition, Springer, New York (2003)
[6] Steven L. Eddins “Digital Image processing using MATLAB”
[7] Jain LC, Intelligent Biometric Techniques In Fingerprint And
Face Recognition, CRC Press, 1999
[8] Mary Lourde R and Dushyant Khosla, Fingerprint Identification
In Biometric Security Systems, International Journal of Computer and Electrical Engineering, Vol. 2, No. 5, October, 20101793-8163
[9] T-test table
http://www.sjsu.edu/faculty/gerstman/StatPrimer/t-table.pdf 30/04/2014
[10] Maureen Hillenmeyer, APPLIED STATISTICS, Stanford
UniversityJune 2005 (pp 29,30)
[11] Fernando A.F, Bigun J, Fierrez J, Hartwig F, Klaus K,
Ortega-Garcia J, Fingerprint Recognition
[12] JAING X., YAU W., Fingerprint minutiae matching based on
the local and global structures.ICPR2000,Vol. 2, pp. 1042-1045,2000.
[13] MEHTRE B. M., Fingerprint image analysis for automatic
identification, Machine Vision and Applications 6, 2, pp. 124– 139, India, 1993.
A
UTHORSP
ROFILEBoi-Ukeme Joseph
is a Lecturer at the Department of Electrical and Electronic Engineering, University of Benin, Benin City, Nigeria, He has Bachelor of Engineering and Masters of Engineering degrees in the Area of Electronic and Telecommunication Engineering.