New Approaches to SEM Statistical Analysis of
Purchase Intention
Gui Ren
1, Yann-Haur Huang
1, Hiroshi Honda
2*and Yu-Chen Lo
31School of Business and Information Technology, Northwestern Polytechnic University, California, USA 2Department of Computer System Engineering, Northwestern Polytechnic University, California, USA
3Department of Bioengineering, Stanford University, California, USA
Date of publication (dd/mm/yyyy): 26/09/2017
Abstract – This paper was intended to determine what factors affect consumers’ purchase intention in the e-business environment and verify how organizations’ internal and external dynamic may underlie the success of e-commerce companies. Based on literature review, a set of quantitative surveys, a conceptual model and a number of hypotheses were proposed. Then, the factor analysis and structural equation modeling (SEM) were adopted for statistical and empirical analyses.
Although the technology-acceptance model is widely accepted in research of e-commerce topics, the present study went beyond technology and targeted other factors that might have dramatic influence on online shoppers’ purchasing intention as well. Finally, positive correlations among the identified factors indicating the great influence of innovative performance in different areas of management strategies on e-purchase intention, have demonstrated the great impact from the awareness of sustainability development in e-commerce companies.
Keywords –E-Commerce, Statistical Analyses, E-Purchase Intention, Structural Equation Modeling, SEM Statistical Method.
I.
INTRODUCTION
E-business describes businesses run on the Internet, or utilizes Internet technologies to improve the productivity or profitability of a business [1]. This usage, however, is somewhat archaic, and in most contexts this term refers exclusively to Internet businesses [2]. By selling products and services online, such a business is able to reach a much wider consumer base than any traditional store could ever hope for. This function is referred to as e-commerce, and the terms are occasionally used interchangeably [3]. An online business may also use the Internet to acquire whole sale products or supplies for in-house production. This facet is sometimes referred to as e-procurement, and may offer businesses the opportunity to cut their costs dramatically [4]. Even many e-businesses which operate without an electronic storefront now use e-procurement as a way to better track and manage their purchases [5].
The present study elaborates on the key factors for e-businesses success by comparing the financial reports of e-business groups. Individuals or businesses involved in e-commerce, whether buyers or sellers, rely on Internet-based technologies to accomplish their transactions [6]. E-commerce is recognized for its ability to allow businesses to communicate and to form transactions anytime and anywhere. The power of e-commerce has caused geophysical barriers to disappear, making all consumers and businesses on earth potential customers
and suppliers [7]. EBay is a good example of e-commerce by which individuals and businesses are able to post and sell their items around the globe.
In the last decade, the explosion in the use of electronic commerce by the business sector has seen tremendous and dramatic changes in consumer’s purchase behavior resulting from the influence of the e-business environment. An E-business has been defined as the application of information and communication technologies in support of all the activities of business [8]. Electronic commerce involves the use of computer technologies to enable the external activities and relationships of a business with individuals, groups and other businesses [9].
This research focuses on determining the factors that affect consumers’ purchase intention in the e-commerce environment and the influence of the organizational internal and external factors on the success of e-commerce companies. Although the technology acceptance model is widely accepted in research on e-business, the present study mainly targeted the effects perspectives beyond technologies, such as innovativeness in segmentation and positioning as well as sustainable innovation in management strategies, which also have dramatic effects on online shoppers’ purchasing intention [10]. The terms of e-business and e-commerce are quite common now a days and are sometimes used interchangeably. But the two terms are different in ways that matter to companies. Here, the letter e stands for "electronic networks" and describes the application of electronic network technologies e.g., Internet and electronic data interchange (EDI) to improve and change business processes [11].
II. BACKGROUND
business-model construct as a unit of analysis for future research on value creation in e-business [14]. A business model depicts the design of transactional content, structure, and governance so as to create value through the exploitation of business [15]. Some papers propose that a firm's business model is an important locus of innovation opportunities and a crucial source of value creation for itself and its suppliers, partners, and customers. However, such models have delineated different effects [16].
A business model is defined as the organization of products, services and information flows, serving as a source of revenues and benefits for suppliers and customers [17]. The concept of an e-business model is the same as that of traditional businesses but used in the online context.
In order to understand the customers and their buying behavior, a process of segmenting and positioning is needed [18]. This process consists of the three main activities: segmenting, targeting and positioning. In the present study, the author mainly focuses on two of them: segmenting and positioning. While some researchers have focused on either marketing strategies or innovation adoptions, very little research has been conducted on the correlations between those two factors and their influence on consumers’ purchasing behavior.
Hassan [19] describes segmenting as the process of dividing the market into segments based on customers’ characteristics and needs. The main segmenting activity consists of four parts: determining who the actual and potential customers are, identifying segments, analyzing the intensity of competitors in the market, and selecting the attractive customer segments [19]. It is well known that a company is almost never alone in a market-- competitors have a great influence on a business’s motivation to enter a certain market. The need for segmenting a market often arises from the fact that no markets are homogeneous. For a given product, the market can be divided into different customer groups [19].
The variables involved in this kind of segmenting are usually geographical, behavioral and demographic in nature. When these segments are known, it is important to determine which market to target. Not every market is an attractive market to enter. A little filtering is usually done in this activity, but there are more factors to take into account before targeting a certain market segment. This process is called targeting. After the most attractive segments are selected, a company should not directly start targeting all of them -- other important factors come into play in defining a target market. Four sub-activities form the basis for deciding on which segments will actually be targeted [19]. One other critical factor is novel performance in corporation management, which in the present study is defined as four aspects: financial, marketing, technological and sustainable.
For the present study, there are different models were selected for an analysis of factors detected.
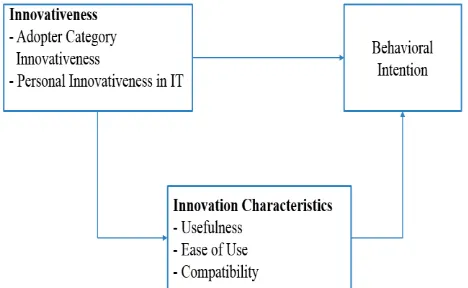
In an attempt to understand the role of individual innovativeness in the acceptance of IT-based innovations, Fiedler [6] illustrated the relationship among
innovativeness, innovation characteristics and behavioral intention (Figure 1).
As shown in the Figure 1, under innovativeness there are two independent variables: adopter category innovativeness and personal innovativeness in. Another group of independent variables (usefulness, ease of use, compatibility) are found in the group of innovation characteristics. Both groups have relationship to the depend variable of behavioral intention.
Fig. 1. Alternative Theories of Innovativeness.
In the paper of e-commerce adoptions, Park [20] described the relationship among external variables, perceived usefulness, perceived ease of use, attitudes toward using and behavioral intention. There are interrelationships among the independent variables: external variables, perceived usefulness, perceived ease of use to perceived usefulness, perceived usefulness to attitude toward using, perceived ease of use, attitudes toward using, and behavioral intention.
In the topic of purchase intentions and the dimensions of innovation, Holak [21] depicted the complex relationships among communicability, complexity, divisibility, relative advantages, compatibility, perceived risks and purchase intention. In a model of new product evaluation, there are some relationship between complexity and communicability, complexity and divisibility, communicability and relative advantage, complexity and compatibility, compatibility and relative advantage, compatibility and perceived risk, relative advantage and purchase intention, compatibility and purchase intention, perceived risk and purchase intention.
III. METHODOLOGY
crucial to choose appropriate research methods and conduct them effectively in order to answer the research questions and to meet the research objectives [22].
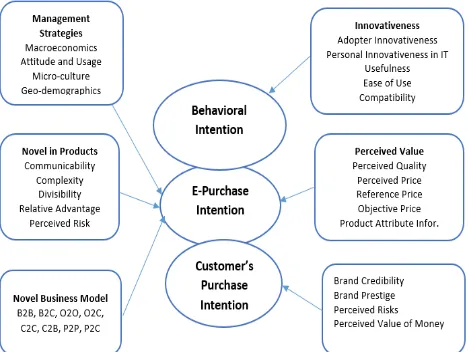
As previously mentioned, in addition to the detected associations between the independent and dependent variable groups, there were relationships among the variables in the existing models and those generated from the qualitative interviews, such as the novel business. This assumption is reflected in a new conceptual model (Figure 2).
Fig. 2. Conceptual Model of E-Purchase Intention.
Based on the literature review and qualitative research, the overall conceptual model of thepresent study yielded a series of hypotheses pertaining to the relationship between novel performances and four main areas of corporation management: financial, marketing, technologies and sustainable development, and purchase intention. Following are these Hypotheses.
H1: The identified factors of innovativeness (adopted innovativeness, personal innovativeness in IT, usefulness, ease of use, compatibility), management strategies (macroeconomics, attitude and usage, micro-culture, geo-demographics), novel in products (communicability, complexity, divisibility, relative advantages, perceived risks ), novel business model (B2B, B2C, O2O, O2C, C2C, C2B, P2P, P2C), reference value (brand credibility, brand prestige, perceived risks, perceived value of money) will contribute to e-purchase intention.
H2: There are relationships among adopted innovativeness, personal innovativeness in IT, usefulness, ease of use, compatibility and sustainability.
H3: There are relationships among communicability, complexity, divisibility, relative advantage, perceived risks and sustainability.
H4: There are relationships among management strategies, such as macroeconomics, attitude and usage, micro-culture, geo-demography and sustainability.
H5: There are relationships aspects of innovativeness, such as adopted innovativeness, personal innovativeness in IT, usefulness, ease of use, compatibility and management strategies.
H6: There are relationships between novel performance, such as communicability, complexity, divisibility, relative advantage, perceived risks and perceived value of quality, price, etc.
H7: There are relationships among perceived value of quality, price and management strategies.
H8: There are relationships among reference values, such as brand credibility, prestige and loyalty to management strategies.
H9: There are relationships between perceived value of quality, price and reference value of brand credibility, prestige, and loyalty.
H10: There are relationships among perceived value, quality, price, validity, perceived language, perceived life cycle, and e-purchase intention.
H11: There are relationships between management strategies and e-purchase intention.
H12: There are relationships between reference values (i.e., brand credibility, prestige, and value of money) and e-purchase intention.
The SEM provides a test of the hypotheses more stringent than multiple regression analysis or path analysis as it enables the researcher to take account of complete information in a theoretical model and to search for appropriate models by the criteria provided by the goodness of fit in AMOS. The items for each dimension are averaged to create single indicators for each latent variable, considering the large number of parameters being estimated. Studies have shown that a corrected single-indicator model produces parameter estimates that are virtually identical to those produced by a pure latent-variable analysis [23].
These values (factor loadings) generally measure the correlations between the factors and the observed variables, and rotations are routinely performed to aid in interpreting the factors by maximizing the number of loadings with high and low absolute values. In SEM, the modeler decides in advance which of the parameters defining the factors are restricted to being zero constant. Also, in SEM one can specify non-zero covariance among the unexplained portions of both the observed and latent variables [24]. Specification of each parameter allows the modeler to conduct a rigorous series of hypothesis testing regarding the factor structure. Since there can be a large number of possible combinations in a measurement model with more than just a few variables, exploratory factor analysis is sometimes used to guide construction of an SEM measurement model [24].
involve intervening variables [25]. The total effects of the exogenous variables on the endogenous variables are sometimes knows as the coefficients of the reduced form equations.
A formal questionnaire was developed from the results of the pilot study. SPSS 22 and Amos 19 statistical software were adopted for data analyses. The conceptual model was revised, with 47 variables from interviews and literature reviews being retained for further inquiries. The conceptual model was revised, with 47 variables from interviews and literature reviews being retained for further inquiries.
As shown in the Table 1, the Cronbach’s alpha, at .920, indicates the significance and reliability of the dataset.
Table 1. Reliability Statistics. Cronbach's
alpha Cronbach's alpha based on standardized items N of items
.920 .927 17
Results of the Factor Analysis:
Factor analysis is a technique used to identify factors that explain common variances among variables. This statistical method is often used to reduce data by grouping variables that measure a common construct. Principal-components analysis is one of the most commonly used methods of extraction since this method will evaluate all sources of variability for each variable [24]. Since the value of CFI is .972 > .80 (Table 2), the model fit is acceptable.
Table 2. Model Summary.
Model Delta 1 NFI rho 1 RFI Delta 2 IFI rho 2 TLI CFI Default .944 .926 .972 .963 .972
Saturated 1.000 1.000 1.000
Independence .000 .000 .000 .000 .000
Since principal-components analyses are typically exploratory, the researcher must determine the appropriate number of components to retain. Four criteria are used in this decision making process:
Eigenvalue:
Components with eigenvalues greater than 1 should be retained. This criteria is fairly reliable when the number of variables is < 30, when communalities are > .70, when the number of individuals is > 250, or when the mean communality is > = .60;
Variance:
The researcher should retain components that account for at least 70% of the total variability.
Screen Plot:
The researcher should retain all components within the sharp descent, before eigenvalues level off. This criterion is fairly reliable when the number of individuals is > 250 and communalities are > .30.
Residuals:
The researcher should retain the components generated by the model if only a few residuals exceed .05. If several
reproduced correlations differ, it may be necessary to include more components.
The appropriate number of components to retain has to be determined first and foremost. After that, the researcher must then interpret/name the components by evaluating the type of variables included in each factor, the strength of factor loadings, and the direction of factor loadings.
Testing Hypothesis 2, for example, would involve the following:
Independent Variables (IVs): Sustainability:
Sustainable development, technological innovation, awareness.
Dependent Variables (DVs):
Adopted innovativeness, personal innovativeness in IT, usefulness, ease of use, compatibility.
Method: SEM Path Analysis:
In the beginning, missing data would be assessed for each variable. Multivariate outliers would be examined using Mahalanobis distances within regression for each group. Then, to test the factorial analysis, the data were to be screened to ensure that the assumptions of factorial were fulfilled. To eliminate outliers, subjects with income values of less than or equal to 3 or greater than or equal to 22 were to be removed.
Because groups were being compared, assumptions of normality, linearity and homoscedasticity had to be examined for all groups of quantitative variables. Prior to multivariate examination, univariate examination should have taken place for each variable within each group. Although these variables had been assessed for assumptions in the previous example, examination was to be conducted with ungrouped data. Consequently, assessment of normality and homoscedasticity would need to be conducted for each variable within each group. The exploring procedure was used would provide the histograms, test of normality, descriptive statistics and normal Q-Q plots, all of which indicated that the four quantitative variables were fairly normal. Homoscedasticity (homogeneity of variance) were assessed with Leven’s test within the t-test of independent samples. These results indicated equality of variance for each variable between groups.
Since groups in factorial path are created by two or more factors or independent variables, it is important to determine if factors are interacting (working together) to affect the dependent variable. Typically, a line plot is created to graphically display any factor interaction. If lines overlap and crisscross, factor interaction is present. Although a line plot may reveal some factor interaction, the path results may show that the interaction is not statistically significant.
inferences about the factors’ main effects. Effect size should also be analyzed to determine the strength of such effects [7].
In the summary, the first step in interpreting the factorial path results is to determine if an interaction is present among factors by looking at the F ratio and its level of significance for the interaction. From the foregoing tables and figures, it is clear that there is no significance, so the hypothesis had to be rejected.
H3: There exist relationships between novel performance (e.g., communicability, complexity, divisibility, relative advantages, and perceived risks) and sustainability.
IVs: Sustainability (e.g., sustainable development, technology innovation, awareness).
DVs: Novel performance (e.g., communicability, complexity, divisibility, relative advantages, perceived risks and sustainability).
Statistic Methods: SEM Path Analysis
The readers should note that the example of a results summary will not include these descriptive statistics due to space limitations. The overall regression results are summarized with the identified variables in the model: R², R² adj, F and p values, with degrees of freedom. If a step approach has been utilized, one may need to report each step (R², R² adj, R² change, and level of significance for change) within a table.
A summary of the regression model is presented in the table of model fit. In addition, bivariate and partial correlation coefficients between each predictor and the dependent variable are presented in the same table. Finally, one may need to report the B weight, beta weight, bivariate correlation coefficients and partial correlation coefficients of the predictors with the DC in a table. Alternatively, the researcher may report the prediction equation, either standardized or unstandardized [26].
IV. RESULTS
The result of our research presents survey responses and exhibits an exploratory factor analysis (EFA), conducted to verify the construct validly of the measuring scales, along with structural equation modeling (SEM). These statistical methods were used to analyze the survey data and to test the hypotheses. SEM was used to verify both the overall model and the detailed ones on, respectively, attitudes, perceived risks, and perceived ease of use, perceived value, relative advantages, loyal brand strategies, innovation, sustainability, and efficiency in technologies.
As mentioned previously, SEM provides a more stringent test of hypotheses than multiple regression analysis or path analysis because it enables the researcher to take account of complete information in a theoretical model and to search for appropriate models with the criteria provided by the goodness of fit in AMOS [24].
An exploratory factor analysis was conducted to seek out the dimensionality of the latent variables. The purpose of this analysis was to test the construct validity [27] of the eight factors (viz. attitudes, perceived risks, perceived ease of use, perceived value, relative advantages, loyal brand
strategy, innovation, sustainability, efficiency in tech and e-purchase intention) and to reveal the underlying structure among them. Empirical validation of the measurement of behavioral intention was performed with an exploratory factor analysis and a reliability test.
Following the EFA test, structural-equation model (SEM) was used to test the hypotheses. This is a technique for testing and estimating causal relationships among the endogenous, or dependent variables, and the exogenous, or independent, variables.
Three approaches have been made to test hypotheses within a conceptual model. First, with a strictly confirmatory analysis, a researcher may test a model by using structural-equation and goodness-of-fit tests to determine if the variance-covariance structure in the data is consistent with what is specified in a conceptual model. Second, the alternative-models approach entails comparing two or more causal models to determine which has a better fit. Third, the model-development approach is a combination of confirmatory and exploratory approaches. When a model is found to be deficient, the researcher may resort to an alternative model that is based on changes suggested by a combination of a substantive theory and SEM’s modification indexes.
In addition, SEM has two advantages over a regression analysis. First, it can estimate the actual measurement errors through a confirmatory factor analysis (CFA). Second, it accommodates in a one-path model multi-item scales as latent and multiple variables [25]. According to Arbuckle [28], goodness-of-fit tests can help researchers determine if the model being tested should be accepted or rejected. These overall-fit tests cannot be used to prove that particular paths within the model are significant. If the model is accepted, the researcher will then go on to interpret the path coefficients in it.
The model 1 of sustainability and innovation presents the testing of the causal relationship between sustainability and innovation. Hypothesis two, in conjunction with the factors involved and the statistical methods used, is described in the following.
H2: There is a positive relationship between sustainability and innovation.
Observed Variables
Sus 1 (Sustainability), Sus 2 (Awareness), Sus 3 (Development), Sus 4 (Consistency), Sus 5 (Business model), Sus 6 (Other models), Ino 1 (Adopter), Ino 2 (Personal innovativeness), Ino 3 (Ease of use), Ino 4 (Compatibility).
Latent Variables: Sustainability and Innovation
Statistical Methods: SEM
On the following pages, a number of sub-topics (viz. offending estimates, construct reliability and average variance extracted, and goodness of fit) will be discussed.
Offending Estimates:
Table 3. Model-1 Variances.
Estimate S.E. C.R. p
e2 .512 .052 8.002 ***
e3 .479 .060 8.047 ***
e4 .384 .042 9.068 ***
e5 .448 .051 8.761 ***
e6 .410 .046 8.880 ***
e7 .577 .064 9.027 ***
e8 .263 .075 3.506 ***
Note: Estimate = Unstandardized coefficients; SE = Standard errors; C.R. = Critical ratio; p = Significance: * p
< .05, **p < .01, ***p < .001
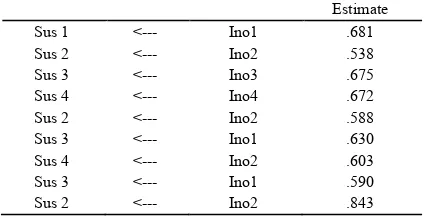
Also, as shown in Table 4, the standardized regression weight ranges from .538 to .843, with all of these weights being below 1.0. Thus, it is clear that the offending estimates did not occur in Model 1. Hence, the results on offending estimates are acceptable for Model 1.
Construct Reliability and Average Variance
Extracted:
According to Claes [29],a model is acceptable when its construct reliability is greater than .7, and the average variance.
Table 4. Model-1 Standardized Regression Weights.
Estimate
Sus 1 <--- Ino1 .681
Sus 2 <--- Ino2 .538
Sus 3 <--- Ino3 .675
Sus 4 <--- Ino4 .672
Sus 2 <--- Ino2 .588
Sus 3 <--- Ino1 .630
Sus 4 <--- Ino2 .603
Sus 3 <--- Ino1 .590
Sus 2 <--- Ino2 .843
Note: Estimate = Standardized coefficients
Extracted (AVE) needs to be greater than .5 to be acceptable. In the present study, the construct reliability for innovation was calculated at the suggested low limit of .70, with this formula:
ρc1 is the innovation factor. Let λ1 be the standardized loadings (or the standardized coefficients) for the innovation factor. Let θ1 be the error variance for the innovation factor. Based on the data in Table 5, the construct reliability of this innovation factor is:
The average variance extracted from sustainability in Model 1 was calculated at the suggested low limit of .50, with this formula:
Ρν2 is the average variance extracted from sustainability in Model 1. Based on the data in Table 5, the average variance extracted from sustainability in Model 1 is.691.
Table 5. Model-1 Factor Loadings, Construct Reliability and Ave.
Factor
loadings Squared multiple correlations Average variance extracted
Infor 1 .662 .417
Infor 2 .579 .456
Infor 3 .672 .452
Infor 4 .524 .345
.4924
Sus 1 .650 .710
Sus 2 .720 .348
Sus 3 .457 .364
Sus 4 .530 .397
.5169
In the summary, the construct reliability was considered satisfactory as both .7937 and .8070 were much higher than the suggested values (.70, respectively). The average variance extracted in Model 1 (.5169) was considered acceptable as it was higher than the suggested values (.50). The value of .4924 was also acceptable as it is close to the suggested values of .50.
The inner quality of Model 1 was, then, acceptable and fit for further analyses (Table 6).
Table 6. Model-1 Regression Weights.
Estimate
Sus 1 <--- Infor 1 .681
Sus 2 <--- Infor 2 .538
Sus 3 <--- Infor 3 .675
Sus 4 <--- Infor 4 .672
Sus 2 <--- Infor 2 .588
Sus 3 <--- Infor 1 .630
Sus 4 <--- Infor 2 .603
Sus 3 <--- Infor 1 .590
Sus 2 <--- Infor 2 .843
Note: Estimate = Unstandardized coefficients; SE = Standard errors; C.R. = Critical ratio; p = Significance: * p < .05, **p < .01, ***p < .001.
The Table 6 presents a positive and significant (p < .001) relationship between sustainability and innovation. In addition, the four observed variables (sustainability, awareness, development, consistency) had significant and positive effects on innovation. Further, all four observed variables (sustainability, awareness, development, consistency) were positively related to firm’s innovation. As shown earlier, the four variables (sustainability, awareness, development, Consistency) positively affected firm’s innovation, so Hypothesis 2 was supported. These results show that sustainability was positively related to firms’ innovation.
Thus, Sus 4 (development) is the most influential variable on innovation.
The standard regression weights are .52 for H1, .69 for H2, .36 for H3, .42 for H4, .70 for H6, .38 for H5, .42 for H7, .44 for H11, and .58 for H12, so 8 hyposes are accepted out of 12.
Results from the factor analysis and SEM revealed the interrelationships among innovation, sustainability, sustainable innovations, management strategies and technological efficiency on e-purchase intention in the overall model. The indices of fitness show that the proposed model was supported by data.
V. CONCLUSION
The objective of the present study was to investigate the identified how factors of innovativeness (adopted innovativeness, personal innovativeness in IT, usefulness, ease of use, compatibility), management strategies (macroeconomics, attitude and usage, micro-culture, geo-demographics), novel in products (communicability, complexity, divisibility, relative advantages, perceived risks), novel business model, reference value (brand credibility, brand prestige, perceived risks, perceived value of money) will contribute to e-purchase intention. Path analyses were conducted to show the impact of different factors.
A number of questionnaires were collected and subject to analyses. The survey instrument was a self-administered questionnaire, which sought information about the use of mobile banking as well as the demographic data. Data bearing on the research questions were analyzed with EFA and SEM. Results of these statistical analyses were presented.
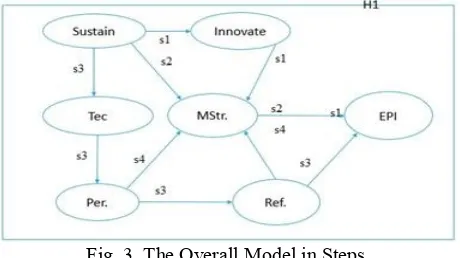
The results from factor analyses and structural equation modeling revealed important implications for bankers. A number of action steps will be offered according to the path analysis, these steps may answer the research questions as well. Figure 3 represents these steps in a sequence.
This overall model and the four steps it features, as shown in Figure 3, will answer Research Question on what factors may contribute to purchase intention for an e-commerce company for the present study.
Fig. 3. The Overall Model in Steps.
In the present study, a conceptual model was successfully applied in an empirical investigation of e-purchase intension. The paths in the proposed model
clearly revealed the due processes for e-purchase intension. The present study bears important implications to the research community. It identified main factors that contribute to e-purchase intention and provided an empirical rationale for managers to seriously consider these factors.
This study was informed by the literature of purchase intention quite well. It also yielded empirical support to a conceptual model that connects several factors and brought them to bear on behavioral intention. Moreover, the interrelationships among the identified factors of innovativeness (adopted innovativeness, personal innovativeness in IT, usefulness, ease of use, compatibility), management strategies (macroeconomics, attitude and usage, micro-culture, geo-demographics), novel in products (communicability, complexity, divisibility, relative advantages, perceived risks), novel business model, reference value (brand credibility, brand prestige, perceived risks, perceived value of money) were further explored in the present study.
Second, the present study provides managers with meaningful information. Its results underlie a framework that encompasses the interrelationships among those important variables and help managers determine which factors to focus on in efforts to enhance online shoppers’ purchase intention. It will also bring to the attention of managers the interrelationships among the relevant factors that may be conducive to marketing strategies targeting clients’ satisfaction.
The present study has a number of shortcomings. First, the sample was online-based, with all of the respondents taken from China and U.S. These individuals might have dispositions and behavioral patterns that differed from those in other geographic areas of the two countries.
In the present study, only cross-sectional data were collected. In reality, however, embedded applications may differ from the mobile websites. Access through different mobile devices might have affected users’ answers to the survey questions.
Due to the discrepancies in respondents’ knowledge and levels of comprehension, the responses to the questionnaire items might not have been reliable. Moreover, the present study’s sample mainly consisted of people in the 20-35 age group, which might not have been representative of any targeted marketplace. Finally, the process of data screening in the present study might not have been reliable because some elements had been excluded from data analyses.
In the future, researchers should examine the extent to which the present study’s results may be generalized to other areas or other countries. Longitudinal studies should be conducted to gain information on how users’ adopting behavior may change over time. Researchers should also differentiate among specific versions of mobile banking. Finally, they should further analyze how demographical differences may be utilized to generate business insight.
be made to have their differences and similarities teased out. Online shopper’s demographical differences and their impact should also be considered, and more variables in this area should be considered in future studies.
REFERENCES
[1] Fillis, I.S., Sandy, W., & Park, J. (2004). Factors impacting on
e-business adoption and development in the smaller firm.
International Journal of Entrepreneurial Behaviour and Research, 10, 178-191.
[2] Fung, R., & Lee, M. (1999). EC-trust: Exploring the antecedent
factors. America’s Conference on Information Systems, 179, 56.
[3] Burgess, S., Sellitto, C., & Karanasios, S. (2009). Effective web
presence solutions for small businesses: Strategies and
successful implementation, IGI Global Economy, 9, 210-212.
[4] Goodhue, D.L., & Thompson, R.L. (1995). Task-technology fit
and individual performance. MIS Quarterly, 19(2), 213-236.
[5] Anderson, E., & Weitz, B. (1989). Determinants of continuity in
conventional industrial channel dyads. Marketing Science, 8,
310-314.
[6] Fiedler, J. L., & Park, T.W. (2006). Understanding the role of
individual innovativeness in the acceptance of IT-based innovations: Comparative analyses of models and measures.
Decision Sciences,37(3), 393-426.
[7] Kim, D., & Benbasat, I. (2003). Trust-related arguments in
Internet stores: A framework for evaluation. Journal of
Electronic Commerce Research, 4(2), 49-64.
[8] Amit, R., & Zott, C. (2001), Value creation in E-business,
Strategy Management Journal, 22, 493–520.
[9] Amor, D. (1999). The e-business (r) evolution. Upper Saddle
River, OH, Prentice Hall.
[10] Adams, D.A., Nelson, R.R., & Todd, P.A. (1992). Perceived
usefulness, ease of use, and usage of information technology: A replication. MIS Quarterly, 16(2), 227-247.
[11] Brandt, Richard L. (2011). One Click: Jeff Bezos and the Rise of
Amazon.com. New York: Portfolio Penguin. ISBN 978-1-59184-375-7.
[12] Shukla, P. (2014). The impact of organizational efforts on
consumer concerns in an online context. Information and
Management, 51, 113-119.
[13] Fredriksson, T. (2013). Workshop on e-commerce, development
and SMEs: Conference on Trade and Development, E-Marketer,
7, 24.
[14] Chin, W.C., & Todd, P.A. (1995). On the use, usefulness and
ease of use of structural equation modeling in MIS research: A
note of caution. MIS Quarterly, 19(2), 237-246.
[15] Anckar, B., & D’lncau, D. (2002). Value creation in mobile
commerce: Findings from a consumer survey. Journal of
Information Technology Theory and Application, 4, 43-64.
[16] Bharati, P., & Chaudhury, A. (2004). An empirical investigation
of decision-making satisfaction in web-based decision support
systems. Decision Support System, 37, 187-197.
[17] Timers, P. (2000). Electronic commerce: Strategies and models
for business-to-business trading, pp. 31. New York: John Wiley and Sons.
[18] Sedera, D., & Dey, S. (2013). User expertise in contemporary
information systems: Conceptualization, measurement and
application. Information and Management, 50, 621-637
[19] Hassan and Stephen (2005). Linking global market segmentation
decisions with strategic positioning options. The Journal of
Consumer Marketing, 22(2/3), 81-89.
[20] Park, J., Lee, D., & Ahn, J. (2004). Risk-focused e-commerce
adoption model: A cross country study. Journal of Global
Information Technology Management, 7(2), 6-30.
[21] Holak, S.L., & Lehmann, D.R. (2005). Purchase intentions and
the dimensions of innovation: An exploratory model. Journal of
Product Innovation Management, 7(1), 59-73.
[22] Cohen, J., Cohen, P., West, S. G., & Aiken, L. S. (2003). Applied
multiple regression /correlation analysis for the behavioral sciences (3rd ed.). Mahwah, NJ: Lawrence Earlbaum Associates.
[23] Feather man, M.S., & Pavlou, P.A. (2003). Predicting e-services
adoption: A perceived risk facets perspective. International
[24] Byrne, B.N. (2001). Structural equation modeling with AMOS:
Basic concepts, applications and programming. Mahwah, NJ: Lawrence Erlbaum Associates.
[25] Ho, R. (2006). Structural equation modeling: Handbook of
univariate and multivariate data analysis and interpretation with
SPSS. Boca Ration, FL: Chapman and Hall/CR
[26] Oppenheim, A. (1994). Questionnaire design, interviewing and
attitude measurement. Journal of Community and Applied Social
Psychology, 5(4), 371-372.
[27] Wu, C.S., Cheng, F.F., Yen, D.C., & Huang, Y.W. (2011). User
acceptance of wireless technology in organizations: A
comparison of alternative models. Computer Standards and
Interfaces, 33(1), 50-58.
[28] Arbuckle, J.L., & Wothke, W. (1995). AMOS 4.0 user's guide.
Chicago: Small Waters Corporation.
[29] Claes, F., & Larcker, D.F. (1981). Evaluation structural equation
models with unobservable variables and measurement errors.
Journal of Marketing Research,18(1), 39-50.
AUTHOR’S PROFILE
Dr. Ren, Gui, as one of higher education educator,