Biolinguistics 10: 060–077, 2016 ISSN 1450–3417 http://www.biolinguistics.eu
A Functional Role for Neural Columns:
Resolving F2 Transition Variability
in Stop Place Categorization
Harvey M. Sussman
Documented examples from neuroethology have revealed species-specific neural encoding mechanisms capable of mapping highly variable, but lawful, visual and auditory inputs within neural columns. By virtue of the entire column being the functional unit of both representation and processing, signal variation is collectively ‘absorbed’, and hence normalized, to help form natural categories possessing an underlying physically-based commonality. Stimulus-specific ‘tolerance ranges’ define the limits of signal variation, effectively shaping the functionality of the columnar-based processing. A conceptualization for an analogous human model utilizing this evolutionarily conserved neural encoding strategy for signal variability absorption is described for the non-invariance issue in stop place perception.
Keywords: columnar-absorption of variability; normalization; phonetic varia-bility; stop place perception; tolerance limits
1. Introduction
The brain is a five-star generalizer. It simplifies and organizes, reducing a deluge of sensory information to a manageable sum. From that small sample, the brain produces an effigy of the world, whose features it monitors […]. But individuals and events are never identical, only similar in vital ways. The brain doesn’t have room to record the everythingness of everything, nor would that be a smart
strategy. (Ackerman, 2004: 54)
data from neuroethology is to shift the level of scrutiny to the ‘how’ of speech pro-cessing, rather than the more commonly revealed ‘where’. Brain imaging methodolo-gies are more suited to revealing the locational organization of neural processing loci and interacting networks, rather than the operational principles underlying neural processing. The purpose of this paper is to provide a viable neural conceptualization of how the human brain might represent and process the fine-grained auditory detail of F2 transitions characterizing consonant + vowel utterances. The neural construct that emerges from animal studies investigating the resolution of signal varia-bility/ambiquity in auditory and visual inputs is neural columns. This ubiquitous, vertically organized, laminated structure, comprising the entire cerebral cortex, as well as subcortical nuclei, is postulated to be the neural encoding structure capable of bringing about signal normalization. Two examples of columnar-based normal-ization, across two different sensory input signals, both characterized by lawfully generated variability, will be described. Following this, a well documented acoustic-phonetic metric, locus equations (Sussman et al., 1991), will be described. Locus equations empirically demonstrate a categorical-level orderliness in stop place acoustic representation that demystifies the neural encoding of stop place categories. Neural columns may very well map and process the array of F2 transitions lawfully reflecting the dynamically changing resonance properties of the human vocal tract during production of stop + vowel utterances.
2. Two Opposing Approaches to Processing Speech Signal Variation
Phonetic variability in speech is ubiquitous, as direct causation stems from widely divergent sources—(i) speakers (e.g., age, gender, size), (ii) speaking styles (e.g., hypo-to-hyper-articulation), and, most importantly for this paper, (iii) phonetic con-text (e.g., coarticulated stop + vowel sequences). Two contrastive views will first be described as they illustrate important theoretical differences, particularly in how they view the need for signal normalization. The traditional ‘abstractionist’ view is highly dependent upon signal normalization as a basic prerequisite for phoneme categorization; the exemplar view claims normalization is unnecessary, as the brain’s memory substrates for speech basically encode the “everythingness of everything”.
2.1. The Traditional Abstractionist View
example, the alveolar stop category /d/, across the seven vowel contexts, revealed seven different F2 transitions, in both direction and extent of the transition. No invariant acoustic cue could be identified despite the perceptual invariance of the stops. The necessity for some form of signal normalization, however, was recognized (Shankweiler et al., 1977). By more or less default, they went in the direction of abandoning the auditory signal in favor of coding speech in terms of (supposedly) invariant motor commands. Whether it be phonemic-sized acoustic-based neural entities or the motor gestures to produce them, the important point is “the idea that the information in the speech signal must be encoded relative to something” (McMurray et al., 2016: 53).
2.2. Exemplar Theory
The symbolic abstractionist view has been directly challenged by exemplar theory, characterized by a non-analytic, instance-based view of cognition (Jacoby & Brooks, 1984). In exemplar-based accounts stimulus variation is informative, and hence instances are believed to be stored in memory. In the words of Pisoni (1992: 1): The variable attributes of speech are retained as “part of the internal representation of speech in memory”. A succinct summary might claim ‘exemplarists’ stress ‘particu-lars’ and ‘traditionalists’ stress ‘abstractions’.
Exemplar-based accounts of variation can be found across many sub-disciplines of linguistics: phonetics, phonology, morphology, semantics, syntax, and language acquisition (Pierrehumbert, 2001, 2003; Hawkins, 2003; Gahl & Yu, 2006). My focus will be limited to phonetic-based investigations. This view is perhaps best captured by a quote from Pisoni (1995): “This view of speech perception focuses on the encoding of specific instances and assumes that very detailed stimulus infor-mation in the speech signal is processed by the listener and becomes part of the me-mory representation for spoken language” (p. 5). A few representative studies that historically shaped this view are described below.
Mullennix et al. (1989) investigated the intelligibility of isolated spoken words with the independent variable being a single talker or 15 different talkers (male and female). Identification performance was better for words produced by a single talker. The voice source variability across trials when the words were spoken by a multitude of speakers affected recognition performance. Goldinger (1992) reported evidence of implicit memory for speaker-specific attributes of a talker’s voice. Identification performance for spoken words was superior when the words were repeated using the same voice, as in the original list presentation, relative to being repeated by a different talker. Mullennix & Pisoni (1990) showed that attributes of a talker’s voice could be perceived independently from the phonetic content of the word, and vice versa.
performance would not be expected in memory tasks like the ones used in these experiments” (p. 15). The surface logic seems to make sense, but only if one accepts the premise that a brief, one time exposure to words can result in permanent representations stored in auditory brain tissue.
Interestingly, the only source of signal variability that both initiated and shaped exemplar theory was based on speaker differences—e.g., varying talkers and speaking rates. In contrast, the sole variability source underlying the traditional abstractionist position, as represented by the Haskins group, was phonetic context, specifically the conundrum of perceptual invariance of stops despite the acoustic variability of vowel contexts shaping the F2 transitions (e.g., Liberman et al., 1954; Liberman et al., 1967; Liberman & Mattingly, 1985). This difference between the sources of phonetic variability is rarely, if ever, discussed. The important and essen-tial difference between the two types of variation is the following: The fine-grained phonetic detail in speaker-based differences consists of signal elements that actually sound different—i.e., an F0 of 120 Hz is easily distinguishable from an F0 of 185 Hz. In contrast, the various F2 transitions comprising a given stop place category all sound the same. Thus, acoustic variability in coarticulatory, context-induced scenarios is phonologically non-distinctive. The variability is lawful and systematic, but it does not create perceptual changes within the allophones of each stop place category. It makes sense then, that exemplarists never investigate context-based coarticulatory effects because their subjects would simply hear the same stop.
While the findings of exemplar-based studies are indeed intriguing, they do not constitute, by themselves, a body of experimental evidence to suggest a theory of how neural substrates encode speech tokens. In fact, they defy neurophysiological explanation. Lavie (2007) described the existing descriptions of exemplar theory as “an impoverished explanatory apparatus” (p. 1). All too often proponents of exem-plar models couch their views of speech perception and resultant brain representa-tions in vague and fuzzy terminology, such as ‘clouds’ of exemplars (Pierrehumbert, 2001). Actual brain-based reality, however, is totally missing from both the abstrac-tionist and exemplar views.
A relevant study comparing the effectiveness of normalization operations in speech category identification was conducted by McMurray & Jongman (2011). A speech corpus (N = 2,873 recordings) obtained from 20 speakers, producing eight English fricatives, across six vowel contexts, provided the data base. It was deter-mined that 24 simple cues were available to distinguish place, voicing or sibilance. Three different input models based on different sets of informational assumptions were compared in a fricative categorization task:
(1) naïve invariance: a small number of cues that had a robust correlation with fricative identity and no compensation for talker/vowel contexts;
(2) cue-integration: used every available cue, without compensation (this condition is most similar to exemplar approaches);
A subset of these stimuli were presented to human listeners for fricative cate-gorization. A classification model based on logistic regression was trained on the remaining stimuli contrasting the three input cue sets. The normalization/compen-sation model performed the best, with an accuracy level similar to human listeners (90%). The naïve invariance condition resulted in 74.8% correct perception, and the cue-integration model yielded 79.2% correct category identification. Compensation processes to account for coarticulatory effects in production are thus highly effective in signal categorization. Stop + vowel productions have long been considered the ‘litmus test for invariance seekers’, and hence the most demanding set of acoustic signals in need of normalization.
3. Neural MechanismsResolving Ambiguity due to Variation in the Input Signal
In the following sections, I will describe a neural representation/processing mecha-nism, documented across two different species and sensory systems, that function to absorb/normalize input signal variation. The two examples are (i) sound localization processing in the barn owl, and (ii) visual object recognition in the macaque. The existence of basically similar neural algorithms, shaped by sensory inputs over time, across two different organisms (mammalian and avian) and sensory modalities, illustrates the conserved nature of this normalization platform in evolutionary devel-opment. The structural and functional neural unit accomplishing this feat is the neural column. Mountcastle (1978) was the first to claim that the cerebral cortex is remarkably uniform in structure across all processing areas (sound, vision, motor, higher order). This uniformity is due to vertically arranged neurons distributed with-in the six-layers of each and every column compriswith-ing the 2–3 mm of the cerebral cortex. Moreover, columns are also present in subcortical processing areas such as the midbrain inferior colliculus (Wagner et al., 1987).
Before describing how the barn owl and macaque deal with signal input variability, a brief account of tolerance limits in sensory processing will be provided. Tolerance limits pertain to a neural ‘filtering’ principle that permits specific ranges or ‘windows’ of signal variations to be processed by neural columns.
A classic early example of tolerance limits was discovered by Maturana & Frenk (1963) recording from single ganglion cells in the retina of pigeons. Groups of such cells were specifically sensitive to visual stimuli consisting of horizontally-oriented edges. Different clusters of such cells exhibited varying tolerances in the input signal to elicit their firing. For example, the range of tolerance for one class of neurons was 25 degrees of inclination from a 0 degree horizontal edge. Said in an-other way, any edge stimulus varying within a 0-to-25 degree range of variation was ‘good enough’ to initiate a strong firing pattern from a given cell. Another group of ganglion cells operated within a 20, 15, or 10 degree range of tolerance from the abso-lute horizontal.
Characteristically, what is shown in one sensory modality is also found in other modalities. Nelson et al. (1966) recorded from single neurons in the cat’s in-ferior colliculus in response to complex, time-varying signals (FM sound sweeps). These ‘meow’ detectors revealed highly specific responses to (i) upward sweeps in frequency vs. downward sweeps, (ii) from a particular starting frequency-to-ending frequency, for each direction of change, and (iii) for given rates of change (Hz/sec) within the various starting-to-ending directional frequency ranges. The same classifi-cation scheme was also documented for amplitude modulated input signals. The entire range of coding specifications across frequency and amplitude dimensions revealed in a cat’s ‘meow’ detector neuronal population could adequately describe the human speech signal, which basically consists of frequency changes over time.
4. Columnar Organization in Sound Localization Processing in the Barn Owl
Owls hunt for food at night, using sound cues arriving from various directions and distances. The two acoustic parameters necessary for azimuth localization (left/ right) are frequencies and their relative phase differences arriving at right and left ears. The frequencies emanate from the sounds of their prey, and the phase infor-mation emerges from the differences in time of arrival of the sounds at the two ears. The ear closer to the origin sounds responds sooner. However, there are inherent ambiguities in frequency and phase values that need to be overcome before the owl can strike and secure dinner. Here is a simple example: picture an oval running track with two runners at a given moment in time. One runner is in front of the other, apparently leading in the race. If you ask a child, “Who’s winning the race?”, the child would most likely respond “The guy in front”. If it were the child of a physics professor, he/she might reply: “It’s totally ambiguous as we do not know how many times each runner has run around the whole track, all we see is the phase difference between the two runners”. Thus, phase information, without corresponding frequ-ency information, is non-informative and ambiguous.
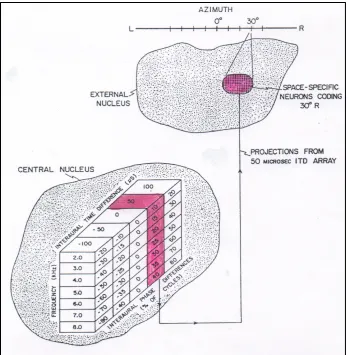
Wagner et al. (1987), recording from the central n. of the barn owl’s inferior colliculus during actual sound localization maneuvers, has clarified how this coding ambiguity gets resolved. Neurons making up tonotopically organized ‘delay lines’ located in a lower brain stem nucleus of the barn owl (nucleus laminaris) initially encode interaural phase differences in sounds arriving at the two ears. The most activated cell in each of the tonotopic delay lines codes the temporal disparity in time of arrival of the two sounds—lead ear relative to lagging ear. These temporal dis-parities then project to the central n. in the midbrain of the barn owl, the site where Wagner et al. recorded from individual combination-sensitive neurons whose job is to encode all the various simultaneous frequency/phase pairings in the complex input signal.
ITD of 50 !sec. With radioactive tracers it was determined that this particular column, as a collective, sent its output to the shaded area of the higher external n., where there was an invariant coding of 30 degrees azimuthal location of the input sound.. That directional location equates to a lead arrival time of 50!sec to the right ear. The key point is that regardless of the different frequency/phase pairings encoded within the column, they all contain a temporal commonality—the same ITD—of 50 µsec! The column serves as a ‘buffer’, absorbing signal variation, to arrive at an invariant instance of time of arrival, which signals spatial location to the owl. The columns tolerate wide differences in lawful phase variations across the frequency spectrum of the complex input sounds.
Figure 1: Columnar organization to derive ITDs in barn owl’s inferior colliculus
ex-ample, from the macaque, will illustrate the existence of similar cortical columns that gradually develop with experience, but contain the same basic format and function as seen in ITD columns of the barn owl.
5. Columnar Organization for Signal Variability in Visual Object Recognition in the Macaque
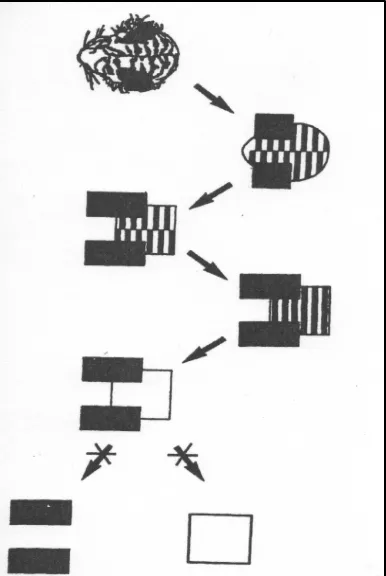
Tanaka (1993) investigated object recognition in the inferotemporal cortex of the macaque. Visual images undergo lawful changes due to different illuminations, viewing angles, and articulation of the object. Tanaka’s set of critical visual features to test a neuron’s firing sensitivities were created by a systematic reduction method. Starting with images of natural objects (e.g., the head of a tiger), they first zeroed in on single neurons in a given cortical column that maximally fired to the complete stimulus. Then they systematically reduced and simplified the image, step by step, with each step being tested as to whether the neuron still responded to the altered image with the same magnitude of response as seen in the original complete image. Each step was a gradual reduction of the complexity of the image. When a given neuron ceased responding to a particular reduced image, the reduction process stopped and a basic critical feature was arrived at. A set of 12 critical features were thus derived and used to probe the columnar organization in anterior IT cortex. Figure 2 shows the step-by-step reduction process for the ‘tiger image’ from Tanaka (1993). The ‘tiger’ neurons responded equally to all stimulus reductions except the bottom two symbols (dark rectangles and white square).
When vertical electrode penetrations were made within a given TE column, they first determined the critical feature from the mid region of that column. Further single neuron recordings within the vertical penetration revealed responsiveness to related or highly similar images to the optimal stimulus. The object feature was not represented by a single cell, but rather by the activity of all cells within a given column. The effective stimuli, composed of subtle variations of a given image, overlapped and provided a robust collective columnar response. Whilst the input signal con-tained subtle variations due to changes in illumination, viewing angle, and articu-lation of the object, the global organization of the column structuring the output showed little change despite the internal variation. As stated by Tanaka (1993): “The clustering of cells with overlapping and slightly different selectivity works as a buffer to absorb the changes” (p. 686).
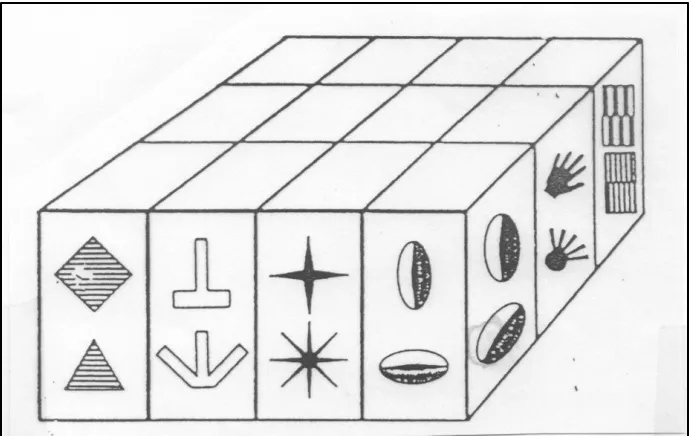
Figure 3 shows the schematic from Tanaka (1993) illustrating the cortical columnar organization in area TE. Vertical penetrations within a given column revealed sensitivities to the same basic shape, in all their lawful permutations, as if they were ‘visual object allophones’. The findings of Tanaka illustrate that in visual object recognition there is no stored template or ‘prototype’ that is matched to the input stimulus, but rather a flexible and collective process wherein the variations in the stored data (sets of columns) represent the various ‘visual allophones’ characteriz-ing an object’s features across the lawfully generated physical contcharacteriz-ingencies learned via visual experiences.
Figure 3: Columnar organization in area TE
6. How Might the Human Brain Normalize F2 Transitions?
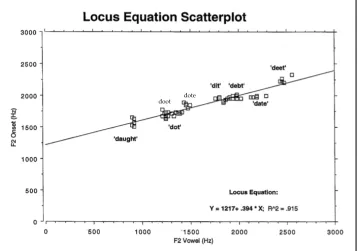
place category, the frequencies at which F2 transitions start (F2 onsets), and where they end in the vowel nucleus (F2 midvowel), display a linear and highly correlated relationship. Figure 4 shows a typical alveolar ([dV]) locus equation scatterplot, with 10 vowel contexts. Each [dV] token (e.g. deet, debt, dat, dot, doot, etc.) was randomly produced within a carrier phrase, five times, by a single speaker. The <x, y> coordi-nates are F2 onset frequencies plotted on the y-axis, and their corresponding F2 midvowel frequencies on the x-axis. The F2 transition is parameterized by two time points, where it starts and where it merges into the vowel. In the scatterplot below the regression slope was .394, y-intercept 1217 Hz, and squared .915. The R-squared values in LEs typically exceed .90, and the standard errors of estimate are usually less than 100 Hz.
Figure 4: Typical locus equation plot for an alveolar stop /d/
Linear scatterplots and contrastive LE slopes have been documented across stop place categories in every language thus far examined—including Arabic, English, Estonian, French, Spanish, Swedish, Thai, and Urdu (Lindblom, 1963; Duez, 1992; Sussman et al., 1993; Martínez-Celdrán & Villalba, 1995)—and thus might very well be a linguistic universal. The category-specific slopes of locus equations have been shown to be reliable phonetic markers for stop place (labial, alveolar, velar), as they capture the degree of anticipatory coarticulation of each vowel context on stop place occlusion (Krull, 1988; Sussman et al., 1991, 1993). Rather than viewing vowel context-induced variability as ‘unwanted noise’, the locus equation view maintains that differentially tweaking coarticulatory extents across stop place categories actual-ly underlies the acoustic distinctiveness to contrast stop place categories in acoustic space.
6.1. Possible Neural-Based Correlates for Mapping Locus Equation Structure
An essential requirement across sounds comprising a category to qualify them as ‘in-formation bearing parameters’ is a high degree of statistical regularity (Suga, 1989). When parameters of a communicative sound possess a high degree of statistical cor-relation, neuronal-based learning is optimized and subsequent representational map-ping in neural tissue becomes highly feasible (Suga et al. 1978; Suga, 1989). In this section, I will suggest two brain-based processing mechanisms: (i) a class of neurons capable of encoding locus equation acoustic parameters, F2 onset in relation to F2 midvowel, and (ii) a neural structure ideally suited to map equivalence classes —the neural column.
A neuron capable of processing both the onset and offset frequencies of F2 tran-sitions is well documented in neuroethology. They are referred to as ‘delay-tuned’ combination-sensitive neurons (e.g., Mittman & Wenstrup, 1995; Portfors & Wen-strup, 2001; Yavuzoglu et al., 2011). These higher-order auditory processing cells have been widely described in the mustached bat (e.g., Suga, 1994). One example is the derivation of target velocity in echo location. In this instance, the Doppler shifted frequency of the returning echo pulse (e.g., CF2, the second harmonic constant frequency segment) is processed relative to the CF2 frequency of the emitted pulse. The laws of physics determine the Doppler shift, and the bat uses this information to ‘calculate’ the speed of the target prey. The bat also calculates distance of the prey by the time delay between various harmonics of the pulse vis-à-vis returning echo. In both cases, tens of milliseconds separate the two biosonar signal components, just as they do in stop + vowel utterances (F2 onset relative to F2 midvowel Hz). The crucial point is that delay-tuned, combination-sensitive neurons are the ideal candidate neuron to encode the start and end of a F2 transition, arguably the most important acoustic cue in speech perception (Liberman & Mattingly, 1985).
6.2. The Significance of Linearity and the Locus Equation Slope
A basic requirement that must exist to allow encoding of variable inputs within neural columns is a shared physically-based commonality across the input stimuli. An interesting similarity emerges when one compares the linear scatterplots of LEs to <x, y> scatterplots of the physical input signals underlying both echolocation in the bat and sound localization processing in the barn owl. Velocity-coding (Doppler shift) and distance tuning in biosonar echo processing are based on perfectly linear relationships between the two signal elements for each emergent property (Suga et al., 1983). Similarly, ITD maps in the barn owl (Wagner et al., 1987) are formed from linear <frequency–phase> relationships inherently formed by the laws of physics.
The LE slope is a statistically generated metric that represents the correlational value of the plotted frequencies F2 onset and F2vowel. Said in another way LE slopes, characterizing a given stop place category, statistically capture a lawful pat-terning of variable F2 transitions in acoustic space. Thus, they illustrate the existence of a shared lawful commonality across acoustically-coded <x, y> coordinates represen-ting a stop place category. In sum, the laws of physics create the F2 transitions, and the brain utilizes these fine-grained acoustic stimuli for its own encoding purposes. Just as a linear regression slope captures and represents the entire spatial distribu-tion of F2 transidistribu-tions in acoustic phonetic space, the F2 ‘particulars’ hypothesized to exist within neural columns can collectively signal the same stop place perception in an isomorphic neural space.
6.3. Speaker-Based Differences in Stop + V Coarticulation
Figure 5: Locus equation slopes and y-intercepts across 10 male and 10 female speakers for labial, alveolar, velar stop categories
6.4. A Hypothesized Algorithm for Developing Categorical Mapping within a Column
In Sussman et al. (1991), a hypothetical algorithm was presented to provide an initial attempt at formalizing this mapping puzzle. It was organized in three (temporally sequential) tiers of processing: (i) stop burst processing; (ii) F2 onset processing; and (iii) F2midvowel processing. Each layer had synaptic connections to combinatorial ‘AND-gate’ neurons that respond best to the joint presence of multiple input signals. Using [dae] as an initial input CV, how does this signal finds its way to the [d] column’ within a developing ‘speech sound map’ (e.g. Guenther et al., 2006) driven by a child’s own babbling and ‘motherese’ external input?
with the same initial stop + assorted vowels activate similar combinatorial neurons coding that stop place. Why? Because they all possess an acoustic-based common-ality as captured and reflected by the contrastive and linear locus equation scatter-plots. As the infant, over time, hears words beginning with the same sound—‘daddy, doggie, daisy, dance, day, duck, deer…’—the above circuitry develops its ‘tuning’ pre-cision and slowly establishes perceptual identity and the resultant representations for the building blocks of phonology, the phonemic units of language.
Two experimental studies lend support to this conceptualization. Sussman et al. (1999) analyzed CV babbling and first word productions of an infant spanning the period of seven months to age 40 months. A total of 7,888 utterances were longitudinally analyzed, month by month (a total of 3,103 [bV], 3,236 [dV], and 1,549 [gV]). LEs scatterplots were generated from these transcribed data values. Babbling-based LEs bore very little resemblance to phonologically mature speakers. An inter-esting transformation was documented across development as babbling gradually transformed into first word attempts, and ended with the more sophisticated utterances of a 3-year-old. Specifically, initially flat ‘labial’ LEs generated from babbled CVs gradually became steeper, due to greater levels of anticipatory coarticu-lation; initially steep ‘alveolar’ LEs plots derived from reduplicated and variegated babbling gradually leveled off, due to decreased levels of anticipatory coarticulation, and thus more closely resembled the low-slope values of adult-like [dV] productions. These articulatory-based adjustments, documented by changing LE slope values, can be envisioned as a parallel developmental progression of a maturing ‘speech sound map’.
However, when LEs are derived from children diagnosed with the neurologi-cal disorder known as ‘developmental apraxia of speech’ (DAS), their mean slopes across [bV], [dV], and [gV] productions were not contrastive relative to age-matched peers, but highly similar—labial = .642, alveolar = .703, and velar = .749 (Sussman et al., 2000). It is no wonder that their speech exhibits a high degree of unintelligibility. Their speech motor control deficiencies preclude precise control of anticipatory coar-ticulation to acoustically separate and contrast stop place classes. Their phono-logically-organized speech sound maps are thus inherently impoverished, preclud-ing precise acoustic mapppreclud-ing of the acoustic elements of speech sounds with even-tual production of these sounds.
7. Summary and Conclusions
within specified tolerance ranges, that (iii) were linked by lawful physically-based, relationships. By virtue of the entire column functioning as a collective unit, the encoded variability served to eliminate or absorb the inherent ‘noise’. There is no matching of ‘on-line’ input signals to stored ‘prototypes’.
The basic similarities between the neuroethology examples and human speech perception for stop place coding were then described using the locus equation paradigm as a theoretical bridge between animal and human models of processing highly variable sensory inputs. An attempt was made to conceptualize a neural account of stop place categorization by using the columnar model from neuro-ethology, in combination with the remarkably linear and orderly data from normal productions of stop consonants produced with varied vowel contexts. The neural analog of a LE slope was hypothesized to be the contents of neural columns— encoding the collective acoustic commonalities of the F2 transitions characterizing each stop place category. Thus, in principle, columnar outputs coding stop place identity are loosely analogous to what a contrastive LE slope captures. The LE en-codes the F2 transition onset and offset on an <x, y> scatterplot, the brain is hypo-thesized to encode the same physically paired frequencies within sets of neural columns. The ultimate outcome is an invariant perception of a speech sound despite highly variable instances of that sound when in context. It is hoped that these conjectures will spark further discussions and innovative thinking to further advance our understanding of these encoding and representational issues.
In closing, the advent of ECoG electrode array studies performed on human subjects have provided the first glimpse into the ‘how’ of speech processing. Chang et al. (2010) provided direct evidence of cortical population response patterns for the categorical representations of /ba/–/da/–/ga/ from a 14-item synthesized continu-um systematically varying in F2 onsets. Mesgarani et al. (2014) reported the encoding of phonetic features directly tuned to a multiplicity of spectrotemporal acoustic cues. The conjectures put forth in this article will gain added validity as future ECog studies further clarify the nature of acoustic-phonetic representations of speech in human temporal cortex.
References
Ackerman, Diane. 2004. An Alchemy of Mind. New York: Scribner.
Barlow Horace, R.M. Hill & W.R. Levick. 1964. Retinal ganglion cells responding selectively to direction and speed of image motion in the rabbit. Journal of Physiology 173, 377–407.
Chang, Edward F., Jochem W. Rieger, Keith Johnson, Mitchel S. Berger, Nicholas M. Barbaro & Robert T. Knight. 2010. Categorical speech representation in human superior temporal gyrus. Nature Neuroscience 13, 1428–1432.
Duez, Danielle. 1992. Second formant locus–nucleus patterns: An investigation of spontaneous French speech. Speech Communication 11(9), 417–427.
Gahl, Susanne & Alan Yu. 2006. Introduction to the special issue on exemplar–based models in linguistics. The Linguistic Review 23, 213–216.
Goldinger, Stephen D. 1992. Words and voices: Implicit and explicit memory for spoken words. Storrs, CT: University of Connecticut doctoral dissertation. Guenther, Frank H., Satrajit Ghosh & Jason A. Tourville. 2006. Neural modeling and
imaging of the cortical interactions underlying syllable production. Brain and Language 96, 280–301.
Hawkins, Sarah. 2003. Roles and representations of systematic fine phonetic detail in speech understanding. Journal of Phonetics 31, 373–405.
Hockett, Charles. 1955. A Manual of Phonology. Baltimore, MD: Waverly Press.
Jacoby, Lawrence & Lee Brooks. 1984. Nonanalytic cognition: Memory, perception, and concept learning. In Gordon H. Bower (ed.) The Psychology of Learning and Motivation, 1–47. New York: Academic Press.
Krull, Diana. 1988. Acoustic properties as predictors of perceptual responses: A study of Swedish voiced stops. Phonetic Experimental Research at the Institute of Phonetics (PERILUS) 7, 66–70.
Lavie, René-Joseph. 2007. Exemplar theory in linguistics: A perspective for the cognitive subject. Communication to the 11th Congress of Cognitive Linguistics, Bordeaux, 19–21 May 2005. https://hal.archives-ouvertes.fr/halshs-00142394. Liberman, Alvin & Ignatius Mattingly. 1985. The motor theory of speech perception
revised. Cognition 21, 1–36.
Liberman, Alvin, Franklin Cooper, Donald Shankweiler & Michael Studdert– Kennedy. 1967. Perception of the speech code. Psychological Review 74, 431–461. Liberman, Alvin, Pierre Delattre, Franklin Cooper & Louis Gerstman. 1954. The role
of consonant–vowel transitions in the perception of the stop and nasal consonants. Psychological Monograph 68, 1–13.
Lindblom, Bjorn. 1963. Spectrographic study of vowel reduction. The Journal of the Acoustical Society of America 35 , 1773–1781.
Lotto, Andrew & Lori L. Holt. 2016. The frame problem in speech communication: Defining the dimensional space for phonetic categorization. In Augustine Agwuele & Andrew Lotto (eds.), Essays in Speech Processes, 68–82. Sheffield: Equinox.
Maturana, H. R. & S. Frenk. 1963. Directional movement and horizontal edge detectors in the pigeon retina. Science 142, 977–979.
McMurray, Bob & Allard Jongman. 2011. What information is necessary for speech categorization? Harnessing variability in the speech signal by integrating cues computed relative to expectations. Psychological Review 118(2), 219–246.
McMurray, Bob, Ariane Rhone & Kayleen Hannaway. 2016. Relativity in speech perception: From locus equations to predictive coding. In Augustine Agwuele & Andrew Lotto (eds.) Essays in Speech Processes, 30–67. Sheffield: Equinox. Mesgarani, Nima, Connie Cheung, Keith Johnson & Edward Chang. 2014. Phonetic
feature encoding in human superior temporal gyrus. Science 343, 1006–1010. Mittmann, David & Jeffrey Wenstrup. 1995. Combination-sensitive neurons in the
inferior colliculus. Hearing Research 90, 185–191.
Edelman & Vernon Mountcastle (eds.), The Mindful Brain, 7–50. Cambridge, MA: MIT Press.
Mullennix, John & David Pisoni. 1990. Stimulus variability and processing depen-dencies in speech perception. Perception and Psychophysics 47, 379–390.
Mullennix, John, David Pisoni & Christopher Martin. 1989. Journal of the Acoustical Society of America 85, 365–378.
Nelson, P. G., S. D. Erulkar & J. S. Bryan. 1966. Responses of units of the inferior col-liculus to time-varying acoustic stimuli. Journal of Neurophysiology 17, 834–860. Oyster, Clyde & Horace Barlow. 1967. Direction-selective units in rabbit retina:
Distribution of preferred directions. Science 155, 841–842.
Pierrehumbert, Janet. 2001. Exemplar dynamics: Word frequency, lenition and contrast. In Janet Bybee & Paul Hopper (eds.), Frequency and the Emergence of Linguistic Structure, 137–157. Amsterdam: John Benjamins.
Pierrehumbert, Janet (2003). Phonetic diversity, statistical learning, and acquisition of phonology. Language and Speech 46, 115–154.
Pisoni, David. 1992. Some comments on invariance, variability and perceptual nor-malization in speech perception. In John J. Ohala, Terrance L. Neary, Bruce M. Derwing, Megan M. Hodge & Grace E. Wiebe (eds.), Proceedings 1992 Inter-national Conference on Spoken Language Processing, 587–590. Banff: University of Alberta.
Pisoni, David. 1995. Some thoughts on ‘normalization’ in speech perception. Research on Spoken Language Processing, Progress Report No. 20. Bloomington, IN: Indi-ana University. [Appeared in Keith Johnson & John W. Mullennix (eds.) Talker Variability in Speech Processing, 9–32. San Diego, CA: Academic Press, 1997.] Portfors, Christine & Jeffrey Wenstrup. 1999. Delay-tuned neurons in the inferior
col-liculus of the mustached bat: implications for analyses of target distance. Journal of Neurophysiology 82, 1326–1338.
Shankweiler, Donald, Winifred Strange & Robert Verbrugge. 1977. Speech and the problem of perceptual constancy. In Robert Shaw & John Bransford (eds.), Per-ceiving,Acting, and Knowing: Toward an Ecological Psychology, 315–346, Hillsdale: NJ Erlbaum.
Sommers, Mitchell, Lynne Nygaard & David Pisoni. 1994. Stimulus variability and spoken word recognition: 1. Effects of variability in speaking rate and overall amplitude. Journal of the Acoustical Society of America 96, 1314–1324.
Suga, Nobuo. 1989. Principles of auditory-information processing derived from neuroethology. Journal of Experimental Biology 146, 277–286.
Suga, Nobuo. 1994. Multi–function theory for cortical processing of auditory information: Implications for single unit and lesion data for future research. Journalof Comparative Physiology 175, 135–144.
Suga, Nobuo, William E. O’Neill & Toshiki Manabe. 1978. Cortical neurons sensitive to combinations of information-bearing elements of biosonar signals in the mustached bat. Science 200, 778–781.
Sussman, Harvey M., Nicola Bessell, Eileen Dalston & Tiffany Majors. 1997. An investigation of stop place of articulation as a function of syllable position: A locus equation perspective. Journal of the Acoustical Society of America 101(5), 2826–2838.
the development of CV coarticulation: A case study. Journal of Speech, Language, and Hearing Research 42, 1080–1096.
Sussman, Harvey M., Thomas Marquardt & Jadine Doyle. 2000. An acoustic analysis of phonemic integrity and contrastiveness in developmental apraxia of speech. Journal of Medical Speech–Language Pathology 8(4), 301–313.
Sussman, Harvey M., Helen McCaffrey & Sandra Matthews. 1991. An investigation of locus equations as a source of relational invariance for stop place categorization. Journal of the Acoustical Society of America 90, 1309–1325.
Sussman, Harvey M., Celeste Duder, Eileen Dalston & Antonina Cacciatore. 1999. An acoustic analysis of the development of CV coarticulation: A case study. Speech, Language, and Hearing Research 42, 1080–1096.
Sussman, Harvey M., Katherine Hoemeke & Farhan Ahmed. 1993. A cross-linguistic investigation of locus equations as a relationally invariant descriptor for place of articulation. Journal of the Acoustical Society of America 94, 1256–1268.
Tanaka, Keiji. 1993. Neural mechanisms of object recognition. Science 262, 685–688. Wagner, Herman, Terry Takahashi & Mark Konishi. 1987. Representation of
intra-aural time difference in the central nucleus of the barn owl’s inferior colliculus. Journal of Neuroscience 7, 3105–3116.
Yavuzoglu, Asuman, Brett Schofield & Jeffrey Wenstrup. 2011. Circuitry underlying spectrotemporal integration in the auditory midbrain. Journal of Neuroscience 31, 14424–14435.
Harvey M. Sussman
University of Texas at Austin Departments of Linguistics and Communication Sciences & Disorders 305 E. 23rd St. (B5100)
Austin, TX 78712 USA