Research Paper:
Correlation Analysis of the Tinnitus
Handicap Inventory and Distress Network in Chronic
Tinnitus: An EEG Study
Samer Mohsen1 , Saeid Mahmoudian2 , Saeed Talbian3 , Akram Pourbakht4*
1. Department of Otolaryngology, School of Medicine, Damascus University, Damascus, Syria. 2. ENT and Head & Neck Research Center,Iran University of Medical Sciences, Tehran, Iran. 3. School of Rehabilitation, Tehran University of Medical Sciences, Tehran, Iran.
4. Department of Audiology, School of Rehabilitation Sciences, Iran University of Medical Sciences, Tehran, Iran.
* Corresponding Author: Akram Pourbakht, PhD.
Address: Department of Audiology, School of Rehabilitation Sciences, Iran University of Medical Sciences, Tehran, Iran. Tel: +98 (21) 2225054
E-mail: mohsen.s@tak.iums.ac.ir
Introduction:Tinnitus is a common disorder with a considerable amount of distress that affects the patient`s daily life. No objective tools were approved for measuring tinnitus distress. It can be estimated only by subjective scales and questionnaires, albeit, the Electroencephalography (EEG) studies have reported some alterations regarding tinnitus distress network. This study aimed to investigate the correlation between Tinnitus Handicap Inventory (THI) and the recorded EEG data.
Methods:A total of 33 chronic tinnitus cases (9 females) with the mean age of 42.67 years were recruited. Their THI scores were collected, and a 3-minute EEG recorded with eye closed at resting-state. The correlation analysis was performed on THI scores and the current density in the selected Region of Interests (ROIs) concerning the distress network for the eight frequency bands. The patients grouped depending on the THI cutoff point of 56 into low and high THI groups, and then the groups were compared for source analysis and functional connectivity between ROIs using standardized low-resolution brain electromagnetic tomography.
Results:A significant positive correlation was seen between THI scores and the electrical activity in the Anterior Cingulate Cortex (ACC), the prefrontal cortex, and the parahippocampus for an alpha band (P<0.05) and in the ACC for beta (P<0.01). Source analysis showed significant differences with increased activity in the high THI group for alpha, beta and gamma bands. Functional connectivity was also elevated in the high THI group between the ROIs in alpha and beta bands.
Conclusion:THI can be a useful tool for measuring tinnitus distress, and it has a high correlation with EEG data.
Article info: Received: 16 Jan 2019
First Revision: 10 Feb 2019
Accepted: 17 Jul 2019
Available Online: 01 Sep 2019
Keywords:
Tinnitus, Tinnitus-related distress, Tinnitus Handicap Inventory (THI), Correlation, Electroencephalography, Functional connectivity
Citation: Mohsen, S., Mahmoudian, S., Talbian, S., & Pourbakht, A. (2019). Correlation Analysis of the Tinnitus Handicap Inventory and Distress Network in Chronic Tinnitus: An EEG Study. Basic and Clinical Neuroscience, 10(5), 499-514. http:// dx.doi.org/10.32598/bcn.9.10.215
: http://dx.doi.org/10.32598/bcn.9.10.215
Use your device to scan and read the article online
1. Introduction
earing a sound(s) in the ears or the head
with-out any external source is called tinnitus
(Jas-treboff, 1990). This phantom perception or phenomenon can be one of the most
stress-ful experiences for a person (Heller, 2003).
Looking at tinnitus epidemiology, we can expect that ap-proximately 10%-15% of the society members are
suffer-ing from tinnitus (Sanchez, 2004; Bhatt, Lin, &
BhattachaL-ryya, 2016). The problem gets more prevalent and severe
with increasing age (Sindhusake et al., 2003). It can affect
daily activities, sleep, concentration and cause functional
and mood disorders (Henry, Dennis, & Schechter, 2005).
Earlier reports indicated that 6%-25% of the tinnitus
suf-ferer declared some reduction of their quality of life
(Ba-guley, 2002) with the most debilitating degrees occurring
in 2%-4% of the population (Axelsson & Ringdahl, 1989).
As a problem with high prevalence and substantial distress, tinnitus has become one of the popular subjects of
medi-cal, behavioral and neuroscience studies (Landgrebe et al.,
2012).
Objective tools cannot measure tinnitus distress since it is a subjective feeling with no correlation to the psy-choacoustic properties of the perceived sound such as matched loudness, pitch, and hearing loss or even with
the demographic characteristics of the patients
(Ander-sson, 2003; Hallam, Rachman, & Hinchcliffe, 1984; Nooruzian et al., 2017). Therefore, several subjective scales and self-reported questionnaires have been es-tablished for measuring tinnitus distress and intensity
depending on its impact on daily life and many other features.
The visual analog scale is one of the easy to use tools for estimating tinnitus loudness and distress through giv-ing a degree from 0 to 10 dependgiv-ing on the patient’s
feel-ings (Price, McGrath, Rafii, & Buckingham, 1983).
Tinnitus Handicap Inventory (THI), alongside some other questionnaires, is a well-established and widely-used tinnitus measure for clinical and research purposes. THI has a high validity (r>0.80) and test-retest reliability (95% of the observed differences falling within ±2 SD), as well as good adequacy for evaluating treatment
out-come (Newman, Sandridge, & Jacobson, 1998). Three
principle dimensions are covered in these items:
func-tional, emofunc-tional, and catastrophic subscales (
Klein-stäuber, Frank, & Weise, 2015; Newman, Jacobson, & Spitzer, 1996).
The THI has been translated and validated in many languages, so it became an international tool for assess-ing the tinnitus-related handicap and its impact on daily living, especially in busy clinics. The Persian version or
THI-P was translated and standardized by Mahmoudian,
Shahmiri, Rouzbahani, Jafari, Reza Keyhani, (2011),
and its psychometric properties were validated by Jalali ,
Soleimani, Fallahi, Aghajanpour, & Elahi, (2015).
Depending on the total score of THI, tinnitus can be
classified into five grades, from slight to catastrophic handicaps. These five grades can also be divided into
two categories of T1 from 0-56 points and T2 from
57-Highlights
● THI score is a suitable tool for indicating the amount of tinnitus distress;
● THI score has a good correlation with tinnitus distress activity;
● sLORETA analysis showed important findings in tinnitus distress according to THI.
Plain Language Summary
Tinnitus is a common disorder with a considerable amount of distress that affects the person`s daily life. No objective tools were approved for measuring tinnitus distress. It can be estimated only by subjective scales and questionnaires, albeit, the Electroencephalography (EEG) studies have reported some alterations regarding tinnitus distress network. The aim of this study was to investigate the correlation between Tinnitus Handicap Inventory (THI) and the recorded
EEG data. The study results showed a significant positive correlation between THI scores and the electrical activity in
the distress network activity in the brain. Important differences were noticed between the high and low distress groups. This means that THI can be a used as a tool for measuring tinnitus distress with a high correlation to EEG data.
100 points based on the tinnitus impact on daily life, that is the patient can do everyday activities in grades 1-3 and
in the higher grades he cannot (McCombe et al., 2001;
Takahashi et al., 2017).
Neuroimaging studies have almost succeeded in
un-raveling the neural correlates of tinnitus (Husain, 2016;
Lanting, de Kleine, & van Dijk, 2009; Schmidt, Zim-merman, Bido Medina, Carpenter-Thompson, & Hu-sain, 2018). In other words, the involvement of auditory and non-auditory areas in generating and perception of tinnitus, and its accompanying distress have been well
explained (De Ridder et al., 2014). Encephalography
research on tinnitus patients revealed several alterations in the oscillatory power of the frequency bands of brain function. The decreased alpha power in the auditory cor-tex has been substituted by increased theta power, and an increase of gamma power in the contralateral cortex was
reported by some studies (Llinás, Ribary, Jeanmonod,
Kronberg, & Mitra, 1999;Lorenz, Müller, Schlee, Hart-mann, & Weisz, 2009; Weisz et al., 2007).
Regarding tinnitus distress, a recent EEG study using standardized low-resolution brain electromagnetic to-mography (sLORETA) source localization highlighted the relationship between tinnitus distress and increas-ing of beta-band activity in the Anterior Cincreas-ingulate Cor-tex (ACC) and the amount of distress was related to the alpha band activity in several brain areas that form the
distress network (Vanneste et al., 2010a). Several EEG
and fMRI studies on tinnitus patients corroborated the increased activity in distress network, which consists of
the amygdala (Chen et al., 2017), ACC (Vanneste, Joos,
Ost, & De Ridder, 2018), insula (van der Loo, Congedo, Vanneste, De Heyning, & De Ridder, 2011), and
para-hippocampus (De Ridder et al., 2006). These hubs are
interconnected and overlapped functionally with tinnitus
network (De Ridder, 2014). Furthermore, some other
re-ports revealed the increased functional connectivity be-tween the precuneus and the Orbitofrontal Cortex (OFC)
and Dorsolateral Prefrontal Cortex (DLPFC) (Schlee
et al., 2009;Schmidt, Carpenter-Thompson, & Husain, 2017) in beta and gamma bands. These frontal areas showed some laterality for emotional processing, that is, the right OFC and DLPFC are related to distress network
while the left side is linked to depression network (Joos,
Vanneste, & De Ridder, 2012).
As previously stated, EEG studies have yielded valu-able data about tinnitus-related distress neural correlate;
however, there are some conflicting data due to tinnitus
heterogeneity and also for the high variability in tinnitus
EEG studies methodologies (Møller, 2007). To use these
data in diagnostic and therapeutic aspects, they should be correlated with subjective data. So far, several studies have assigned good correlations between the electrical activity at distress network and the amount of distress
calculated by Tinnitus Questionnaire (TQ) (Song, De
Ridder, Schlee, Van de Heyning, & Vanneste, 2013a).
Such data can be beneficial, especially for following the
treatment effects and also make right decisions in
treat-ments like neurofeedback and neuromodulation
(Moos-savi & Mohsen, 2016).
THI as a measure of tinnitus handicap could show good correlations with other self-reported and -rating psychological scales like the visual analog scale of
tin-nitus annoyance (Figueiredo, de Azevedo, & de Mello
Oliveira, 2009), tinnitus acceptance (Westin, Hayes, & Anderson, 2008), and tinnitus-related distress (Monzani et al., 2008; Salviati et al., 2013). Thus, we can assume that THI can be a gold standard for assessing tinnitus distress if it has a good correlation with the previously mentioned EEG or neuroimaging data of distress net-work. The main goal of this study is to investigate the relationship between the THI scores in a homogenous tinnitus group with the recorded EEG electrical activity after controlling the other important confounding factor i.e., tinnitus-related loudness. Then, we will use the THI cutoff point of 56 to have two groups with high and low THI scores and compare them with regard to distress network electrical activity.
2. Methods
2.1. Study participants
Thirty-three right-handed patients (9 females) with non-pulsatile chronic tinnitus (duration more than 6 months) were recruited in this study. Their Mean±SD age was 42.67±10.95 years. All patients had no history of Meniere’s disease, otosclerosis, or any other middle ear problems, no neurological disorders such as head trauma, and brain tumors. Those who were receiving medications for mental or psychological disorders were excluded. To get a more homogenous group, all patients were given the validated Persian version of Hospital
Anxiety and Depression Scale (HADS) (Montazeri,
Vahdaninia, Ebrahimi, & Jarvandi, 2003) and those with a score of 21 or less (less than 11 for either depression and anxiety subscales, indicating no depression or
anxi-ety disorders) were included in the study (Snaith, 2003).
than 20 dB HL in octave frequencies of 250-2000 Hz and not more than 40 dB HL in the higher frequencies (4000-8000 Hz) which refer to normal hearing or mild hearing loss in high frequencies and higher hearing lev-els were excluded. All types of tinnitus were accepted with no limitations regarding the psychoacoustic aspects
and laterality (Lim, Lu, Koh, & Eng, 2010). This study is
a part of a randomized clinical trial registered at Iranian
Registry of Clinical Trials (Identifier: 20586 30/6/2017)
and was approved by the Ethics Committee of Iran Uni-versity of Medical Sciences. After explaining research methodology, written informed consent was taken from the subjects.
2.1.1. Tinnitus handicap inventory questionnaire and grouping
All patients filled in the items of the THI-P (Mah-moudian et al., 2011). It contains 25 items with three choices (Yes, No, and sometimes) and a total score range of 0-100. The total scores were computed, and the pa-tients were allocated into two groups depending on their achieved scores: the low and high THI group with scores less and more than 56, respectively. As previously stated, this cutoff point was used for grading tinnitus handicap as compensated or decompensated through its effects
on the patient’s daily activity (McCombe et al., 2001).
Furthermore, the Visual Analogue Scale (VAS) was used to assess the tinnitus Loudness (VAS-L) and Annoyance (VAS-A). Each patient was asked to give a degree from 0-10 depending on the intensity of his problem.
2.1.2. EEG data collection
EEG recordings were obtained using a 64-channel Brain Quick LTM (Micromed, Italy) in a shielded room against sounds and electromagnetic signals. Each partici-pant sat upright in a comfortable chair and using pillows to reduce the muscles’ contraction. The actual recording time lasted 3 minutes with eyes closed. The recordings were sampled using 29 electrodes placed on FP1, FPz, FP2, F7, F3, Fz, F4, F8, FT7, FC3, FCz, FC4, FT8, T7, C3, Cz, C4, T8, TP7, CP3, CPz, CP4, TP8, P3, P4, POz,
and Oz according to the international 10-20 system
(Jas-per, 1958) referenced to the tip of nose and the ground electrode placed on the forehead. The electro-oculogram was recorded using two electrodes placed below and near the outer canthus of the left eye. Electrodes impedances
were checked and kept below 10 kΩ. The online sam
-pling rate was 1024 with a band-pass filter of 0.4-200 Hz.
EEG analysis was performed offline in the MATLAB
v. 8.4, R2014b environment. The obtained data were
band-pass filtered (Finite impulse response, FIR filter)
to 1.5-70 Hz and subsequently transposed into EEG Lab
software (Delorme & Makeig, 2004). Using EEG Lab,
the data were plotted and inspected for manual artifact rejection; then, an independent component analysis ICA was conducted to exclude remaining artifacts resulting from eye blinks, eye movement, teeth clenching, and electrocardiography from the EEG stream. After that, the average Fourier cross-spectral matrices were com-puted for the eight frequency bands: delta (2–3.5 Hz), theta (4–7.5 Hz), alpha1 (8–10 Hz), alpha2 (10–12 Hz), beta1 (13–18 Hz), beta2 (18.5–21 Hz), beta3 (21.5–30 Hz), and gamma (30.5–44 Hz). For the later stages, data were resampled to 256 Hz and referenced again to the standard average reference.
2.1.3. Source localization analysis
For source analysis, we used sLORETA software V. 20081104 provided by the KEY Institute for Brain-Mind Research (University Hospital of Psychiatry, Zurich, Switzerland; http://www.uzh.ch/keyinst/NewLORETA/ LORETA01.htm). sLORETA uses algorithms to iden-tify the intracerebral electrical sources that generated the scalp-recorded activity through conventional EEG in each
of the 8 frequency bands (Pascual-Marqui, 2002). It
calcu-lates the current density (A/m2) from the electric neuronal activity in a spatial space consists of 6239 voxels (voxel
size 5*5*5 mm3 ) without considering a predefined num
-ber of active sources (Pascual-Marqui, Esslen, Kochi, &
Lehmann, 2002;Wagner, Fuchs, & Kastner, 2004).
The sLORETA solution space is limited to cortical gray matter and both hippocampi and amygdala, which
defined by the digitized Montreal Neurological Institute
(MNI) 152 template (Fuchs, Kastner, Wagner, Hawes, &
Ebersole, 2002;Mazziotta et al., 2001). sLORETA
im-aging analysis has received significant validation from
studies combining this technique with other source lo-calization methods such as magnetic resonance imaging
MRI and fMRI (Mulert et al., 2004;Vitacco, Brandeis,
Pascual-Marqui, & Martin, 2002;Worrell et al., 2000), and also PET scan (Positron Emission Tomography)
(Dierks et al., 2000;Zumsteg, Wennberg, Treyer, Buck, & Wieser, 2005).
2.1.4. Functional connectivity analysis
Coherence (linear dependence) and phase
synchroniza-tion (non-linear dependence) over the eight predefined
regions. It was refined by Pascual Marqui to remove the
artifacts caused by the volume conduction and spatial resolution of the instantaneous non-physiological
con-taminating signals (Pascual-Marqui, 2007a, 2007b).
These measures are positive and become zero when there is no dependence.
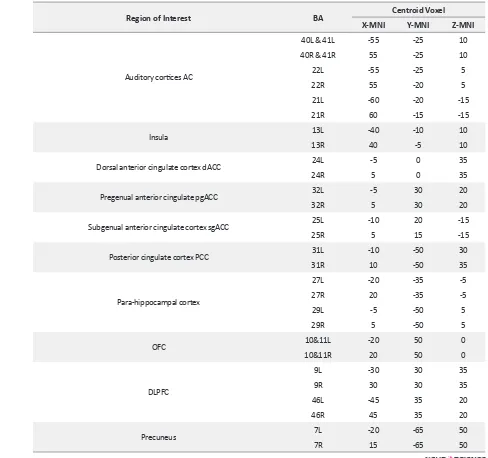
Twenty-eight ROIs were selected depending on the
previ-ous literature on tinnitus (De Ridder et al., 2014; Vanneste
et al., 2010b;Weisz et al., 2007). Each ROI composed of a single voxel that is the nearest one to the center of the region
with a 5 mm radius around the centroid voxel. Table 1
dem-onstrates the 28 selected ROIs for this study.
2.1.5. Region of interest analysis
The log-transformed electrical current density (μA/
mm2) was computed for the 28 ROIs, differences in activity between the two THI groups were statistically assessed using nonparametric permutation test SnPM using sLORETA statistic toolbox. About 5000 random-izations were considered which, account for the voxel-by-voxel comparisons. A paired Student t-test was used to compare maps using the sLORETA (this method ap-plies a collection of tests for all voxels and all frequency
bands); a threshold of P<0.05 was accepted for signifi -cant differences, i.e. voxels that had an activity threshold
more than the threshold of defined P-value, were detect -ed and report-ed.
2.2. Statistical analysis
Statistical analyses for demographic and tinnitus char-acteristics were performed using the SPSS V. 19.0 (SPSS Inc., Chicago, IL). First, the Kolmogorov-Smirnov test was used to investigate the normal distribution of data in all variables. Then, the age, tinnitus duration, matched loudness, etc., were compared between the two groups using the Independent t-test and Mann-Whitney test
de-pending on the normal distribution of the data (Table 2).
Differences in gender, tinnitus type, and laterality
distri-bution were tested using the Chi-square (χ2) test.
For correlation analysis, we used the Pearson test or its non-parametric equivalent (Spearman's rho) to mea-sure the correlation degree between the THI scores and the ROIs. For this test, we selected the regions that had
significant differences in any frequency band, as previ -ously stated in the region of interest analysis. The ROIs selected are the left and right auditory cortices (A1 A2), the left and right OFC, the left and right DLPFC, the left and right ACC and the parahippocampus separately for the alpha, beta and gamma frequency bands. To measure
the strength of the relationship between THI and the distress network (current densities at ROIs), we should control another confounding variable, which is the tinni-tus loudness measured by VAS-L. For that, we used the
partial correlation (Anderson, 1954), which measures
the degree of relationship after removing the effect of other variables. Using this method, we can determine the substantive amount of source analyzed current density related to tinnitus distress not to its intensity (measured by VAS-L). It should be said that we used the individual THI scores, not the THI grading to have a continuous
variable that can be correlated to a specific ROI activ
-ity. Lastly, to confirm the previously obtained results,
we conducted independent t-test or its non-parametric
equivalent to compare the two groups for the significant
ROIs current densities. In this test all voxels were aver-aged for each selected ROI.
3. Results
Table 2 presents the male-female ratio, age, hearing level, tinnitus type, duration, and laterality. There were
no significant differences in age, gender, and tinnitus du -ration between the two groups (All P>0.18).
3.1. Correlation between tinnitus handicap inven-tory and region of interests’ current density
The correlation analysis showed a significant (P<0.05)
positive correlation between the total score of THI and the log-transformed current density of the left and right insula (BA13), ACC (BA24,25,32), PCC (BA31), parahippocampus (PHC), as well as, the right OFC (BA10,11) and right DLPFC (BA9) in the alpha band.
After controlling the VAS-L score, a significant positive
partial correlation (P<0.05) was kept for the right dACC, PCC, PHC, and right DLPFC (Table 3a). Besides,
sig-nificant (P<0.05) positive correlations were seen in beta band (β1: 13-18 Hz, β2: 18.5-21 Hz) of auditory cortex
(left and right BA21, 22), left insula, dACC, sgACC, PHC right DLPFC. After controlling for VAS-L only the
dACC had a significant (P<0.01) positive partial correla -tion with THI (Table 3b). Regarding the gamma band,
the analysis revealed a significant (P<0.05) positive rela -tionship between the THI and the current density of the left auditory cortex (BA 21, 22), the left insula, PHC, left
OFC and left DLPFC. This significance was lost in the
partial correlation (Table 3c).
3.2. High versus low tinnitus handicap inventory groups
Table 1. Twenty-eight regions of interest and their MNI coordinates
Region of Interest BA Centroid Voxel
X-MNI Y-MNI Z-MNI
Auditory cortices AC
40L & 41L -55 -25 10
40R & 41R 55 -25 10
22L -55 -25 5
22R 55 -20 5
21L -60 -20 -15
21R 60 -15 -15
Insula 13L -40 -10 10
13R 40 -5 10
Dorsal anterior cingulate cortex dACC 24L -5 0 35
24R 5 0 35
Pregenual anterior cingulate pgACC 32L -5 30 20
32R 5 30 20
Subgenual anterior cingulate cortex sgACC 25L -10 20 -15
25R 5 15 -15
Posterior cingulate cortex PCC 31L -10 -50 30
31R 10 -50 35
Para-hippocampal cortex
27L -20 -35 -5
27R 20 -35 -5
29L -5 -50 5
29R 5 -50 5
OFC 10&11L -20 50 0
10&11R 20 50 0
DLPFC
9L -30 30 35
9R 30 30 35
46L -45 35 20
46R 45 35 20
Precuneus 7L -20 -65 50
7R 15 -65 50
BA: Brodmann Area; L: left; R: right; MNI: Montreal Neurological Institute
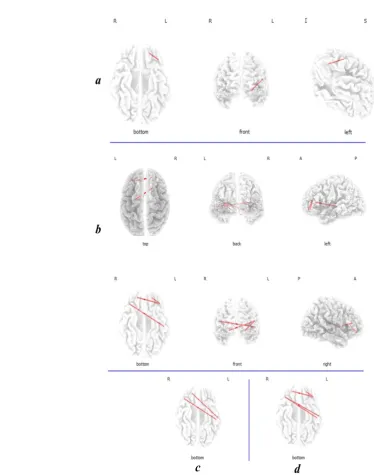
Compared to the low THI group, the high THI group showed increased activity in the right DLPFC for al-pha2, beta1, and beta2 and beta3 frequency bands. Also, increased activity was found in the left DLPFC for
gam-ma band (Figure 1). Also, another increased activity was
seen in the right OFC, dACC, and right and left auditory
cortex (BA21) for beta1 and beta2 bands (Figure 2).
3.3. The region of interest analysis
For the area found to be more activated in the source localization comparison, a t-test was performed. The current density among all voxels in the ROI was aver-aged and compared between the two independent THI
groups. Significant differences were noticed in the right
OFC and right DLPFC for the alpha band (P<0.01). For
the beta band, significant differences were found in the
dACC (P<0.01), the right DLPFC (P<0.01), but not for the auditory cortex (P=0.42) and right OFC (P=0.54).
Also, the test results revealed a significant difference for
gamma band in the left DLPFC (P<0.05) but not in the auditory cortex (P=0.41).
3.4. Functional connectivity analysis
3.5. Coherence connectivity
The high THI group showed increased coherence func-tional connectivity between left OFC and left DLPFC in
the alpha1 band (Figure 3a). In addition, the high THI
group demonstrated increased connectivity between the left auditory cortex (BA21) and the right DLPFC BA9, and between the left DLPFC and the bilateral OFC in
beta1 and beta2 frequency bands (Figure 3b). All these
differences were significant (t>3.94, P<0.05). Further -more, increased functional connectivity with a marginal
significance (t=3.84 P<0.1) was noticed for alpha2 band
between the auditory cortex (BA21, 22) and the right
DLPFC and OFC (Figure 3c). Also for beta3 band
be-tween the auditory cortex (BA21, 22) and the right DLP-FC (Figure 3d).
3.6. Lagged phase synchronization
The high THI group showed a significant (t>4.24
P<0.05) increased lagged phase synchronization func-tional connectivity between the right parahippocampus and the bilateral OFC and the dACC in the alpha2 band
(Figure 4a), and also between the parahippocampus and
Table 2. Population statistics and tinnitus characteristics
Variables Low THI Groupn=17 High THI Groupn=16 P
Age (y), Mean±SD 44.76±10.65 40.44±11.15 0.18
Male/Female 13/4 11/5 0.86
Tinnitus type Tonal/NBN* 13/4 13/3 0.68
Tinnitus laterality Left/Right/both ears 6/5/6 5/4/7 0.81
Tinnitus duration (y), Mean±SD 5.44±4.9 5.21±5.1 0.98
Matched-loudness, Mean±SD 5.82±2.5 6.69±3 0.46
Total THI score, Mean±SD 42.24±5.51 67.13±6.36 <0.01
VAS-L score, Mean±SD 5.9±1.3 7.9±1.5 <0.01
VAS-A score, Mean±SD 5.8±1.9 8.34±1.5 <0.01
*NBN: Narrow-Band Noise
Figure 1: sLORETA contrast analysis between the low and high THI groups
the left DLPFC, right OFC and dACC in the beta1 and
beta2 frequency bands (Figure 4b). Besides, another
sig-nificant increased functional connectivity was noticed
between the right auditory cortex (BA22) and the dACC and also, between the left precuneus and the left OFC in the beta2 and beta3 frequency bands. Moreover, a signif-icant increased functional connectivity was detected be-tween the right auditory cortex (BA22) and the bilateral
PCC in the range frequency of beta3 band (Figure 4c).
4. Discussion
The results of this study revealed that THI question-naire scores had a good correlation with some EEG fea-tures in patients with chronic tinnitus. Grouping tinnitus patients sample using the THI score yielded noticeable differences between the two groups concerning distress network; such results cannot be referred either to differ-ences in the demographic properties of the population or to the tinnitus intensity.
Tables 3. Significant correlations and partial correlations for the THI and regions of interests
Frequency Band ROI-Brodmann Area THI THI Controlled for VAS-L
a-alpha
13L insula 0.61** 0.32
24R dACC 0.4* 0.35*
25R sgACC 0.38* 0.15
32R pgACC 0.51** 0.23
31R PCC 0.39* 0.4*
27L PHC 0.47** 0.39*
11R OFC 0.8** 0.35
46R DLPFC 0.8** 0.34*
b-Beta1
21L A2 0.47** 0.25
22L A2 0.49** 0.25
13L Insula 0.48** 0.13
24L dACC 0.84** 0.80**
24R dACC 0.82** 0.75**
25L sgACC 0.78** 0.28
27L PHC 0.45** 0.09
9R DLPFC 0.77** 0.22
c-Gamma
21L A2 0.5** 0.26
22L A2 0.48** 0.26
13L Insula 0.47** 0.13
27L PHC 0.47** 0.16
11L OFC 0.4* 0.1
9L DLPFC 0.38* 0.47
THI scores had a positive relationship with the electri-cal activity in the brain regions related to the distress net-work, including the dACC, OFC, DLPFC, PHC, and the
insula (Langguth et al., 2012;Leaver et al., 2012;
Van-neste et al., 2010b). Likewise, there was a remarkable in-creased functional connectivity between the previously mentioned hubs and the secondary auditory cortex in the high THI tinnitus group compared to the low THI group.
As mentioned above, our study on THI and
resting-state EEG data revealed a significant correlation be -tween the questionnaire scores and the brain activity in the brain areas known recently as the neural substrates of distress. For example, our results showed a positive cor-relation in an alpha frequency band between the THI and the dACC, PCC, insula, PHC, OFC, and DLPFC; these
areas were identified by Vanneste et al. as the processing
centers of tinnitus distress (Vanneste et al., 2010b). Other
studies have linked the amount of tinnitus-related
dis-tress to the alpha band activity in these regions (Ridder,
Vanneste, & Congedo, 2011), and that accords with our
results of positive correlation (Figure 5a). Moving to the
beta frequency band, we found a highly significant posi -tive relationship between THI and the electrical activity of dACC, even after controlling for the tinnitus intensity.
This result is in coherence with other's findings (Joos et al., 2012;Meyer et al., 2017). The dorsal ACC func-tion was linked to the emofunc-tional processing network, and it is involved in the adverse effects caused by tinnitus
and similar disorders like chronic pain (Boggio, Zaghi,
& Fregni, 2009;Price, 2000) and also the post-traumatic
stress disorder (Begić, Hotujac, & Jokić-Begić, 2001).
Different neuroimaging studies, such as fMRI studies
Figure 2. The slice view of sLORETA contrast analysis between low and high THI groups
The high THI group showed higher current density values compared to the low THI group in the right DLPFC, right OFC, dACC, and left and right auditory cortex (BA21) for beta2 band. The red color refers to the higher current density (positive values in t-test). The three slices are: axial, sagittal and coronal from left to right respectively.
(Anand et al., 2005) and PET scan studies (Kennedy, Javanmard, & Vaccarino, 1997), also reported similar
findings. Moreover, another study has reported that the
higher activity of the dACC predicts the higher level of
the tinnitus distress the patients feel (Song, De Ridder,
Schlee, Van de Heyning, & Vanneste, 2013b).
Combin-ing that with our findCombin-ings, we may claim: the higher ac -tivity of the dACC causes a higher amount of distress
reflected by the higher scores of THI (Figure 5b).
We used partial correlation in our analysis. Our intent was to control the relationship between THI and EEG
Figure 3. Coherence connectivity contrast analysis between the low THI group and the high THI group
a. The high THI group showed increased functional connectivity between the left OFC and left DLPFC in alpha1; b. between the left auditory cortex (BA21) and the right DLPFC BA9, the left DLPFC and the bilateral OFC in beta 2; c. also, an increased functional connectivity with a marginal significance (P<0.1) was noticed between the auditory cortex (BA21, 22) and the right DLPFC and OFC in alpha2; d. between the auditory cortex (BA21, 22) and the right DLPFC in beta3.
Figure 4. The analysis of lagged phase synchronization connectivity contrast between the low THI group and the high THI group
a. The high THI group showed increased functional connectivity between the right parahippocampus and the bilateral OFC and the dACC in alpha2; b. between the parahippocampus and the left DLPFC, right OFC and dACC, between the right auditory cortex (BA22) and the dACC, and also between the left precuneus and the left OFC in beta2; c. Moreover, increased functional connectivity is seen between the right auditory cortex (BA22) and the bilateral PCC in the range frequency of beta3 band, in addition to the previ-ously mentioned connections in beta2.
data for another important tinnitus aspect like tinnitus
intensity that seems to be beneficial. Some of the cor -related regions like the auditory cortex (BA21, BA22) and the PHC and the insular cortex in the three frequen-cy bands and the left DLPFC in the gamma band have
lost their significance after controlling VAS-L. This is a
desired and accepted result, since the network that con-nected those areas (the insula, PHC, and DLPFC) are more involved in attentional and salience tasks, and they code for tinnitus intensity more than its related distress
(Husain, 2016; Husain, Akrofi, Carpenter-Thompson, & Schmidt, 2015;Mirz, Gjedde, Sødkilde-Jrgensen, & Pedersen, 2000).
In our methodology, we divided the patients into two groups depending on the THI cutoff score of 56, concern-ing the impact of tinnitus on the patient’s daily activities. In this regard, we had some risk avoidance for re-naming the low and high THI groups as low and high distressed
groups, but our results came to support this classification. In our comparisons, we found significant differences be -tween the high and low THI groups in the right OFC and DLPFC in alpha frequency band, which was in agreement
with previous studies (Joos et al., 2012). The same is true
for the beta frequency band differences in dACC (Song et
al., 2013a) and the gamma band in the left DLPFC (Adam-chic, Langguth, Hauptmann, & Tass, 2014). Other
support-ive findings were considered in the functional connectivity
contrast between the two groups. Increased functional con-nectivity in the high THI group between the secondary au-ditory cortices and the frontal areas, and also between the parahippocampus and the centrofrontal regions is
consis-tent with the previously reported sLORETA studies
(Has-san, Dufor, Merlet, Berrou, & Wendling, 2014).
In conclusion, the THI score is a suitable tool for de-termining the tinnitus distress with a good relation to the EEG oscillatory alterations caused by tinnitus distress. Although such inference was formerly proved for TQ
(Joos et al., 2012) and the latter is used widely as a dis-tress indicator in tinnitus studies, THI questionnaire has fewer items and is more easily scored and clinically used
(Kleinstäuber et al., 2015). Taken together, from our
findings and depending on the others reports (Monzani et al., 2008;Newman et al., 1996;Salviati et al., 2013), we can conclude that THI is a convenient tool for use in diagnostic purposes, monitoring the effects of treatment and also for the sake of research. Lastly, this study had some limitations such as the small sample size since it is always better to include more participants, especially for EEG studies and correlation analysis. Also, it is better to analyze the subscales of THI (the functional, emotional and catastrophic) that may help reach the optimal use of the questionnaire.
Ethical Considerations
Compliance with ethical guidelines
The study procedure was according to the Declaration of Helsinki principles and the ethics committee of Iran
Uni-versity of Medical Sciences confirmed the study procedure
(1395.9321667001, 22/4/2017).
Funding
This study was a part of a Ph.D. dissertation project in audiology approved and funded by Iran University of Medical Sciences, The International Campus.
Figure 5. Scatter plots of THI (n=33)
Authors' contributions
Conceptualization: Samer Mohsen, Akram Pourbakht, Saeid Mahmoudian; Methodology: Samer Mohsen, Saeed Talebian; Investigation: All authors; Writing-original draft: Samer Mohsen; Writing-review & editing: All authors; Funding Acquisition: Akram Pourbakht, Saeid Mahmoudi-an; Resources: All authors; Supervision: Akram Pourbakht, Saeid Mahmoudian.
Conflict of interest
The authors declared no conflict of interest.
Acknowledgments
This study was part of a PhD. dissertation project in au-diology approved and funded by Iran University of Med-ical Sciences, The International Campus. The authors would like to thank Dr Shohreh Jalaei (Physical Therapy Department, School of Rehabilitation, Tehran University of Medical Sciences, Tehran, Iran) for her statistical ad-vice and also to Abdoreza Asadpour (PhD. candidate in Electrical Engineering, Department of Electrical Engi-neering, Sharif University of Technology, Tehran, Iran) for his technical support.
References
Adamchic, I., Langguth, B., Hauptmann, C., & Tass, P. A. (2014). Abnormal cross-frequency coupling in the tinnitus network. Frontiers in Neuroscience, 8(284), 1-11. [DOI:10.3389/ fnins.2014.00284] [PMID] [PMCID]
Anand, A., Li, Y., Wang, Y., Wu, J., Gao, S., Bukhari, L., et al. (2005). Activity and connectivity of brain mood regulat-ing circuit in depression: A functional magnetic resonance study. Biological Psychiatry, 57(10), 1079-88. [DOI:10.1016/j. biopsych.2005.02.021] [PMID]
Anderson, T. W. (1954). An introduction to multivariate
statis-tical analysis. Retrieved from http://krishikosh.egranth.
ac.in/handle/1/2037567
Andersson, G. (2003). Tinnitus loudness matchings in relation to annoyance and grading of severity. Auris Nasus Larynx, 30(2), 129-33. [DOI:10.1016/S0385-8146(03)00008-7]
Axelsson, A., & Ringdahl, A. (1989). Tinnitus- a study of its prev-alence and characteristics. British Journal of Audiology, 23(1), 53-62. [DOI:10.3109/03005368909077819] [PMID]
Baguley, D. M. (2002). Mechanisms of tinnitus. British Medical
Bulletin, 63(1), 195-212. [DOI:10.1093/bmb/63.1.195] [PMID] Begić, D., Hotujac, L., & Jokić-Begić, N. (2001).
Electroencepha-lographic comparison of veterans with combat-related
post-traumatic stress disorder and healthy subjects. International
Journal of Psychophysiology, 40(2), 167-72. [DOI:10.1016/S0167-8760(00)00153-7]
Bhatt, J. M., Lin, H. W., & Bhattacharyya, N. (2016). Preva-lence, severity, exposures, and treatment patterns of tinnitus in the united states. JAMA Otolaryngology, 142(10), 959-65. [DOI:10.1001/jamaoto.2016.1700] [PMID] [PMCID]
Boggio, P. S., Zaghi, S., & Fregni, F. (2009). Modulation of emotions associated with images of human pain using an-odal Transcranial Direct Current Stimulation (TDCS).
Neu-ropsychologia, 47(1), 212-7. [DOI:10.1016/j.neuropsycholoo-gia.2008.07.022] [PMID]
Chen, Y. C., Bo, F., Xia, W., Liu, S., Wang, P., Su, W., et al. (2017). Amygdala functional disconnection with the prefrontal-cingulate-temporal circuit in chronic tinnitus patients with depressive mood. Progress in Neuro-Psychopharmacology and
Biological Psychiatry, 79(Part. B), 249-57. [DOI:10.1016/j.pnn-pbp.2017.07.001] [PMID]
De Ridder, D. (2011). Phantom perceptions: The analogy be-tween pain and tinnitus. Neuroscience Letters, 500(Supplement), e2. [DOI:10.1016/j.neulet.2011.05.064]
De Ridder, D., Fransen, H., Francois, O., Sunaert, S., Kovacs, S., & Van De Heyning, P. (2006). Amygdalohippocampal involve-ment in tinnitus and auditory memory. Acta
Oto-Laryngolog-ica, 126(suppl. 556), 50-3. [DOI:10.1080/03655230600895580] [PMID]
De Ridder, D., Vanneste, S., Weisz, N., Londero, A., Schlee, W., Elgoyhen, A. B., et al. (2014). An integrative model of audi-tory phantom perception: Tinnitus as a unified percept of interacting separable subnetworks. Neuroscience &
Biobehav-ioral Reviews, 44, 16-32. [DOI:10.1016/j.neubiorev.2013.03.021] [PMID]
Delorme, A., & Makeig, S. (2004). EEGLAB: An open source tool-box for analysis of single-trial EEG dynamics including inde-pendent component analysis. Journal of Neuroscience Methods,
134(1), 9-21. [DOI:10.1016/j.jneumeth.2003.10.009] [PMID] Dierks, T., Jelic, V., Pascual-Marqui, R. D., Wahlund, L., Julin, P.,
Linden, D. E., et al. (2000). Spatial pattern of cerebral glucose metabolism (PET) correlates with localization of intracerebral EEG-generators in Alzheimer’s disease. Clinical
Neurophysiol-ogy, 111(10), 1817-24. [DOI:10.1016/S1388-2457(00)00427-2] Figueiredo, R. R., de Azevedo, A. A., & de Mello Oliveira, P.
(2009). Correlation analysis of the visual-analogue scale and the tinnitus handicap inventory in tinnitus patients.
Brazil-ian Journal of Otorhinolaryngology, 75(1), 76-9. [DOI:10.1016/ S1808-8694(15)30835-1]
Fuchs, M., Kastner, J., Wagner, M., Hawes, S., & Ebersole, J. S. (2002). A standardized boundary element method volume conductor model. Clinical Neurophysiology, 113(5), 702-12. [DOI:10.1016/S1388-2457(02)00030-5]
Hallam, R. S., Rachman, S., & Hinchcliffe, R. (1984). Psychologi-cal aspects of tinnitus. Contributions to MediPsychologi-cal Psychology, 3, 31-53.
Heller, A. J. (2003). Classification and epidemiology of tinni-tus. Otolaryngologic Clinics of North America, 36(2), 239-48. [DOI:10.1016/S0030-6665(02)00160-3]
Henry, J. A., Dennis, K. C., & Schechter, M. A. (2005). General review of tinnitus prevalence, mechanisms, effects, and man-agement. Journal of Speech, Language, and Hearing Research,
48(5), 1204-35. [DOI:10.1044/1092-4388(2005/084)]
Husain, F. T. (2016). Neural networks of tinnitus in humans: Elu-cidating severity and habituation. Hearing Research, 334(Suppl.
C), 37-48. [DOI:10.1016/j.heares.2015.09.010] [PMID] Husain, F. T., Akrofi, K., Carpenter-Thompson, J. R., & Schmidt,
S. A. (2015). Alterations to the attention system in adults with tinnitus are modality specific. Brain Research, 1620(Suppl. C), 81-97. [DOI:10.1016/j.brainres.2015.05.010] [PMID]
Jalali, M. M., Soleimani, R., Fallahi, M., Aghajanpour, M., & Ela-hi, M. (2015). psychometric properties of the persian version of the Tinnitus Handicap Inventory (THI-P). Iranian Journal of
Otorhinolaryngology, 27(79), 83-94. [PMID] [PMCID]
Jasper, H. H. (1958). The ten-twenty electrode system of the International Federation. Electroencephalography and Clinical
Neurophysiology, 10, 370-5. [PMID]
Jastreboff, P. J. (1990). Phantom auditory perception (tinnitus): Mechanisms of generation and perception. Neuroscience
Re-search, 8(4), 221-54. [DOI:10.1016/0168-0102(90)90031-9] Joos, K., Vanneste, S., & De Ridder, D. (2012). Disentangling
depression and distress networks in the tinnitus brain.
PLOS One, 7(7), e40544. [DOI:10.1371/journal.pone.0040544] [PMID] [PMCID]
Kennedy, S. H., Javanmard, M., & Vaccarino, F. J. (1997). A re-view of functional neuroimaging in mood disorders: Positron emission tomography and depression. Canadian Journal of
Psychiatry, 42(5), 467-75. [DOI:10.1177/070674379704200502] [PMID]
Kleinstäuber, M., Frank, I., & Weise, C. (2015). A confirmatory factor analytic validation of the tinnitus handicap inventory.
Journal of Psychosomatic Research, 78(3), 277-84. [DOI:10.1016/j. jpsychores.2014.12.001] [PMID]
Landgrebe, M., Azevedo, A., Baguley, D., Bauer, C., Cacace, A., Coelho, C., et al. (2012). Methodological aspects of clini-cal trials in tinnitus: A proposal for an international standard.
Journal of Psychosomatic Research, 73(2), 112-21. [DOI:10.1016/j. jpsychores.2012.05.002] [PMID] [PMCID]
Langguth, B., Schecklmann, M., Lehner, A., Landgrebe, M., Po-eppl, T. B., Kreuzer, P. M., et al. (2012). Neuroimaging and neuromodulation: Complementary approaches for identify-ing the neuronal correlates of tinnitus. Frontiers in Systems
Neuroscience, 6(15), 1-20. [DOI:10.3389/fnsys.2012.00015] [PMID] [PMCID]
Lanting, C. P., de Kleine, E., & van Dijk, P. (2009). Neural ac-tivity underlying tinnitus generation: Results from PET and fMRI. Hearing Research, 255(1), 1-13. [DOI:10.1016/j. heares.2009.06.009] [PMID]
Leaver, A. M., Seydell-Greenwald, A., Turesky, T., Morgan, S., Kim, H. J., & Rauschecker, J. P. (2012). Cortico-limbic morphol-ogy separates tinnitus from tinnitus distress. Frontiers in
Sys-tems Neuroscience, 6(21), 1-14. [DOI:10.3389/fnsys.2012.00021] [PMID] [PMCID]
Lim, J. J., Lu, P. K., Koh, D. S., & Eng, S. P. (2010). Impact of tin-nitus as measured by the tintin-nitus handicap inventory among tinnitus sufferers in Singapore. Singapore Medical Journal,
51(7), 551-7. [PMID]
Llinás, R. R., Ribary, U., Jeanmonod, D., Kronberg, E., & Mitra, P. P. (1999). Thalamocortical dysrhythmia: A neurological and neuropsychiatric syndrome characterized by magnetoen-cephalography. Proceedings of the National Academy of Sciences
of the United States of America, 96(26), 15222-7. [DOI:10.1073/ pnas.96.26.15222] [PMID] [PMCID]
Lorenz, I., Müller, N., Schlee, W., Hartmann, T., & Weisz, N. (2009). Loss of alpha power is related to increased gamma synchronization- a marker of reduced inhibition in tinni-tus? Neuroscience Letters, 453(3), 225-8. [DOI:10.1016/j.neuu-let.2009.02.028] [PMID]
Mahmoudian, S., Shahmiri, E., Rouzbahani, M., Jafari, Z., Reza Keyhani, M., et al. (2011). Persian language version of the” Tinnitus handicap inventory”: Translation, standardization, validity and reliability. International Tinnitus Journal, 16(2), 93-103. [PMID]
Mazziotta, J., Toga, A., Evans, A., Fox, P., Lancaster, J., Zilles, K., et al. (2001). A probabilistic atlas and reference system for the human brain: International Consortium for Brain Mapping (ICBM). Philosophical Transactions of the Royal Society of London.
Series B, Biological Sciences, 356(1412), 1293-322. [DOI:10.1098/ rstb.2001.0915] [PMID] [PMCID]
McCombe, A., Baguley, D., Coles, R., McKenna, L., McKinney, C., & Windle-Taylor, P. (2001). Guidelines for the grading of tinnitus severity: The results of a working group commis-sioned by the British association of otolaryngologists, head and neck surgeons, 1999. Clinical Otolaryngology, 26(5), 388-93. [DOI:10.1046/j.1365-2273.2001.00490.x] [PMID]
Meyer, M., Neff, P., Grest, A., Hemsley, C., Weidt, S., & Klein-jung, T. (2017). EEG oscillatory power dissociates between distress- and depression-related psychopathology in sub-jective tinnitus. Brain Research, 1663(Suppl. C), 194-204. [DOI:10.1016/j.brainres.2017.03.007] [PMID]
Mirz, F., Gjedde, A., Sødkilde-Jrgensen, H., & Pedersen, C. B. (2000). Functional brain imaging of tinnitus-like perception induced by aversive auditory stimuli. Neuroreport, 11(3), 633-7. [DOI:10.1097/00001756-200002280-00039] [PMID]
Møller, A. R. (2007). Tinnitus: Presence and future. Progress in
Brain Research, 166, 3-16. [DOI:10.1016/S0079-6123(07)66001-4]
Montazeri, A., Vahdaninia, M., Ebrahimi, M., & Jarvandi, S. (2003). The Hospital Anxiety and Depression Scale (HADS): Translation and validation study of the Iranian version.
Health and Quality of Life Outcomes, 1, 14. [DOI:10.1186/1477-7525-1-19] [PMID] [PMCID]
Monzani, D., Genovese, E., Marrara, A., Gherpelli, C., Pingani, L., Forghieri, M., et al. (2008). Validity of the Italian adaptation of the Tinnitus Handicap Inventory; focus on quality of life and psychological distress in tinnitus-sufferers. Acta
Otorhi-nolaryngologica Italica, 28(3), 126-34. [PMID] [PMCID] Moossavi, A., & Mohsen, S. (2016). Noninvasive
neuromodu-lation of tinnitus with transcranial current stimuneuromodu-lation tech-niques with insight into neurobiology and neuroimaging.
Mulert, C., Jäger, L., Schmitt, R., Bussfeld, P., Pogarell, O., Möller, H. J., et al. (2004). Integration of fMRI and simultaneous EEG: Towards a comprehensive understanding of localization and time-course of brain activity in target detection. NeuroImage,
22(1), 83-94. [DOI:10.1016/j.neuroimage.2003.10.051] [PMID] Newman, C. W., Jacobson, G. P., & Spitzer, J. B. (1996). Devel-opment of the Tinnitus handicap inventory. Archives of
Oto-laryngology-Head & Neck Surgery, 122(2), 143-8. [DOI:10.1001/ archotol.1996.01890140029007]
Newman, C. W., Sandridge, S. A., & Jacobson, G. P. (1998). Psychometric adequacy of the Tinnitus Handicap Inventory (THI) for evaluating treatment outcome. Journal of the
Ameri-can Academy of Audiology, 9(2), 153-60. [PMID]
Nooruzian, M., Jafari, Z., Shahmiri, E., Omidvar, S., Zendehbad, A., Amini, N., et al. (2017). Effect of age, gender and hearing loss on the degree of discomfort due to tinnitus. Basic and
Clin-ical Neuroscience, 8(6), 435-42. [DOI:10.29252/nirp.bcn.8.6.435] [PMID] [PMCID]
Pascual-Marqui, R. D. (2002). Standardized low-Resolution Brain Electromagnetic Tomography (sLORETA): Technical details. Methods and Findings in Experimental and Clinical
Phar-macology, 24(Suppl. D), 5-12. [PMID]
Pascual-Marqui, R. D. (2007a). Discrete, 3D distributed, linear imaging methods of electric neuronal activity. Part 1: Exact,
zero error localization. Retrieved from http://arxiv.org/
abs/0710.3341
Pascual-Marqui, R. D. (2007b). Instantaneous and lagged measurements of linear and nonlinear dependence between groups of multivariate time series: Frequency decomposition.
Retrieved from http://arxiv.org/abs/0711.1455
Pascual-Marqui, R. D., Esslen, M., Kochi, K., & Lehmann, D. (2002). Functional imaging with Low-Resolution Brain Elec-tromagnetic Tomography (LORETA): A review. Methods and
Findings in Experimental and Clinical Pharmacology, 24(Suppl. C), 91-5. [PMID]
Price, D. D. (2000). Psychological and neural mechanisms of the affective dimension of pain. Science, 288(5472), 1769-72. [DOI:10.1126/science.288.5472.1769] [PMID]
Price, D. D., McGrath, P. A., Rafii, A., & Buckingham, B. (1983). The validation of visual analogue scales as ratio scale meas-ures for chronic and experimental pain. Pain, 17(1), 45-56. [DOI:10.1016/0304-3959(83)90126-4]
Ridder, D. D., Vanneste, S., & Congedo, M. (2011). The distressed brain: A group blind source separation analysis on tinnitus.
PLOS One, 6(10), e24273. [DOI:10.1371/journal.pone.0024273] [PMID] [PMCID]
Salviati, M., Macrì, F., Terlizzi, S., Melcore, C., Provenzano, A., Capparelli, E., et al. (2013). The tinnitus handicap inven-tory as a screening test for psychiatric comorbidity in patients with tinnitus. Psychosomatics, 54(3), 248-56. [DOI:10.1016/j. psym.2012.05.007] [PMID]
Sanchez, L. (2004). The epidemiology of tinnitus. Audiological
Medicine, 2(1), 8-17. [DOI:10.1080/16513860410027781] Schlee, W., Mueller, N., Hartmann, T., Keil, J., Lorenz, I., &
Weisz, N. (2009). Mapping cortical hubs in tinnitus. BMC
Biol-ogy, 7, 80. [DOI:10.1186/1741-7007-7-80] [PMID] [PMCID]
Schmidt, S. A., Carpenter-Thompson, J., & Husain, F. T. (2017). Connectivity of precuneus to the default mode and dorsal at-tention networks: A possible invariant marker of long-term tinnitus. NeuroImage: Clinical, 16, 196-204. [DOI:10.1016/j. nicl.2017.07.015] [PMID] [PMCID]
Schmidt, S. A., Zimmerman, B., Bido Medina, R. O., Carpenter-Thompson, J. R., & Husain, F. T. (2018). Changes in gray and white matter in subgroups within the tinnitus population.
Brain Research, 1679(Suppl. C), 64-74. [DOI:10.1016/j.brainn-res.2017.11.012] [PMID]
Sindhusake, D., Golding, M., Newall, P., Rubin, G., Jakobsen, K., & Mitchell, P. (2003). Risk factors for tinnitus in a population of older adults: The blue mountains hearing study. Ear and
Hear-ing, 24(6), 501-7. [DOI:10.1097/01.AUD.0000100204.08771.3D] [PMID]
Snaith, R. P. (2003). The Hospital Anxiety And Depression Scale.
Health and Quality of Life Outcomes, 1, 29. [DOI:10.1186/1477-7525-1-29] [PMID] [PMCID]
Song, J. J., De Ridder, D., Schlee, W., Van de Heyning, P., & Vanneste, S. (2013a). “Distressed aging”: The differences in brain activity between early- and late-onset tinnitus.
Neu-robiology of Aging, 34(7), 1853-63. [DOI:10.1016/j.neurobioo-laging.2013.01.014] [PMID]
Takahashi, M., Kabaya, K., Sekiya, K., Matsuda, F., Sekiya, Y., Esaki, S., et al. (2018). An improved system for grad-ing and treatgrad-ing tinnitus. Auris Nasus Larynx, 45(4), 711-7. [DOI:10.1016/j.anl.2017.11.012] [PMID]
van der Loo, E., Congedo, M., Vanneste, S., De Heyning, P. V., & De Ridder, D. (2011). Insular lateralization in tinnitus dis-tress. Autonomic Neuroscience, 165(2), 191-4. [DOI:10.1016/j. autneu.2011.06.007] [PMID]
Vanneste, S., Joos, K., Ost, J., & De Ridder, D. (2018). Influenc-ing connectivity and cross-frequency couplInfluenc-ing by real-time source localized neurofeedback of the posterior cingulate cor-tex reduces tinnitus related distress. Neurobiology of Stress, 8, 211-24. [DOI:10.1016/j.ynstr.2016.11.003]
Vanneste, S., Plazier, M., Van Der Loo, E., Van de Heyning, P., Congedo, M., & De Ridder, D. (2010). The neural corre-lates of tinnitus-related distress. Neuroimage, 52(2), 470-80. [DOI:10.1016/j.neuroimage.2010.04.029] [PMID]
Vanneste, S., Plazier, M., Van Der Loo, E., Van de Heyning, P., Congedo, M., & De Ridder, D. (2010). The neural corre-lates of tinnitus-related distress. Neuroimage, 52(2), 470-80. [DOI:10.1016/j.neuroimage.2010.04.029] [PMID]
Vitacco, D., Brandeis, D., Pascual-Marqui, R., & Martin, E. (2002). Correspondence of event-related potential tomography and functional magnetic resonance imaging during language processing. Human Brain Mapping, 17(1), 4-12. [DOI:10.1002/ hbm.10038] [PMID]
Wagner, M., Fuchs, M., & Kastner, J. (2004). Evalua-tion of sLORETA in the presence of noise and multiple sources. Brain Topography, 16(4), 277-80. [DOI:10.1023/ B:BRAT.0000032865.58382.62] [PMID]
Westin, V., Hayes, S. C., & Andersson, G. (2008). Is it the sound or your relationship to it? The role of acceptance in predicting tinnitus impact. Behaviour Research and Therapy, 46(12), 1259-65. [DOI:10.1016/j.brat.2008.08.008] [PMID]
Worrell, G. A., Lagerlund, T. D., Sharbrough, F. W., Brinkmann, B. H., Busacker, N. E., Cicora, K. M., et al. (2000). Localization of the epileptic focus by low-resolution electromagnetic tomog-raphy in patients with a lesion demonstrated by MRI. Brain
Topography, 12(4), 273-82. [DOI:10.1023/A:1023407521772] [PMID]
Zumsteg, D., Wennberg, R. A., Treyer, V., Buck, A., & Wieser, H. G. (2005). H2(15)O or 13NH3 PET and electromagnetic tomog-raphy (LORETA) during partial status epilepticus. Neurology,