www.earth-syst-sci-data.net/8/265/2016/ doi:10.5194/essd-8-265-2016
© Author(s) 2016. CC Attribution 3.0 License.
Coastline evolution of Portuguese low-lying sandy coast
in the last 50 years: an integrated approach
Cristina Ponte Lira, Ana Nobre Silva, Rui Taborda, and Cesar Freire de Andrade
IDL – Instituto Dom Luiz, Faculdade de Ciências da Universidade de Lisboa, Campo Grande, 1749-016 Lisbon, Portugal
Correspondence to:Cristina Ponte Lira ([email protected])
Received: 5 February 2016 – Published in Earth Syst. Sci. Data Discuss.: 21 March 2016 Revised: 19 May 2016 – Accepted: 30 May 2016 – Published: 14 June 2016
Abstract. Regional/national-scale information on coastline rates of change and trends is extremely valuable, but these studies are scarce. A widely accepted standardized methodology for analysing long-term coastline change has been difficult to achieve, but it is essential to conduct an integrated and holistic approach to coast-line evolution and hence support coastal management actions. Additionally, databases providing knowledge on coastline evolution are of key importance to support both coastal management experts and users.
The main objective of this work is to present the first systematic, national-scale and consistent long-term coastline evolution data of Portuguese mainland low-lying sandy coasts.
The methodology used quantifies coastline evolution using a unique and robust coastline indicator (the fore-dune toe), which is independent of short-term changes.
The dataset presented comprises (1) two polyline sets, mapping the 1958 and 2010 sandy beach–dune system coastline, both optimized for working at 1:50 000 scale or smaller; (2) one polyline set representing long-term change rates between 1958 and 2010, each estimated at 250 m; and (3) a table with minimum, maximum and mean of evolution rates for sandy beach–dune system coastline. All science data produced here are openly accessible at https://doi.pangaea.de/10.1594/PANGAEA.859136 and can be used in other studies.
Results show beach erosion as the dominant trend, with a mean change rate of−0.24±0.01 m year−1for all
mainland Portuguese beach–dune systems. Although erosion is dominant, this evolution is variable in signal and magnitude in different coastal sediment cells and also within each cell. The most relevant beach erosion issues were found in the coastal stretches of Espinho–Torreira and Costa Nova–Praia de Mira, Cova da Gala–Leirosa, and Cova do Vapor–Costa da Caparica. The coastal segments Minho River–Nazaré and Costa da Caparica ad-jacent to the coast exhibit a history of major human interventions interfering with the coastal system, many of which originated and maintained a sediment deficit. In contrast, the coastal segments Troia–Sines and Sines– Cape S. Vicente have experienced less intervention and show stable or moderate accretion behaviour.
1 Introduction
The coastal zone is intrinsically dynamic, where changes occur at different temporal and spatial scales. Along any sandy coastal stretch, changes in coastline position (erosion or accretion) are expected and occur in response to varia-tions in sea level, sediment budget and hydrodynamic condi-tions. As human activities and occupation grow in coastal areas, management problems and challenges also increase as a result of needing to accommodate both coastal change
The idea that coastlines are under threat by climate change acceleration is relatively recent (Carter and Woodroffe, 1994) and has increased the demand for accurate knowledge on coastal evolution. This encouraged the development of nu-merous long-term (>30 years according to Fletcher et al., 2012) studies worldwide which, in most cases, lack the broader scale perspective, instead evaluating change at mi-cro/meso spatial scales and generally focusing only on known problematic areas.
Pioneer studies considering a national-scale approach to coastline change were promoted in the USA and Europe in the early 21st century by the USGS (United States Geolog-ical Survey) (USGS, 2004) and the European Commission (European Commission, 2004). The United States launched the National Assessment of Coastline Change Project, which delivered a number of reports organized by coastal regions (e.g. Fletcher et al., 2012). The European counterpart is the EUROSION project framework (European Commission, 2004), which conducted a country-by-country evaluation of coastal erosion at the European scale and delivered three main final products: (1) online reports, including major find-ings and recommendations; (2) a GIS database, which in-cludes Europe’s coastline vectors at 1:100 000 scale; and (3) a coastline management guide.
Despite this effort, there is still no consensual coastline definition for reporting coastal evolution at national to global scale or to ensure comparability between datasets. Therefore, most of the coastline evolution works are still not adequate for inter-comparison. This fact is even more striking as the 2012 European Environment Agency (EEA) report on cli-mate change (EEA, 2012) does not include coastline position as an EEA indicator on threats to the coastal zone, because regular updates of this type of information are not expected.
In Portugal, coastline evolution studies are usually local to mesoscale in their spatial scope and essentially focus on problematic areas (e.g. Abecassis et al., 1970; Barceló, 1971; Castanho et al., 1974; Bettencourt and Ângelo, 1992; Fer-reira, 1992; Oliveira, 2005; Pinto and Teixeira, 2005; Veloso-Gomes et al., 2009; Taveira Pinto et al., 2009; Rebêlo et al., 2011; Silva et al., 2013), and different coastline proxies are used (e.g. European Commission, 2004; Oliveira, 2005; Fer-reira et al., 2006; Rebêlo et al., 2011; Cenci et al., 2013). Thus, these analyses can not provide a complete and unified approach for all of the Portuguese territory.
From the above, one may conclude that an approach using metrics that are consistent from one coastal zone to another is essential to address coastal evolution in an integrated and holistic manner. A single and robust coastal indicator capable of representing long-term change is indispensable and should be evaluated at a national and broader scale.
This work aims at presenting the first systematic, national-scale and consistent long-term coastline evolution study of Portuguese mainland low-lying sandy coast. Coastline evo-lution is quantified using a single robust coastline indicator (foredune toe), which is, to a larger extent, independent of
short-term morphodynamic changes. The coastline and evo-lution data are fully and freely available at http://doi.pangaea. de/10.1594/PANGAEA.853654 and can be used in other studies. This dataset comprises (1) two polyline sets, map-ping the 1958 and 2010 sandy beach–dune system coastline, both optimized for working at 1:50 000 scale or smaller, and (2) one polyline set representing long-term change rates be-tween 1958 and 2010, each estimated at 250 m.
2 Study area
The Portuguese mainland coastline extends south from the Minho River to west of the Guadiana river mouth (Fig. 1) along ca. 900 km (variable with the scale of representation). The coast includes a wide range of morpho-sedimentary en-vironments, such as beaches, cliffs, estuaries, lagoons and barrier islands (Andrade and Freitas, 2002; Ferreira and Ma-tias, 2013). Coastal districts house around three-quarters of the population and generate around 80 % of the gross na-tional product (Duarte Santos et al., 2014b), with increasing economic activity in these areas, especially from tourism.
Tides along the Portuguese coast are semi-diurnal and meso-tidal and are unimportant to coastal processes ex-cept in the vicinity of inlets and tide-dominant basins (An-drade and Freitas, 2002). According to An(An-drade and Fre-itas (2002), Portuguese western- and southern-facing coasts present asymmetric characteristics regarding wave energy and wave climate. The western coast is fully exposed to the dominant NW high-energy swells (Andrade and Freitas, 2002). The south-facing coastal stretches are sheltered from the dominant waves, resulting in a milder wave regime (Fer-reira and Matias, 2013). The high-energetic wave regime at the western coast induces a net potential littoral drift di-rected southward that can reach up to 106m3year−1. This
potential falls one or more orders of magnitude in linear coastal stretches that are rotated somewhat clockwise, along equilibrium arcuate embayments, and in sections sheltered from the prevailing NW waves; in these cases the residual drift may be annulled or even reversed in direction (Andrade and Freitas, 2002). At the south coast of Portugal, dominant waves drive an easterly directed littoral drift of ca. 104 to 105m3year−1, depending upon coastal orientation (Ferreira and Matias, 2013); exceptions are NW/SW coastal ribbons that face the prevailing swell and show almost null residues of longshore power and drift (Andrade and Freitas, 2002).
2.1 Sediment cells
Figure 1.Sediment cells for the Portuguese mainland coast (cell limits in red) and coastal characterization.
The works of Andrade and Freitas (2002) and later of Duarte Santos et al. (2014a) defined and characterized eight sediment cells (Fig. 1) along the Portuguese mainland lit-toral, according to its geomorphological characteristics and sedimentary dynamics:
– Cell 1 – Minho river mouth to Nazaré. This cell is di-vided into three sub-cells: from the Minho to Douro rivers (sub-cell 1a), from Douro River to Cape Mon-dego (1b) and from Cape MonMon-dego to Nazaré (sub-cell 1c).
– Sub-cell 1ais characterized by a low rocky coast, with numerous small sandy and gravel beaches (which are sometimes extensive), whose development is strongly
associated with local sheltering effects in the first case and river estuaries in the latter. The low-lying sandy coast accounts for 50 % of the total coastal stretch.
– Sub-cell 1bcoastline presents geomorphological char-acteristics similar to cell 1a at the north, and further south it essentially consists of an extensive linear beach, backed by coastal dune systems and only interrupted by the Aveiro inlet. The southernmost section is mainly constituted by cliffs and sandy beaches. Beach–dune systems represent 75 % of this sector’s total length.
Figueira da Foz’s northern jetty. This sediment reten-tion induced downdrift coastline retreat, which led to the construction of rigid structures, to the south of the port of Figueira da Foz (Duarte Santos et al., 2014a). Further south the coast is low, sandy and straight, cul-minating in cliffs bordered by narrow beaches, which extend until the area of Nazaré. In this sector, 72 % of the beaches are backed by dunes.
– Cell 2 – Nazaré to Peniche, which mainly consists of cliffs bordered by rocky platforms to the north of Óbidos lagoon and generally narrow linear beaches to the south, accounts for only 25 % of the entire coastal sector.
– Cell 3 – Peniche to Cape Raso. This section is dom-inated by cliffs presenting numerous pocket beaches, with very different geometry. The wider and short beaches are often limited by small dune fields and de-veloped next to stream mouths, whereas linear and nar-row beaches lacking dunes, sometimes to the extent of kilometres, are associated with the existence of natural headlands that provide limited sediment retention. This sector has one of the lowest percentages of beach–dune systems, a mere 6 %.
– Cell 4 – Cape Raso to Cape Espichel. In terms of its geomorphological characteristics, this cell can be di-vided into two distinct sectors, separated by the Tagus river mouth. Northwest of the Tagus estuary the coast is dominated by cliffs, with a set of small embedded beaches, which are limited landward by cliffs or arti-ficial structures and sheltered from the dominant NW wave regime. South of the Tagus, the coast adopts an arched configuration, suggesting an equilibrium bay, forming a continuous sandy coast from Costa da Ca-parica to Bicas. Further south, until Cape Espichel, the coastline mainly develops in cliffs, occasionally inter-rupted by small sandy or gravelly pocket beaches. Half of the sector (50 %) is represented by beach–dune sys-tems.
– Cell 5 – Cape Espichel to Sines. The coast between Cape Espichel and Sado inlet is sheltered from the pre-vailing wave regime and only a few pocket beaches exist in indentations affecting the rocky plunging cliffs of the Arrábida chain. Between the Troia peninsula and Sines, it is a continuous sandy coast, with an arched configura-tion, similar to that observed in the Caparica–Espichel section. The beach is bordered by dunes in most of the sector, mainly north of Medronheiro; south of this point, cliffs occur until the Melides lagoon and, occasionally, between the Sancha lagoon and Moinhos stream. In this sector, 54 % of the coast is represented by low-lying sandy beaches.
– Cell 6– Sines to Cape S. Vicente. This stretch is dom-inated by cliffs (generally high) carved into resistant Palaeozoic and Mesozoic rocks. These cliffs are dis-rupted by the Mira, Odeceixe and Aljezur estuaries and lowlands, which, together with cliff indentations, ac-commodate sandy and gravelly beaches, usually with reduced width. The beaches developed on larger stream mouths are often backed by dune systems. Together with cell 3, this sector presents a small percentage (3 %) of beach–dune systems.
– Cell 7– between Cape S. Vicente and Olhos de Água. This cell is characterized by an extremely varied mor-phology, where cliff segments alternate with beaches confined between resistant headlands or developed at stream mouths and in barriers separating small la-goons/estuaries from the open ocean. From Lagos to Ol-hos de Água the coast is extremely crenulated. The bays of Lagos and Armação de Pera include dune systems of significant size. In this cell, 12 % of the coastline be-longs to the beach–dune system geomorphological type.
– Cell 8 – from Olhos de Água to the Guadiana river mouth. The coastline is mainly dominated by a bar-rier island system (Ria Formosa) and the Manta Rota– Vila Real de Santo António coastal plain. The west-ern end, between Olhos de Água and Garrão, is com-prised of a sandy beach bordered by cliffs. The barrier island system, which separates the sea from the second, larger Portuguese lagoon, includes (from west to east) two peninsulas (Ancão and Cacela), five barrier islands (Barreta, Culatra, Armona, Tavira and Cabanas) and six tidal inlets (Ancão, Faro-Olhão, Armona, Fuseta, Tavira and Cacela inlets). In total, 66 % of this sector’s beaches are backed by dunes.
3 Methods
3.1 Beach coastline indicator
In coastal evolution studies the selection of a suitable coast-line definition is a primary issue. Long-term studies, such as the one presented, are based on discrete measurements that represent snapshots of the coastal system, usually separated by a large temporal gap. To obtain an unbiased measure of coastal evolution, the measurements should, therefore, be as independent as possible of both high-frequency water level changes and the seasonal beach morphological cycle.
“true” coastline position. Coastline indicators may be phys-ical coastal features such as the bluff top/cliff top, landward edge of shore protection structure, foredune toe and seaward vegetation line. Considering that this study targets low-lying sandy coasts backed by dunes, the coastline indicator used in this study was the foredune toe, and recognized as the morphological feature less affected by short-term (tidal) and medium-term (seasonal) changes (e.g. Komar et al., 2001; Ferreira et al., 2006; Del Río and Gracia, 2013).
The foredune toe indicator is described by either a slope break or the seaward limit of vegetation. The latter crite-rion was only used when the first was not clearly recog-nized. In cases where the beach is not backed by a dune (e.g. overwashed sections of sandy barriers, extensive blowouts in the back beach) the aforementioned indicator could not be mapped. These situations constitute a limitation of the pro-posed methodology, and other methods should be used when analysing other geomorphological coastal types. Neverthe-less, using this method it was possible to map 92 and 95 % of all the low-lying sandy coast of mainland Portugal for the years 1958 and 2010, respectively. The shoreline evolution assessment was conducted for 84 % of the sandy coast, where the information from both coastlines overlaps.
3.2 Coastline mapping 3.2.1 Data sources
Two sets of data were used in the coastline extraction proce-dure:
1. digital aerial photographs from the USAF 1958 flight (photos taken on different days and no flight plan was available to the authors) with 0.5 m pixel resolution;
2. digital orthophotomaps of the year 2010 (IGEO, 2010) (photos taken on different days of 2010) with 0.2 m pixel resolution.
3.2.2 Mapping procedures
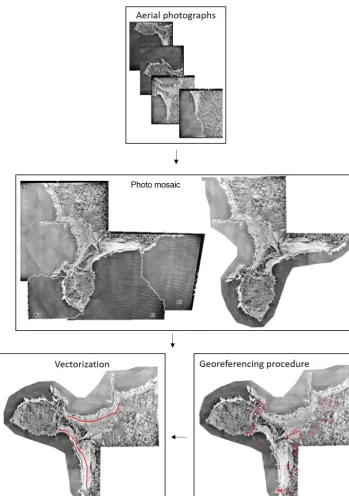
Due to the unrectified nature of the 1958 aerial photographs, images were georeferenced using the 2010 orthophotomaps. The georeferencing procedure, consisting in the coordination of points on the image to be georeferenced with points on a geographically referenced dataset, was conducted according to Fig. 2 in a GIS environment. The individual photos were grouped into mosaics covering continuous sandy coastal ar-eas. A total of 158 photos were used to produce 56 mosaics, using the Photomerge capability of Photoshop®. This proce-dure finds the optimal borders between the images and cre-ates seams based on those borders, requiring an image over-lapping of 40 to 70 %. Mosaicking minimizes misalignments, which are especially visible in borders of two contiguous im-ages (Wan et al., 2013); the main advantim-ages of this include image spatial continuity, allowing for coastline location on
longer coastal stretches and facilitating the search for com-mon ground control points (GPCs) (Verhoeven et al., 2012).
Mosaics were georeferenced using GCPs that corre-sponded to common elements in both datasets, evenly dis-tributed along the coastline. Between 5 and 10 GCPs per kilometre of coastline were used, accounting for availabil-ity of common elements, mosaicking distortions and terrain elevation. The georeferencing was based on aspline adjust-ment method (a piecewise polynomial that maintains conti-nuity and smoothness between adjacent polynomials).
The work of Rocchini and Di Rita (2005) showed that geo-referencing by polynomial fit is a very robust tool in flat ar-eas, with performance similar to that obtained by orthorecti-fication, reporting significant increases in the error as terrain becomes more rugged. In this present work an independent study for accuracy assessment related to the georeferencing process and coastline vectorization was also conducted. Re-sults from this evaluation will be used in the uncertainty as-sessment of coastline rates and are presented in the next sec-tion.
The coastline digitization process, which consisted in manually recognizing and digitizing the coastline indicator on the images, was conducted using a ranging visualization scale between 1:5000 and 1:8000. The coastline final po-sition segments, for both analysed dates, were optimized for working at a 1:50 000 scale or smaller.
3.3 Coastline evolution
Coastline evolution rates of change (R) were calculated in a GIS environment using the Digital Shoreline Analysis Sys-tem (Thieler et al., 2009) and the Coastline Change Mapper (Psuty et al., 2010), both ArcGIS extensions. Transects were placed every 250 m, roughly perpendicular to the coastline trend. Rate-of-change results were grouped together along the same littoral cell and maximum (Max(R)), mean (R¯) and minimum (Min(R)) rates were assessed for each one. Results are presented for the overall sandy beach–dune system coast-line as well.
3.3.1 Position and rate uncertainty
Several sources of error affect the accuracy of coastline posi-tion and consequently coastline change rates. Measurement uncertainties include errors related to coastline digitization (Ed) (Fletcher et al., 2003), image resolution (Eir) (Coyne et
al., 1999; Catalão et al., 2002) and image rectification (Er)
(Shoshany et al., 1996; Fletcher et al., 2003).
According to Fletcher et al. (2003) these errors are random and uncorrelated and can be represented by a single measure (Up) calculated as the square root of the sum of the squares
(Coyne et al., 1999; Fletcher et al., 2003):
Up= q
Ed2+E2
Figure 2.Flowchart procedures for using aerial photographs to extract coastline indicators.
Fletcher et al. (2003) state another physical component of error, representing short-term variability in coastline po-sition. In this study, these sources of error were eliminated by adopting the foredune shoreward edge approach, in ac-cordance with other works (e.g. Del Río and Gracia, 2013).
The uncertainty related to the georeferencing procedures (Er) of 1958 aerial photos was evaluated using three
mo-saics, depicting different geomorphological settings. Valida-tion with an independent subset of control points (10 % of the original GCPs) was used to assess the root-mean-square
error (RMSE) for each mosaic. This process ensures an in-dependent evaluation of the georeferencing errors that was considered representative of all other mosaics. Results show a maximum RMSE of 4.79 m for all three mosaics; hence,Er
was considered to be 5 m. Uncertainties related to the vector-ization process of the coastline indicator (Ed), which were
digitized by three different operators, resulted in a 7 m error. Image resolution is 0.5 m (Eir). Thus,Up1958was estimated
In a similar way to the aerial photos, the uncertainties re-lated to the use of orthophotomaps were estimated asEr=0,
due to its rectified nature, and Ed=5 m and Eir=0.2 m.
Therefore,Up2010was estimated as 5.0 m.
The coastline change rate uncertainty (UR) is calculated,
according to Fletcher et al. (2012), by using the uncertainty values for both coastlines (Up1958andUp2010) and the time
frame (t) between them:
UR=
q
Up21958+Up22010
t . (2)
In this work, the uncertainty affecting coastline change rate was calculated as±0.2 m year−1, for the 52-year period of analysis.
The uncertainty of a mean rate can be calculated, accord-ing to Fletcher et al. (2012), as the root sum of squares of rate uncertainties (UR) at all transects divided by their total
number (n):
UR¯= q
Pi=1
n UR,i2
n . (3)
UR¯ was evaluated for each individual sediment cell taking
into account the number of transects in each one, and the same procedure was applied to all low-lying sandy coastline of mainland Portugal.UR¯ values are shown in Table 1.
4 Results and discussion
The coastline evolution dataset comprises (1) two coastlines, an older one dated 1958 and a modern one dated 2010, and (2) long-term change rates between 1958 and 2010, which were estimated at a 250 m interval assuming a linear rate of change. All science data are available as polylines and is openly accessible at http://doi.pangaea.de/10.1594/ PANGAEA.853654. These results have also been incorpo-rated as an update of the EUROSION project information on low-lying sandy coastal ribbons of mainland Portugal, in col-laboration with the IPMA (Instituto do Mar e da Atmosfera) agency and the EMODnet project Portuguese partner for the geology section (EMODnet, 2009). The dataset was incorpo-rated into the “Coastal Migration Map – Coastal Behaviour for all European countries” dataset and is currently avail-able for visualization at http://194.66.252.216/geonetwork/ srv/por/catalog.map (last access: May 2016).
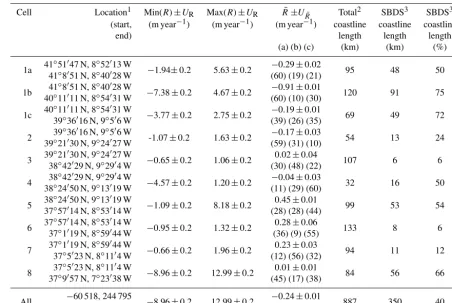
Table 1 shows maximum, minimum and mean coastline evolution rates found in each sediment cell and for the to-tal coastline of mainland Portugal and is openly accessible at https://doi.pangaea.de/10.1594/PANGAEA.859135. The to-tal length occupied by sandy beach–dune systems corre-sponds to ca. 40 % of the total mainland Portuguese coast-line.
Sub-cell 1a presents an erosion maximum of
−1.84±0.2 m year−1, mainly to the south of the Lima
Figure 3.Long-term coastline rates of change in metres per year for sediment sub-cells 1a and 1b.
estuary. An accretion maximum of+5.83±0.2 m year−1is reached next to the same river mouth, due to interference of both harbour jetties in sediment transport patterns. The mean rate of change is−0.29±0.02 m year−1, showing an erosive trend (Fig. 3). According to Duarte Santos et al. (2014a) this pattern is related to the reduction in river sediment supply and harbour dredging.
Table 1.Minimum (Min(R)), maximum (Max(R)) and mean (R¯) of evolution rates (R) for sandy beach–dune systems (SBDS) coastline. Total coastline length (km) and SBDS coastline length (in km and in percentage). All values are presented for each sediment cell and for all mainland Portugal SBDS coastline. Values in parentheses depict (a) % of transects withR6−0.2, (b) % of transects with−0.2< R <0.2 and (c) % of transects withR>−0.2.
Cell Location1 Min(R)±UR Max(R)±UR R¯±UR¯ Total2 SBDS3 SBDS3
(start, (m year−1) (m year−1) (m year−1) coastline coastline coastline
end) length length length
(a) (b) (c) (km) (km) (%)
1a 41
◦
51047 N, 8◦52013 W
−1.94±0.2 5.63±0.2 −0.29±0.02 95 48 50 41◦8051 N, 8◦40028 W (60) (19) (21)
1b 41
◦8051 N, 8◦40028 W
−7.38±0.2 4.67±0.2 −0.91±0.01 120 91 75 40◦11011 N, 8◦54031 W (60) (10) (30)
1c 40
◦11011 N, 8◦54031 W
−3.77±0.2 2.75±0.2 −0.19±0.01 69 49 72 39◦36016 N, 9◦506 W (39) (26) (35)
2 39
◦36016 N, 9◦506 W
-1.07±0.2 1.63±0.2 −0.17±0.03 54 13 24 39◦21030 N, 9◦24027 W (59) (31) (10)
3 39
◦21030 N, 9◦24027 W
−0.65±0.2 1.06±0.2 0.02±0.04 107 6 6 38◦42029 N, 9◦2904 W (30) (48) (22)
4 38
◦42029 N, 9◦2904 W
−4.57±0.2 1.20±0.2 −0.04±0.03 32 16 50 38◦24050 N, 9◦13019 W (11) (29) (60)
5 38
◦
24050 N, 9◦13019 W
−1.09±0.2 8.18±0.2 0.45±0.01 99 53 54 37◦57014 N, 8◦53014 W (28) (28) (44)
6 37
◦
57014 N, 8◦53014 W
−0.95±0.2 1.32±0.2 0.28±0.06 133 8 6 37◦1019 N, 8◦59044 W (36) (9) (55)
7 37
◦
1019 N, 8◦59044 W
−0.66±0.2 1.96±0.2 0.23±0.03 94 11 12 37◦5023 N, 8◦1104 W (12) (56) (32)
8 37
◦5023 N, 8◦1104 W
−8.96±0.2 12.99±0.2 0.01±0.01 84 56 66 37◦9057 N, 7◦23038 W (45) (17) (38)
All −60 518, 244 795 −8.96±0.2 12.99±0.2 −0.24±0.01 887 350 40
64 870,−277 252 (46) (20) (34)
1Latitude, longitude in ETRS 89.2Total coastline length was estimated using the available EUROSION coastline (European Commission, 2004) for the Portuguese mainland littoral.3SBDS coastline length was calculated using the proposed 2010 coastline.
concerning the erosion risk in Portugal (Duarte Santos et al., 2014a).
In sub-cell 1c, erosion is mainly concentrated in its north-ern section, up to about 20 km to the south of the Mondego river mouth, in relation to harbour development works, in-cluding dredging and jetties. Here the retreat rates locally reach a maximum of −3.77±0.2 m year−1 at Lavos. Fur-ther south, accretion dominates, reaching a maximum of +1.39±0.2 m year−1in the vicinity and updrift of Nazaré, related with sediment retention by a rocky headland. Mean coastline rates of change indicates a general erosional trend, with a value of−0.34±0.01 m year−1(Fig. 4).
Cell 2 presents a set of five discontinuous sandy beach–dune systems with a mean evolution rate of −0.17±0.03 m year−1. Erosional coastal stretches are found at Nazaré–Salgados, Cova da Areia and the Baleal embay-ment, east of Peniche. Accretion was detected in São Mart-inho do Porto bay and the Óbidos sand barrier, with a maxi-mum of+1.63±0.2 m year−1in the former case (Fig. 4).
Cell 3 shows rare beach–dune systems confined to coast-line indentations in relation to small river mouths. The
sig-nal and rate of change are site-specific, with erosion at Con-solação, Ponta da Lamporeira and Guincho (north of Cape Raso) (−0.49, −0.22 and −0.65±0.2 m year−1,
respec-tively), and accretion at Areia Branca, Santa Rita and Ponta da Lamporeira (+0.74, +1.06 and +0.23±0.2 m year−1, respectively) (Fig. 4). The mean coastline rate of change (+0.02±0.04 m year−1) is within the method uncertainty, indicating non-significant long-term evolution. This result is compatible with negligible anthropogenic influence in sedi-ment supply; thus, the measured changes essentially reflect the coastal system’s natural variability.
Figure 4.Long-term coastline rates of change in metres per year for sediment sub-cell 1c and cells 2 and 3. Note: the sub-cell 1c coast is shown with a 15◦rotation.
1958 photographs precluded the coastline indicators iden-tification, coastal change was not measured. In this sector, two contrasting trends were found: (1) an intense erosional trend with a maximum of−4.57±0.2 m year−1, to the south and next to the Tagus river mouth, north of Costa da Ca-parica, and (2) south of Costa da CaCa-parica, a mild accre-tional trend alternating with stable stretches, reaching a max-imum of +1.20±0.2 m year−1 at Meco (Fig. 5). Globally, this sector presents a slight erosive trend with a mean rate of −0.04±0.03 m year−1, despite the strong erosive tendency north of Costa da Caparica. The erosional process north of Costa da Caparica was aggravated in the second quarter of the 20th century due to sand deficit in relation to intensive dredging; in response, a seawall and a groyne field were built (Appendix I – Duarte Santos et al., 2014a). More recently the beaches were the object of artificial nourishment (Appendix VI – Duarte Santos et al., 2014a). Coastal retreat rates re-ported here would have been higher in the absence of beach nourishment.
Figure 5.Long-term coastline rates of change in metres per year for sediment cells 4, 5 and 6.
The geomorphological settings of cells 5 and 4 are broadly homothetic, but the intensity and spatial distribu-tion of erosion/accredistribu-tion rates are different. In cell 5, the northern tip of the Troia sand spit presents the largest accretion trend (+8.18±0.2 m year−1). The erosion max-imum, located immediately to the south of the accre-tion area, is −1.09±0.2 m year−1 (Fig. 5). In this sec-tor, mean coastline rates of change reveals the highest ac-cretional trend for all sediment cells in mainland Portugal (+0.45±0.01 m year−1).
Cell 6, which presents geomorphological similarities with cell 3, shows both the maximum erosive trend (−0.95±0.2 m year−1) and the maximum accretion trend
(+1.32±0.2 m year−1) close to Vila Nova de Milfontes.
The mean rate of change in beach–dune systems is +0.28±0.06 m year−1, translating into an overall accre-tional trend of the few beach–dune systems’ stretches (Fig. 5).
Figure 6.Long-term coastline rates of change in metres per year for sediment cells 7 and 8.
+1.96±0.2 m year−1at Lagos bay. The mean rate of change is +0.28±0.03 m year−1, revealing an overall accretional trend (Fig. 6).
Cell 8 presents a complex evolution pattern, with sections in erosion alternating with sections in accretion. This pat-tern is mostly related with the morphological evolution of Ria Formosa tidal inlets, determined by either natural or ar-tificial causes (Fig. 7). The maximum and minimum val-ues should be interpreted with caution because they repre-sent localized effects of inlet-barrier tip morphological read-justments. Moreover, retention effects induced by jetties also contributed to high values of change (e.g. Faro and Guadi-ana inlets). The erosion maximum of−8.96±0.2 m year−1 is observed at the western tip of the Cacela barrier and the accretion maximum of +12.99±0.2 m year−1 at the eastern boundary of the Armona inlet (Fig. 6). The mean rate of change for this section falls within the uncertainty range (+0.01±0.01 m year−1), which indicates an overall balanced coastal sediment budget. Additionally, Ferreira et al. (2016) highlight a relevant retreat of the cliffed coast be-tween Olhos de Àgua and Ancão, particularly in the decades of the 1970s to 1990s, induced by the construction of the Vil-amoura jetties. The same authors also state that it is presently controlled by artificial nourishment actions.
Although a thorough review of the many Portuguese coast-line (and shorecoast-line) evolution studies is beyond the scope of this analysis, some results reported by other authors for ar-eas prone to erosion are briefly summarized. However,
cau-tion is needed when comparing the results obtained in the scope of the present work with those presented in the litera-ture, as they were obtained using different methodologies and using distinct time frames. For 1958–2007, SENER (2012) reported a maximum evolution rate of−4.4 m year−1at Es-moriz,−5.6 m year−1at Ovar,+5.7 m year−1at S. Jacinto, −5.8 m year−1near Costa Nova and−3.5 near Praia de Mira. Freire (1986) mentions a maximum of−12.5 m year−1 for the years 1958–1966 at Cova do Vapor/Costa da Caparica and Pinto et al. (2007) mention−3.3 m year−1between 1999
and 2007. Ferreira and Matias (2013) acknowledge an im-portant retreat of more than 3 m year−1in the western part of Culatra Island, while the eastern half exhibited accretion, be-tween 1958 and 1976. Ferreira et al. (2016) also mention that Ria Formosas’ system evolution is dominated by tidal inlet dynamics, which has directly and indirectly affected the en-tire system, including barriers’ erosion/accretion. In general, at the areas where evolutions trends are reported by other au-thors, the magnitudes are similar to the ones obtained in this study.
Figure 8 summarizes results of long-term coastline change assessment at a country scale. Portuguese mainland coastal territory occupied by sandy beach–dune systems, which represents 40 % of the total extent, depict an overall ero-sional tendency of −0.24±0.01 m year−1. This trend
Figure 7.Detail of coastline change between 1958 (yellow) and 2010 (red) at (a) Faro-Olhão inlet and (b) Cacela inlet, both at the Ria Formosa barrier island system.
hand, 54 % of all analysed transects show values with ei-ther stable/within-uncertainty tendency or an accretion ten-dency (+1.2 m year−1 at 34 %). Although beach erosion is dominant in average, this evolution is variable in signal and magnitude along and within each of the eight sediment cells (Fig. 8).
5 Conclusions
This work characterizes coastline evolution of low-lying sandy coasts using a methodology that (1) is consistent from one coastal region to another and (2) is independent of short-term change, as it quantifies change using a single robust coastline indicator (foredune toe) adequate for applications at a national scale. Furthermore, a complete dataset derived with this methodology and applied to all sandy beach–dune systems in mainland Portugal is openly accessible at https: //doi.pangaea.de/10.1594/PANGAEA.859136.
The dataset comprises two coastline sets (1958 and 2010); long-term (52 years) change rates estimated every 250 m; and minimum, maximum and mean coastline evolution rates for each considered sediment cell and for all cells. This dataset is the first systematic, national-scale and consistent long-term
Figure 8.Rate-of-change map for the mainland Portuguese sandy beach–dune system coastline. Represented in red are sandy coastal stretches withR <−0.2 m year−1, in green are sections in accre-tion (R >+0.2 m year−1), and in light yellow are sections with −0.2< R <+0.2 m year−1. Boxed values refer to the mean coast-line rate of change within each sediment cell (orange – erosion; green – accretion; white – within uncertainty measures).
coastline evolution study of Portuguese mainland low-lying sandy coast. These data can be used in other studies and thus represent an important tool to support both coastal experts and end users.
Costa Nova–Praia de Mira, Cova da Gala–Leirosa and Cova do Vapor–Costa da Caparica. Cells standing out due to the intensity and extent of the erosional behaviour exhibit major human interventions, many of which originated and main-tained a sediment deficit. In contrast, cells 5 and 6 have ex-perienced less intervention and show stable or moderately accretional behaviour. Thus, sandy beach front areas where coastal erosion is chronic are associated with human-induced deficit in the sediment budget.
Long-term coastal evolution studies should also integrate short-term analysis in order to assess acceleration patterns related to climate change effects and also evaluate manage-ment measures. The methodology proposed here can also be applied in the context of short-term analysis (<30 years), using smaller time frames. This integration will be addressed in future works. Further investigation is necessary to extend this methodology to other coastal geomorphological contexts (e.g. beach backed by rocky coasts), which will also be the objective of future studies.
6 Data availability
The datasets described in this study are publicly available, free of charge, from the PANGAEA data repository with doi:10.1594/PANGAEA.859136.
Coastlines vector shapefiles are available at http://doi. pangaea.de/10.1594/PANGAEA.853654.
Minimum, maximum and mean rates of evolution for sandy beach–dune system (SBDS) coastline are available at https://doi.pangaea.de/10.1594/PANGAEA.859135.
Mean rates of change have also been incorporated into the Portuguese coastline of the “Coastal Migration Map – Coastal Behaviour for all European countries” dataset made available by the EMODnet project as part of the geology section. This dataset is available for visualization at http: //194.66.252.216/geonetwork/srv/por/catalog.
Author contributions. C. Ponte Lira, A. N. Silva, R. Taborda and C. F. Andrade developed the methodology. C. Ponte Lira and A. N. Silva tested, validated and applied the methodology to all Portuguese mainland sand–dune systems. C. Ponte Lira wrote the manuscript with contributions from all co-authors.
Acknowledgements. The first author is supported by an FCT fellowship #SFRH/BPD/81800/2011. We acknowledge project CISML (Criação e implementação de um sistema de monitorização no litoral abrangido pela área de jurisdição da Administração da Região Hidrográfica do Tejo) (grant no. QREN – POVT: Operation POVT-12-0233-FCOES-000034, Portuguese Environ-mental Agengy – APA, I.P./Administração da Região Hidrográfica do Tejo) for contributing to making this study possible. The publication was supported by project FCT UID/GEO/50019/2013 – Instituto Dom Luiz. We thank Eng. A. Mota Lopes (APA) for the support in coastline extraction procedures and P. Brito and P.
Terrinha (IPMA) for the opportunity to contribute to the Portuguese mainland coastline version submitted to the EMODnet database on the coastal behaviour area.
Edited by: H. Grobe
References
Abecassis, F., Castanho, J., and Matias, M.: Coastal regime. Car-riage of material by sweel and currents. Model studies and in situ observations. influence of port structures. Coastal defence works, Breakwaters, Memória no. 362, LNEC, Lisbon, Portugal, 30 pp., 1970.
Andrade, C. and Freitas, M. C.: Coastal Zones, in: Climate Change in Portugal. Scenarios, Impacts and Adaptation Measures – SIAM project, edited by: Santos F. D., Forbes, K., and Moita, R., Gradiva, Liboa, Portugal, 173–2019, 2002.
Barceló, J. P.: Experimental study of the hydraulic behaviour of in-clined groin systems, Memória no. 394, LNEC, Lisbon, Portugal, 20 pp., 1971.
Bettencourt, P. and Ângelo, C.: Faixa costeira Centro Oeste (Es-pinho – Nazaré): enquadramento geomorfológico evolução re-cente, Geonovas, no Especial 1 (A Geologia e o Ambiente), Lis-boa, 7–30, 1992 (in Portuguese).
Boak, E. H. and Turner, I. L.: Coastline Definition and Detection: A Review, J. Coastal. Res., 214, 6880–703, doi:10.2112/03-0071.1, 2005.
Carapuço, M. M., Taborda, R., Silveira, T. M., Psuty, N. P., Andrade, C., and Freitas, M. C.: Coastal geoindica-tors: Towards the establishment of a common framework for sandy coastal environments, Earth-Sci. Rev., 154, 183–190, doi:10.1016/j.earscirev.2016.01.002, 2016.
Carter, R. W. G. and Woodroffe, C. D.: Coastal evolution: an intro-duction, in: Coastal Evolution: Late Quaternary Coastline Mor-phodynamics, edited by: Carter, R. W. G. and Woodroffe, C. D., Cambridge University Press, United Kingdom, 523 pp., 1994. Castanho, J., Gomes, N., Carvalho, J., Vera-Cruz, D., Araújo, O.,
Teixeira, A., and Weinholtz, M.: Means of controlling littoral drift to protect beaches, dunes, estuaries and harbour entrances, Establishment of artificial beaches, Memória no 448, LNEC, 26 pp., 1974.
Catalão, J., Catita, C., Miranda, J., and Dias, J.: Photogrammetric analysis of the coastal erosion in the Algarve (Portugal), Géo-morphologie Reli. Process. Environ., 2, 119–126, 2002. Cenci, L., Disperati, L., Sousa, L. P., Phillips, M.m and Alves, F.
L.: Geomatics for Integrated Coastal Zone Management: multi-temporal coastline analysis and future regional perspective for the Portuguese Central Region, J. Coastal. Res., 65, 1349–1354, doi:10.2112/SI65-228.1, 2013.
Coyne, M. A., Fletcher, C. H. and Richmond, B. M.: Mapping coastal erosion hazards in Hawaii: observations and errors, J. Coastal. Res., SI 28, 171–184, 1999.
Del Río, L. and Gracia, F. J.: Error determination in the photogram-metric assessment of coastline changes, Nat. Hazards, 65, 2385– 2397, doi:10.1007/s11069-012-0407-y, 2013.
available at: http://www.apambiente.pt/_zdata/DESTAQUES/ 2015/GTL_RelatorioFinal_20150416.pdf (last access: Decem-ber 2015), 2014a (in Portuguese).
Duarte Santos, F., Mota Lopes, A., Moniz, G, Ramos, L., and Taborda, R.: Gestão da Zona Costeira: O Desafio da Mu-dança – Sumário Executivo e Recomendações, Relatório do Grupo do Litoral, Report delivered to the Portuguese Gov-ernment in the Littoral Group framework, 21 pp., available at: http://www.apambiente.pt/_zdata/DESTAQUES/2015/GTL_ SumarioExecutivo_20141219.pdf (last access: December 2015) , 2014b (in Portuguese).
EMODnet Database – European Marine Observation and Data Net-work, European Commission Directorate-General for Maritime Affairs and Fisheries (DG MARE), Marine Knowledge 2020 strategy, available at: http://www.emodnet.eu/ (last acess: May 2016), 2009.
European Commission: Living with coastal erosion in Europe – Sediment and space for sustainability, Luxembourg office for official publications of the European Commission, available at: http://www.eurosion.org/reports-online/reports.html (last acess: September 2015), 2004.
EEA: Climate change, impacts and vulnerability in Europe 2012 – An indicator report. EEA Report, No 12/2012, Copenhagen, 300 pp., doi:10.2800/66071, 2012.
Ferreira, O.: Dune Erosion and Coastline Retreat between Aveiro and Cape Mondego (Portugal). Prediction of future evolution, in: Proceedings of the international coastal congress, edited by: Sterr, H., Hoststede, J., and Plag, H. P., Kiel, 187–200, 1992. Ferreira, O. and Matias, A.: Portugal, in: Coastal Erosion and
Pro-tection in Europe, edited by: Williams, A. and Pranzini, E., Rout-ledge, 457 pp., doi:10.4324/9780203128558, 2013.
Ferreira, O., Garcia, T., Matias, A., Taborda, R., and Dias, J. M. A.: An integrated method for the determination of set-back lines for coastal erosion hazards on sandy shores, Cont. Shelf Res., 26, 1030–1044, doi:10.1016/j.csr.2005.12.016, 2006.
Ferreira, O., Matias, A., and Pacheco, A.: The East Coast of Al-garve: a Barrier Island Dominated Coast, Thalass, An Int. J. Mar. Sci., 1–11, doi:10.1007/s41208-016-0010-1, 2016.
Fletcher, C., Rooney, J., Barbee, M., Lim, S., and Richmond, B. M.: Mapping coastline change using digital ortophotogrammetry on Maui, Hawaii, J. Coastal. Res., SI 38, 106–124, 2003.
Fletcher, C. H., Romine, B. M., Genz, A. S., Barbee, M. M., Dyer, M., Anderson, T. R., Lim, S. C., Vitousek, S., Bochicchio, C., and Richmond, B. M.: National assessment of coastline change – Historical coastline change in the Hawaiian Islands, U.S. Geo-logical Survey Open-File Report 2011-1051, 55 pp., available at: http://pubs.usgs.gov/of/2011/1051 (last acess: September 2015), 2012.
Freire, M. E. F.: A Planície Litoral entre a Trafaria e a Lagoa de Albufeira, MS Thesis, 204 pp., 1986 (in Portuguese).
IGeo: orthophotomaps: available at: http://www.igeo.pt (last access: May 2015), 2010.
Komar, P. D., Diaz-Mendez, G. M., and Marra, J. J.: Stability of the New River Spit, and the position of Oregon’s beach-zone line, J. Coastal. Res., 17, 625–635, 2001.
Oliveira, S.: Evolução Recente da Linha de Costa no Troço Costeiro Forte Novo – Garrão (Algarve), Ms thesis, University of Lis-bon, Portugal, 183 pp., available at: http://enggeoespacial.fc.
ul.pt/ficheiros/teses/tese_sergio_oliveira.pdf (last acess: October 2015), 2005 (in Portuguese).
Phillips, M. R. and Jones, A. L.: Erosion and tourism infrastructure in the coastal zone: Problems, consequences and management, Tour. Manag., 27, 517–524, doi:10.1016/j.tourman.2005.10.019, 2006.
Pinto, C. and Teixeira, S. B.: Beach Rotation and Coastal Erosion in Armação de Pera Bay. The Example of Salgados – Galé Sec-tor (Algarve – Portugal), International Conference on Coastal Conservation and Management (ICCCM) in the Atlantic and Mediterranean, Tavira, Portugal, 331–334, 2005.
Pinto, C. A., Taborda, R., and Andrade, C.: Evolução recente da linha de costa no troço Cova do Vapor – S. João da Caparica, in: Actas das Jornadas Portuguesas de Engenharia Costeira e Por-tuária, Lisboa, Portugal, 51–52, 2007 (in Portuguese).
Psuty, N. P., Duffy, M., Pace, J. F., Skidds, D. E., and Silveira, T. M.: Northeast Coastal and Barrier Network geomorphological monitoring protocol: part I – ocean coastline position, Natural Resource Report NPS/NCBN/NRR – 2010/185, National Park Service, Fort Collins, Colorado, 2010.
Rebêlo, L., Ferraz, M., Brito, P., and Terrinha, P.: Quantification of sediments accumulated in the NW sector of Tróia Peninsula (Portugal) between 1928 and 1995, J. Coast. Conserv., 16, 261– 268, doi:10.1007/s11852-011-0171-2, 2011.
Rocchini, D. and Di Rita, A.: Relief effects on aerial pho-tos geometric correction, Appl. Geogr., 252, 159–168, doi:10.1016/j.apgeog.2005.03.002, 2005.
SENER: Elaboração dos Estudos da Evolução e da Dinâmica Costeira e Estuarina, de Mobilidade e Navegabilidade na Laguna e de Reforço de Margens pela Recuperação de Diques e Motas com Vista à Prevenção de Riscos, Techni-cal Report, 648 pp., available at: https://cld.pt/dl/download/ 177dcc91-ae9b-4a2d-b9f9-df1e39b0ca92/Estudo1_Relat1.pdf (last acess: May 2016), 2012 (in Portuguese).
Shoshany, M., Golik, A., Degani, A., Lavee, H., and Gvirtzman. G.: New evidence for sand transport direction along the coastline of Israel, J. Coastal. Res., 12, 311–325, 1996.
Silva, A., Lira, C., Andrade, C., Taborda, R., and Freitas, M. C.: Análise da evolução da linha de costa no litoral baixo arenoso nos últimos 50 anos. In: Criação e implementação de um sistema de monitorização no litoral abrangido pela área de jurisdição da Administração da Região Hidrográfica do Tejo, Technical Report. Entregável 1.2.2.2. a., available at: http://www.apambiente.pt/_zdata/Politicas/Agua/Ordenamento/ SistemaMonitorizacaoLitoral/E_1.2.2.2.a_Linha20de20costa. pdf (last acess: June 2015), 2013 (in Portuguese).
Taveira Pinto, F., Pais Barbosa, J., and Veloso Gomes, F.: Coastline Evolution at Esmoriz-Furadouro Stretch (Portugal), J. Coastal. Res., SI 56, 673–677, 2009.
Thieler, E. R., Himmelstoss, E. A., Zichichi, J. L., and Er-gul, A.: Digital Coastline Analysis System (DSAS) ver-sion 4.0 – An ArcGIS extenver-sion for calculating coastline change, U.S. Geological Survey Open-File Report 2008-1278, available at: http://woodshole.er.usgs.gov/project-pages/DSAS/ version4/ (last acess: September 2015), 2009.
Veloso-Gomes, F., Costa, J., Rodrigues, A., Taveira-Pinto, F., Pais-Barbosa, J. and Neves, L.: Costa da Caparica Artificial Sand Nourishment and Coastal Dynamics, J. Coastal. Res., SI 56, 678– 682, 2009.
Verhoeven, G., Doneus, M., Briese, C., and Vermeulen, F.: Map-ping by matching: a computer vision-based approach to fast and accurate georeferencing of archaeological aerial photographs, J. Archaeol. Sci., 39, 2060–2070, doi:10.1016/j.jas.2012.02.022, 2012.