R E S E A R C H A R T I C L E
Open Access
Pathway-based outlier method reveals
heterogeneous genomic structure of autism in
blood transcriptome
Malcolm G Campbell
1,2,3, Isaac S Kohane
1,2and Sek Won Kong
1,2*Abstract
Background:Decades of research strongly suggest that the genetic etiology of autism spectrum disorders (ASDs) is heterogeneous. However, most published studies focus on group differences between cases and controls. In contrast, we hypothesized that the heterogeneity of the disorder could be characterized by identifying pathways for which individuals are outliers rather than pathways representative of shared group differences of the ASD diagnosis.
Methods:Two previously published blood gene expression data sets–the Translational Genetics Research Institute (TGen) dataset (70 cases and 60 unrelated controls) and the Simons Simplex Consortium (Simons) dataset (221 probands and 191 unaffected family members)–were analyzed. All individuals of each dataset were projected to biological pathways, and each sample’s Mahalanobis distance from a pooled centroid was calculated to compare the number of case and control outliers for each pathway.
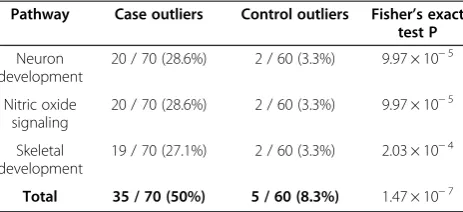
Results:Analysis of a set of blood gene expression profiles from 70 ASD and 60 unrelated controls revealed three pathways whose outliers were significantly overrepresented in the ASD cases: neuron development including axonogenesis and neurite development (29% of ASD, 3% of control), nitric oxide signaling (29%, 3%), and skeletal development (27%, 3%). Overall, 50% of cases and 8% of controls were outliers in one of these three pathways, which could not be identified using group comparison or gene-level outlier methods. In an independently
collected data set consisting of 221 ASD and 191 unaffected family members, outliers in the neurogenesis pathway were heavily biased towards cases (20.8% of ASD, 12.0% of control). Interestingly, neurogenesis outliers were more common among unaffected family members (Simons) than unrelated controls (TGen), but the statistical significance of this effect was marginal (Chi squaredP< 0.09).
Conclusions:Unlike group difference approaches, our analysis identified the samples within the case and control groups that manifested each expression signal, and showed that outlier groups were distinct for each implicated pathway. Moreover, our results suggest that by seeking heterogeneity, pathway-based outlier analysis can reveal expression signals that are not apparent when considering only shared group differences.
Keywords:Autism spectrum disorder, Blood gene expression, Nervous system development, Outliers, Pathways
* Correspondence:[email protected]
1
Center for Biomedical Informatics, Harvard Medical School, 10 Shattuck Street, Boston, MA 02115, USA
2
Informatics Program, Children’s Hospital Boston, 300 Longwood Avenue, Boston, MA 02115, USA
Full list of author information is available at the end of the article
Background
The study of complex human disorders—diseases influenced
by many genetic and environmental factors, such as cancer,
diabetes, and autism—has intensified with the rise of
se-quencing technology, but the majority of genetic heritability remains unaccounted for in most cases [1]. McClellan and King suggested that heterogeneity is the source of this gap, positing that the genetic component of complex disease is in fact a collection of rare or private conditions [2]. Moreover,
they asserted that“causality in this context can almost never
be resolved by large-scale association or case–control
stud-ies”. It is possible that genetic heterogeneity converges onto
a final common pathway for each disease, but even at this level there could be one or more related pathways contribut-ing to pathogenesis, with each pathway implicated in only a subset of patients (for example, [3]). This recognition has led to several pathway-based classifications of cancer [4,5].
It is widely accepted that autism spectrum disorders
(ASDs) are heterogeneous both phenotypically—for
ex-ample, among people with ASDs there is much variation in the three core domains of language, social interaction,
and range of interests—and in terms of genetic variation
[6]. However, most of the published analyses focus on group differences, such as in numbers of genic copy number variations (CNVs) [7-13] and gene expression in genes and pathways [14-22]. By their nature, these methods will blur or collapse the heterogeneity within the ASD group that many have posited characterize this spectrum disorder. Here we have chosen to characterize the heterogeneity of the disorder by finding those cases that are most unambiguously different from other subjects, those that are outliers in one or more gene ex-pression pathways. Specifically, we develop an outlier approach to expression data analysis that searches for pathways in which outliers are biased towards either case or control.
Hawkins defined an outlier to be “an observation
which deviates so much from the other observations as to arouse suspicions that it was generated by a different
mechanism”[23]. The many methods that have been
de-veloped to identify outliers can be grouped into several broad categories [24]. Global methods define outliers using the entire data set as a reference set, whereas local methods use only a subset of samples as reference. Based on the assumption that control samples could be outliers in some pathways and that most case samples will not be outliers in any given pathway, we chose a glo-bal outlier method. Labeling methods classify samples as
“outlier” or “non-outlier”, while scoring methods assign
a continuous outlier score to each sample. In order to assign samples to pathway-specific subgroups, we chose a labeling method. Techniques can also be classified by the properties of the underlying model. The most basic approach is to use statistical tests to calculate a
probability of observing a data point given a null distri-bution, and then apply a threshold to label outliers. More sophisticated approaches include depth- [25], deviation- [26], distance- [27], and density- [28,29] based models.
The Mahalanobis distance is among the most basic techniques for outlier detection, with applications in wide-ranging fields such as the identification of defective machine parts [30], face recognition [31], and cyber se-curity [32]. An analogue of Euclidean distance that scales and centers the data, the Mahalanobis distance gives more weight to variation in directions with lower vari-ance (see Methods). Here we apply it to multivariate transcriptomic data to identify subgroups of outlier sam-ples with distinct, pathway-specific gene expression sig-natures. Our hypothesis is that outlier samples have gene expression values that were generated by a different mechanism than the rest of samples because of genomic
variants in the pathway’s genes or in their regulators. A
common problem with outlier-based methods is that outliers can strongly influence estimates of the parame-ters of the normal data. We address this issue by employing the robust minimum covariance determinant to estimate mean and scatter [30,33].
Many applications of outlier-methods to genomic data have already been developed, primarily to identify sub-sets of tumor samples with different chromosomal trans-locations or activated oncogenes [34-41]. These methods propose various ways of defining a cutoff between out-lier and non-outout-lier samples for a single gene, motivated by the fact that different oncogenes may be activated in different tumor subtypes, leading to outlier expression for these genes in some samples but not others [34-38,40]. Recently, Luo and colleagues brought outlier
methods to autism research [42]. By integrating
transcriptomic and copy number variation (CNV) data from autistic patients and controls, they linked genes with outlier expression values in cases to specific CNVs. While powerful, all of these methods search for outliers at the level of the gene. The approach taken here instead searches for outliers within the multidimensional space corresponding to the genes in a pathway, based on the hypothesis that these pathways allow the identification of shared endophenotype [43].
We applied our method to an autism data set derived from peripheral blood with 70 ASD and 60 control sam-ples, collected by the Translational Genomics Research Institute (TGen) in Pheonix, Arizona, which we refer to as the TGen data set. The analysis revealed three
path-ways—neuron development, nitric oxide (NO) signaling,
and skeletal development—with significantly more case
outliers than control outliers according to Fisher’s exact
as the Simons data set, confirmed that neurogenesis was perturbed in a subset of samples. In this data set, con-trols were unaffected family members (188 siblings and 3 mothers), and the proportion of control neurogenesis outliers was higher than in the TGen data set where the controls were unrelated to the cases. Conventional dif-ferential expression of pathways that use overall group differences (e.g. GSEA) did not identify the perturbation of the above pathways as significant.
Results
Our aim was to characterize samples as “outliers” or
“non-outliers” in prior-knowledge based pathways, with
the hypothesis that, within a pathway, outliers represent samples that are biologically perturbed. For analysis, we collected 2,159 pathways that included modified Gene Ontology (GO) terms [44], Kyoto Encyclopedia of Genes and Genomes (KEGG) pathways [45,46], Reactome path-ways [47], and Biocarta pathpath-ways (www.biocarta.com) from the Molecular Signatures Database (MSigDb) ver-sion 3.0 [48], two genesets consisting of differentially expressed genes for autism-linked syndromes i.e., Fragile X mental retardation and 15q duplication based on the data of Nishimura and colleagues [19], and two sets of
de novo mutation-containing genes from two recent exome sequencing studies [49,50] (see Methods).
Although each of these pathways consists of 10 to 300 genes, we reduced these many dimensions into a single quantitative measure for each sample. First, we applied principal component analysis (PCA) to the multidimen-sional space of genes in the pathway and retained the principal components that accounted for 90% of variance [51]. In the TGen data set, the median number
of retained principal components was 6 (IQR = 4–9),
whereas in Simons this number was larger (26, IQR =
17–47), a difference that can be at least partially
explained by the difference in sample size. After projecting the data into PCA space, we represented each sample by a Mahalanobis distance to the centroid of all samples [30,52,53]. In theory, these distances follow a square root chi-squared distribution under the null hypothesis. This allowed us to define pathway-specific
outliers based on the theoretical chi-squared 97.5th
percentile, which corresponds to a p-value < 0.025 for a one-sided test [30]. Having categorized the samples into outliers and non-outliers in each pathway with this threshold, we then searched for pathways where the outliers were significantly biased towards either case or control.
Identification of outlier-enriched pathways
In the TGen data set, we initially found five pathways enriched for case outliers at FDR < 10%. No pathway was enriched for control outliers at this threshold. The
genesets characterizing 15q duplication and Fragile X mental retardation were not enriched for outliers in our
data set, nor were the sets of genes that contained de
novo mutations in two recent studies [49,50]. The
case-enriched pathways were axonogenesis (GO:0007409, modi-fied by MSigDb), neurite development (GO:0031175, modified by MSigDb), neuron development (GO:0048666, modified by MSigDb), nitric oxide (NO) signaling pathway (Biocarta), and skeletal development (GO:0001501, modi-fied by MSigDb). To check for the confounding effect of age, we performed propensity sampling (see Methods). Briefly, propensity sampling selects subsets of cases and controls that are matched for age and repeats the proced-ure on this reduced data set. All five pathways ranked highly after propensity sampling for age (ranks 2, 16, 7, 18, and 3 out of 2,159 pathways, respectively) indicating that age was not an important confounder. The complete re-sults from propensity sampling, reported as average p-values across 100 trials, are included as Additional file 1. P-values were less significant after propensity sam-pling because of iterations in which outliers were excluded. Among the five pathways that were significantly enriched with case outliers, axonogenesis, neurite devel-opment, and neuron development are highly redundant genesets: axonogenesis is contained within neurite devel-opment, which is contained within neuron development. The size of these genesets is 43, 53, and 61 genes, re-spectively. Because they are almost identical, these three pathways captured a very similar signal. As expected, the Mahalanobis distance distributions for these pathways
were highly correlated (Kendall’s tau≥0.74 for all three
pairs, P< 6.86 × 10⁻⁴. Therefore, we selected only the
largest pathway, neuron development, for further ana-lysis. In contrast, neuron development shares only one
gene with skeletal development (GLI2) and none with
NO signaling. NO signaling and skeletal development do not share any genes, and the correlation of their Mahalanobis distance distributions was not significant
compared to the distribution of Kendall’s tau correlation
for all pairs of pathways (Kendall’s tau = 0.29, P= 0.349).
For these reasons, we selected neuron development, ni-tric oxide signaling, and skeletal development as the candidate pathways in which a subgroup of patients was detected as outliers in TGen. Table 1 enumerates the number of case and control outliers in these pathways
along with their Fisher’s exact test p-values. For
refer-ence, in the average pathway, 10.7 cases (15.3%) and 8.4 controls (14.0%) were outliers.
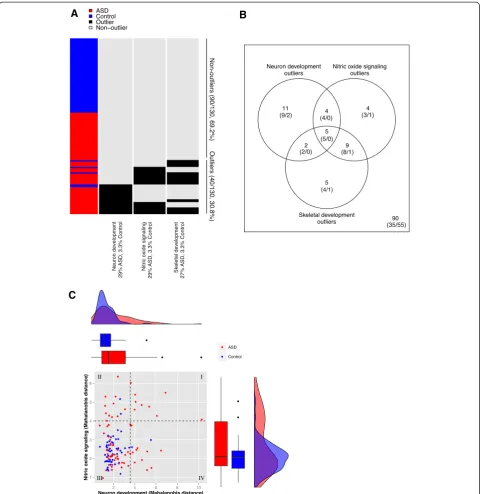
NO signaling and skeletal development, with 14 samples in both groups out of 22 NO signaling and 21 skeletal development outliers. Remarkably, the five samples that were outliers in all three pathways were all cases, and only one control was an outlier in more than one path-way (NO signaling and skeletal development). Figure 1C shows a more detailed comparison of two candidate pathways, neuron development and NO signaling. Nine samples were outliers in both pathways (quadrant I), 13 samples (11 ASD and 2 controls) were outliers in NO signaling but not neuron development (quadrant II), and 13 samples (11 ASD and 2 controls) were outliers in neuron development but not NO signaling (quadrant IV). A 3-dimensional PCA plot of the neuron develop-ment pathway, revealing the multivariate structure behind the outlier calculation, is shown in Additional file 2.
Differential expression analysis
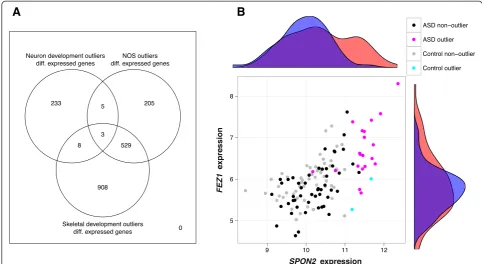
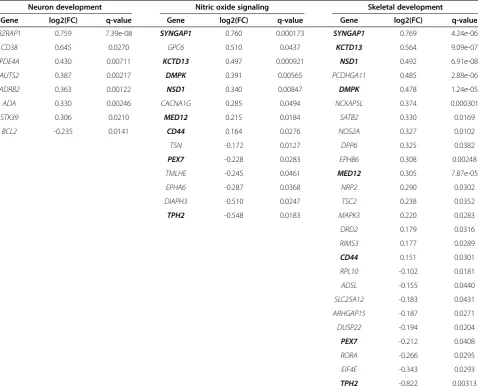
We opted to determine the leading edge genes that dis-tinguished each outlier group from the rest of samples. To do so, we performed standard differential expression analysis of outliers vs. non-outliers in the three candi-date pathways (see Methods). There were 249 differen-tially expressed genes for neuron development (22 outliers vs. 108 non-outliers), 742 for nitric oxide signal-ing (22 vs. 108) and 1448 for skeletal development (21 vs. 109) at the same FDR < 5% (Figure 2A). These in-cluded 8, 14, and 26 known autism candidate genes re-spectively from the Simons Foundation Autism Research Initiative (SFARI) Gene 2.0 database [54], which contained 369 genes as of July, 2012 (Table 2). Based on hypergeometric tests, this overlap was significant for the neuron development group, but not for the other two
(P= 0.0310, 0.314, 0.708 respectively). Because of the
relatively large number of samples that were outliers in both NO signaling and skeletal development (Figure 1B), the differentially expressed genes for these two sub-groups were highly overlapping.
The top differentially expressed gene for the neuron
de-velopment group wasSPON2, which codes for spondin-2,
an extracellular matrix protein. Also known as M-spondin
and mindin, spondin-2 has been shown to direct the growth and adhesion of embryonic hippocampal neurons in a rat model [55]. As an extracellular matrix protein in-volved in neuronal cell adhesion, it plays a role one of the emergent themes of ASD neurobiology [56]. The only other gene in the intersection neuron development with the 249
differentially expressed genes was FEZ1, which codes for
fasciculation and elongation protein 1.FEZ1 was recently
shown to interact withDISC1, a known candidate gene for
both autism and schizophrenia [57,58]. Expression levels of SPON2 and FEZ1 are plotted against each other in Figure 2B, showing that most neuron development outlier samples had extreme values in one or both of these genes. However, some non-outlier samples had extreme expres-sion values in these genes and vice versa, indicating that the pathway structure is also important. A complete list of dif-ferentially expressed genes for the three pathways is pro-vided in Additional file 3.
Comparison with group difference tests
To check whether these candidate pathways could be identified by group comparison methods, rendering this outlier-based approach irrelevant, we performed standard differential expression followed by hypergeometric tests for enrichment among the MSigDB pathways (see Methods). Using this approach, 437 genes were differen-tially expressed at FDR < 5%, 5 pathways were identified at FDR < 5%, and 45 pathways were identified at FDR < 10% (Additional file 4). It is likely that the significance of these hypergeometric tests was inflated by our filtering for ro-bustly expressed genes, which are biased towards genes that are part of known pathways. Nevertheless, none of neuron development, NO signaling, or skeletal develop-ment was significant according to this analysis, with q-values of 0.365, 1, and 1, respectively. Of the pathways that were significantly enriched with differentially ex-pressed genes by hypergeometric tests, only the GO term axon guidance (GO:0007411, modified by MSigDB), a 22-gene pathway that is entirely contained within neuron development, was equivalent to or contained within one of the three outlier pathways (Additional file 4). Axon guidance contained 4 differentially expressed genes
(hyper-geometric P= 0.000944, q-value = 0.0702); these genes
were SPON2, SIAH1, SLIT1, and FEZ2. Interestingly, in
the group difference comparison,FEZ2and notFEZ1was
differentially expressed. Since axon guidance was one of 45 pathways identified at FDR < 10% using hypergeometric tests whereas neuron development was one of 3 pathways identified at FDR < 10% using the outlier method, we con-clude that our method identifies this signal with greater specificity. The three outlier-enriched pathways were not identified as significantly up or down regulated in cases using GSEA even at FDR < 25%. Indeed, no pathways were significant at FDR < 10% by GSEA. Taken together, these Table 1 Case/control outlier counts in outlier-enriched
TGen pathways
Pathway Case outliers Control outliers Fisher’s exact test P
Neuron development
20 / 70 (28.6%) 2 / 60 (3.3%) 9.97 × 10⁻⁵
Nitric oxide signaling
20 / 70 (28.6%) 2 / 60 (3.3%) 9.97 × 10⁻⁵
Skeletal development
19 / 70 (27.1%) 2 / 60 (3.3%) 2.03 × 10⁻⁴
data indicate that our outlier method captured a signal that was not evident at the group difference level.
Comparison with gene-level outlier analysis
To determine whether pathway-level analysis held any advantage over level analysis, we performed
gene-level outlier tests (see Methods). Our gene-gene-level analysis was analogous to our pathway-level analysis in that we defined outliers based on a hard threshold and then
performed Fisher’s exact tests to compute outlier
enrichment. 822 genes were significant at FDR < 5% (Additional file 5). 14 MSigDB pathways were significant
Figure 1Outlier-enriched pathways in the TGen data set. A)Heatmap marking outliers for each outlier-enriched pathway: neuron development, nitric oxide (NO) signaling, and skeletal development (Figure 4, step 4). Samples sorted by outlier status followed by diagnosis.
at FDR < 10% by hypergeometric tests (Additional file 5). Neuron development, NO signaling, and skeletal devel-opment were not among them. Out of these 14 path-ways, only negative regulation of developmental process (GO:0051093, modified by MSigDB) overlapped signifi-cantly with any of the three outlier-enriched pathways (namely, neuron development and skeletal development; see Additional file 5 for overlap statistics), but the over-lap was not nearly as significant as a complete contain-ment, as in the case of neurogenesis and neuron
development. Interestingly, SPON2 was the fifth ranked
outlier gene (P= 4.83 × 10⁻⁵, q-value =0.0118), and
FEZ1 was also significant (P= 0.0138, q-value = 0.0392),
but neuron development was not significantly overrepre-sented in the 822 outlier genes overall. This suggests that the subtle contributions of other genes in the neuron de-velopment pathway enabled pathway-level analysis to cap-ture a signal that was lost at the gene-level.
Validation in an independent data set
For validation, we applied the same analyses to the Simons data set. No genes were differentially expressed (minimum FDR q-value = 1) and no pathways were differentially expressed at FDR < 25% using GSEA. Using the outlier method presented here, no pathways were significant at
FDR < 10%, and all pathways with uncorrected Fisher’s test
p-value < 0.05 are listed in Additional file 6. The highest ranked outlier-enriched pathway was the bone remodeling RANKL pathway (Biocarta). In this pathway, we identified 39 / 221 (17.6%) of cases and 14 / 191 (7.3%) of controls as
outliers (Fisher’s exact testP= 0.00185). The RANKL
path-way regulates bone homeostasis [59,60], but since it shares no genes with the MSigDb skeletal development pathway, a comparison of the RANKL signal in Simons to the skel-etal development signal in TGen is purely speculative.
None of the three TGen candidate pathways were ini-tially identified as outlier-enriched in the Simons data
set with Fisher’s exact test p-values of 0.204 (neuron
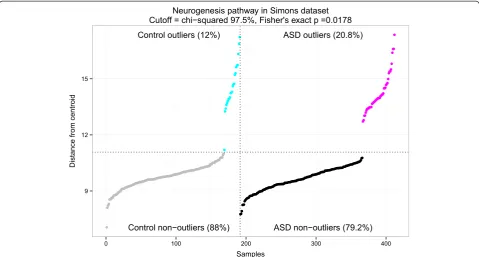
devel-opment), 1.0 (NO signaling), and 0.703 (skeletal develop-ment) and case/control outlier percentages of 20.8%/ 15.7%, 16.7%/12.6%, and 17.6%/19.4%, respectively. These numbers were fairly typical given average outlier percent-ages of 16.6% for cases and 15.8% for controls. However, we found that neurogenesis (GO:0022008, modified by MSigDB), a 93-gene pathway that contains all 61 neuron development genes, ranked highly among the pathways biased towards ASD outliers. Remarkably, neurogenesis
ranked 9thout of 2,159 pathways for case-specific outlier
enrichment (99.5thpercentile), and 13thfor two-sided tests
(99.3rdpercentile). As shown in Figure 3, we identified 46 /
221 (20.8%) of cases and 23 / 191 (12.0%) of controls as
outliers (Fisher’s exactP= 0.0178). While neurogenesis did
not pass the FDR < 10% significance threshold based on
the multiple hypothesis-corrected Fisher’s test (indeed, no
pathways passed this threshold in the Simons data set), we consider this rank-based evidence noteworthy given the statistical significance of the pathway in the TGen data set. One control sample that clearly belongs to the non-outlier group was called an outlier, but was very close to the out-lier threshold. Nevertheless, neurogenesis was highly ranked despite this classification error, which weakened the result. Interestingly, a greater proportion of controls had a neurogenesis signature in the Simons data set than
in the TGen data set (12% vs. 3%, chi-squaredP= 0.0858),
which is consistent with the fact that the Simons controls were unaffected family members rather than unrelated children. Out of 46 case outliers and 23 control outliers, there were six proband/sibling pairs, of which two were sex matched.
Differential expression analysis revealed the genes that drove the clustering of the neurogenesis subgroup in the Simons data set. At FDR < 5%, 1,969 genes were differ-entially expressed between neurogenesis outliers and all other samples (Additional file 7). Of these, 13 were among the 93 genes in the neurogenesis pathway. Three out of these 13 neurogenesis genes were known autism candidate genes according to the SFARI database:
NRXN3, ROBO1, and NRCAM. All three were
over-expressed in the neurogenesis outlier subgroup. More-over, out of the total 1969 differentially expressed genes, 35 were found in the SFARI database. Interestingly,
SPON2, the most significant neuron development gene in TGen, was marginally differentially expressed in the
Simons neurogenesis group (P= 0.0889, q-value = 0.172).
Because the Simons data set consisted largely of pairs of siblings, we performed an alternate analysis for this data set Table 2 Differentially expressed autism candidate genes for each pathway subgroup
Neuron development Nitric oxide signaling Skeletal development
Gene log2(FC) q-value Gene log2(FC) q-value Gene log2(FC) q-value
BZRAP1 0.759 7.39e-08 SYNGAP1 0.760 0.000173 SYNGAP1 0.769 4.24e-06
CD38 0.645 0.0270 GPC6 0.510 0.0437 KCTD13 0.564 9.09e-07
PDE4A 0.430 0.00711 KCTD13 0.497 0.000921 NSD1 0.492 6.91e-08
AUTS2 0.387 0.00217 DMPK 0.391 0.00565 PCDHGA11 0.485 2.88e-06
ADRB2 0.363 0.00122 NSD1 0.340 0.00847 DMPK 0.478 1.24e-05
ADA 0.330 0.00246 CACNA1G 0.285 0.0494 NCKAP5L 0.374 0.000301
STK39 0.306 0.0210 MED12 0.215 0.0184 SATB2 0.330 0.0169
BCL2 -0.235 0.0141 CD44 0.164 0.0276 NOS2A 0.327 0.0102
TSN -0.172 0.0127 DPP6 0.325 0.0382
PEX7 -0.228 0.0283 EPHB6 0.308 0.00248
TMLHE -0.245 0.0461 MED12 0.305 7.87e-05
EPHA6 -0.287 0.0368 NRP2 0.290 0.0302
DIAPH3 -0.510 0.0247 TSC2 0.238 0.0352
TPH2 -0.548 0.0183 MAPK3 0.220 0.0283
DRD2 0.179 0.0316
RIMS3 0.177 0.0289
CD44 0.151 0.0301
RPL10 -0.102 0.0181
ADSL -0.155 0.0440
SLC25A12 -0.183 0.0431
ARHGAP15 -0.187 0.0271
DUSP22 -0.194 0.0204
PEX7 -0.212 0.0408
RORA -0.266 0.0295
EIF4E -0.343 0.0293
TPH2 -0.822 0.00313
using McNemar’s test instead of Fisher’s test. There were 168 proband/sibling pairs out of 412 samples. On the re-duced data set consisting of these 168 pairs of siblings, no pathways were significant: all pathways had q-values of 1
(see Additional file 8 for McNemar’s test results for all
2,158 pathways). In the neurogenesis pathway, 19% of ASD samples were identified as outliers versus 13.1% of
controls, yielding a McNemar’s test p-value of 0.155.
There were seven sibling pairs (4.2% of both cases and controls) in which both siblings were outliers, which is greater than expected by chance but not significant by
hypergeometric test (P= 0.0934). Because the direction of
the effect remained the same but was less significant, and
because Fisher’s test p-values were highly correlated with
McNemar’s test p-values on the reduced data set (ρ=
0.864), we attribute the loss of significance to the elimin-ation of 76 samples and the resulting loss in power, rather than the use of an alternate method. Indeed, this result is consistent with the interpretation that the neurogenesis signal is enriched among siblings of probands as compared to unrelated controls.
Discussion
ASD, like other complex disorders such as diabetes and heart disease, is almost certainly associated with the ef-fect of multiple genes as well as environmental factors. To date, no more than 20% of cases have been linked to
structural genomic variants such asde novoCNVs and
mu-tations, and monogenic syndromic disorders. To further
understand the heterogeneity of ASD genetic architecture reflected in the blood transcriptome, we developed a novel approach using outlier statistics. To demonstrate the plausibility, we used two independently collected data sets of ASD and controls. Only ~30% of cases shared molecu-lar signatures including neural development (29% of cases), NO signaling pathway (29% of cases), and skeletal development (27% of cases). These pathways could not be identified with group comparison or gene-level outlier methods, and the significantly perturbed cases for these pathways were not identical. Overall, our approached identified 50% of cases but only 8% of controls as outliers in at least one of these pathways.
To date, most emergent biological themes in ASDs have fallen into one of three categories: neuroanatom-ical, systems, and molecular and cellular [56]. Neuroana-tomical observations of altered brain growth patterns [61-63] and minicolumnopathy [64] are the most repro-ducible clinical signatures of ASDs. Pathways affecting cellular proliferation such as the PI3K-AKT-mTOR pathway have been hypothesized to affect abnormal brain growth in ASD, but no concrete link between such pathways and brain growth patterns exists as yet [56]. At the systems level, evidence has accumulated for func-tional alterations in white matter tracts [65-68] and overall imbalance between excitation and inhibition in the brain [69-72]. Cellular and molecular themes have converged on the function and structure of the synapse.
Rare or de novo, deleterious mutations were found in
Figure 3Neurogenesis outliers in the Simons data set.The y-axis is in units of Mahalanobis distance from the pooled centroid of cases and controls, and the x-axis is samples. One control sample was misclassified as an outlier due to the choice ofχ2
ionotropic glutamate receptors [49,73], voltage-gated so-dium channels [49,50,74], and voltage-gated calcium channels [75,76]. Neurexins and neuroligins are involved in neuronal adhesion and have been heavily implicated in ASDs by cytogenetic analysis [77], CNV studies [8,9,11,49] and knockout mouse models [70,72,78].
Simi-larly, candidate genes SHANK2 and SHANK3 code for
scaffold proteins in the postsynaptic density. Other ASD candidate genes with protein products in the
postsynap-tic density include FMR1 and associated genes MET,
PTEN,TSC1,TSC2, and NF1, all of which are involved
in translation, as well as genes involved in protein
deg-radation such as UBE3A,PARK2, RFWD2, FBXO40, and
USP7[56]. In summary, anatomical, physiological,
mouse-model, and human genetic studies have implicated brain growth, white matter connectivity, synaptic transmission, and the structure of the synapse as promising biological themes in ASD.
In this context, our discovery of three pathways related
to neural development—axonogenesis, neurite
develop-ment, and neuron developdevelop-ment, which we collapsed
to-gether for analysis—was notable as defects in early
neurodevelopmental processes such as neuronal survival, differentiation, migration and synaptogenesis may cause neurobiological abnormalities in ASD [79]. The NO sig-naling pathway contains genes involved in the glutamate NMDA receptor, as well as in the calcium/calmodulin and NO mediated second messenger systems that regu-late long-term potentiation and other activity dependent developmental processes. Moreover, neurogenesis was dysregulated in a subgroup of cases from an independ-ently collected cohort. Specifically, in the Simons data set we identified 20.8% of cases and 12.0% of unaffected family members as neurogenesis outliers.
Outlier samples also showed gene-level differences com-pared to non-outlier samples. By comparing outliers and non-outliers, we could identify differentially expressed genes that were specific to outlier subgroups. Among these,
FEZ1was recently shown to interact withDISC1, a
suscep-tibility gene for schizophrenia and other mental disorders [57]. In that paper, the authors show that fasciculation and elongation protein zeta-1 (FEZ1) acts together with Disrupted-in Schizophrenia 1 (DISC1) to regulate dendritic growth in the hippocampus of adult mice. Interestingly,
DISC1is also an ASD candidate gene; variation inDISC1,
located at 1q42, was correlated with autism in a Finnish
co-hort [58]. WhileFEZ1 was not differentially expressed
be-tween cases and controls overall in the TGen data set
(P= 0.238), we were able to detect differential expression of
FEZ1 in a subset of cases using our heterogeneity-based
approach (P= 1.85 × 10⁻⁷, q-value = 5.95 × 10⁵). Similarly,
SPON2, whose protein product spondin-2 was shown to direct the development of hippocampal neurons in rats [55], was highly over-expressed in neuron development
outliers (P= 2.29 × 10⁻¹⁹, q-value = 4.48 × 10⁻¹⁵, differential
expression rank = 1/21,184) but this significance was
di-luted at the group difference level (P= 0.000946, q-value =
0.0430, differential expression rank = 292/21,184). Interest-ingly, we could recover most outlier cases from the
distri-butions of SPON2 and FEZ1 alone (Figure 2B). While
gene-level analysis detected these two genes at FDR < 5%, neuron development was not overrepresented among the outlier genes overall, indicating that other genes in the pathway also played an important role.
Our method and the two data sets used in our study had several limitations. Due to their incompleteness and generality, the pathway definitions from MSigDB imper-fectly describe the underlying biology of ASD. Neverthe-less, we chose to use these definitions as opposed to data-driven pathways to avoid over-fitting. Clinical defi-nitions of ASD are constantly changing, and include a broad swath of individuals with heterogeneous disorders; while this was the motivation for our analysis, it is also conceivable that misdiagnosis due to overly inclusive cri-teria led to the inclusion of false-positive outliers in our study. It is possible that genetically distinct cohorts were recruited for the two data sets, as samples were collected at two geographically distant study sites with different local ancestral structures. Although we tried to reduce technical variation such as batch effects in each data set, it is possible that some technical artifacts remained. There will also inevitably be technical variability between two genomic profiling facilities and microarray plat-forms. Therefore, it is unsurprising that we were not able to replicate all of our results: specifically, we were unable to identify NO signaling and skeletal develop-ment signatures in the Simons cohort, and the RANKL pathway, while perhaps related to skeletal development, was the top-ranking outlier-enriched pathway in the Simons data set but not significantly outlier-enriched the TGen data set. Finally, because we used blood gene ex-pression profiles as a surrogate for studying genomic alter-ations in a neurodevelopmental disorder, the difference in transcriptomic repertoire between blood and brain might have limited us to characterizing only 50% of samples in our results. Because of these limitations, this study and its results should be considered exploratory, showing the po-tential benefits of a novel approach, but not conclusive.
genomic signatures using an outlier-based approach, which will be strengthened by the integration of different modal-ities of genomic data such as genome and whole-exome sequences. Looking farther into the future, true personalized medicine will only be achieved when individ-ual genetic and genomic characteristics are combined with clinical and other phenotypic information.
Conclusions
In this study, we applied a novel, pathway-based outlier method to two publicly available autism gene expression data sets from peripheral blood (TGen and Simons). Analysis of the TGen data set revealed three non-identical subgroups of samples with perturbations in the neuron development, nitric oxide signaling, and skeletal development pathways. In the Simons data set, we also found a subset of patients with a perturbed neurogenesis signature, but were unable to convincingly replicate ni-tric oxide signaling or skeletal development. A greater proportion of unaffected family members (Simons con-trols) manifested a neurogenesis signature than did un-related children (TGen controls), possibly due to the shared genetic background between probands and their family members. While pathway-based classifications of cancer have been developed, this is both the first applica-tion of such methods to ASDs, and the first integraapplica-tion of pathway-based classification with outlier methods. These results show that pathway-based outlier analysis is useful for the study of complex disorders, and add to the growing body of evidence that peripheral blood gene expression data contain useful markers for neurodevelopmental disorders.
Methods
Gene expression data sets
We analyzed two previously published blood gene ex-pression data sets. The first data set was from the Transla-tional Genetics Research Institute (TGen), and consisted of 144 CEL files from Affymetrix HG-U133 Plus 2.0 chips (78 from ASD samples and 66 from controls). Quality control left 130 arrays (70 case and 60 control). This data set is available on the Gene Expression Omnibus (GEO) as GSE25507 [82]. The second data set was from the Simons Simplex Consortium (SSC), and consisted of 439 Illumina Whole Human Genome Array Human REF-8 version 3.0 arrays (233 case and 206 control). After quality control, 412 samples remained (221 case and 191 control). The 191 controls consisted of 188 unaffected siblings and 3 mothers. All 3 mothers had a child among the probands, and there were 168 proband/sibling pairs. The other 20 controls were unaffected siblings of probands not in-cluded in the study. We refer to this data set as the Simons data set; it is available on GEO as GSE37772 [42].
See“Preprocessing”for detailed microarray preprocessing
steps. Phenotype information for both data sets is summa-rized in Additional file 9.
Genesets
Prior knowledge-based genesets consisting of Entrez Gene Identifiers (Entrez IDs) were downloaded in Gene Matrix Transposed (GMT) format from the Molecular Signatures Database (MSigDB) version 3.0 [48]. Of the available genesets, we used those that are expert-curated, namely C2:CP (canonical pathways), and C5 (modified Gene Ontology term genesets). After filtering out large (>300 genes) and small (<10 genes) genesets, there were 2157 genesets in these categories as of January, 2012. To this we added genesets consisting of differentially ex-pressed genes from the comparison of blood gene expres-sion profiles from patients with Fragile X syndrome and
15q duplication to controls [19], and two sets of de novo
mutation-containing genes from exome sequencing stud-ies [49,50], resulting in a total of 2161 genesets. These genesets were mapped to probesets on the Affymetrix HG-U133 Plus 2 array using the annotation table from the
Affymetrix website dated June 9th, 2011. Probesets ending
in“x_at” were discarded because this suffix indicates that
the probeset may bind to multiple transcripts. In total, these genesets contained 9,347 unique Entrez IDs, 98% of which (9,175) mapped to at least one probeset on the Affymetrix chip, covering 35% of all probesets.
Through-out this paper, the terms“geneset”and“pathway”are used
interchangeably.
Preprocessing
TGen samples were quantile normalized and background adjusted with Probe Logarithmic Intensity Error using Affymetrix Power Tools Version 1.14.4 [83]. All 144 chips
had high mean inter-array correlation (≥ 0.9). Further
array-level quality checks were performed by visually
inspecting MA plots from Bioconductor’s AffyPLM
pack-age [84]. The TGen data set did not exhibit strong batch effects (Additional file 10), and the case and control groups were balanced for race (Additional file 9). There-fore, we decided not to use batch effect correction such as ComBat [85] because we observed that this can introduce bias to the data. However, we noticed that TGen data set contained a group of samples that were outliers in almost every pathway. These samples also correlated with the first surrogate variable from Surrogate Variable Analysis [86], indicating that they were technical outliers. We defined
“total outlier” samples as the top 90th percentile of the
TGen data set before and after the removal of total outlier samples.
For preprocessing of the Simons data set, we followed the procedure of the original authors [42]. Based on hierarchical clustering using inter array correlation (IAC) as the distance metric, 27 arrays were discarded, leaving 412 (221 case and 191 control). The remaining samples were quantile normalized, and ComBat was performed with the default parameters to reduce batch effects. We then fit the data set to a linear model with collection batch, sex, and age as independent variables and kept the residual values. See Additional file 10 for PCA plots of the Simons data set before and after ComBat and linear modeling.
Propensity sampling
To check that our results were not due to the influence of confounders, we performed repeated propensity sam-pling [87]. There was a significant difference in the age distributions of case and control samples in TGen, with cases being younger in general (see Additional file 9). We performed logistic regression of diagnosis on age, and binned the resulting probabilities into five bins. Then we sampled each bin so that numbers of cases and controls were matched. The resulting data set is said to
be “propensity matched”. This procedure was repeated
100 times to include unused samples, and for each iter-ation the reduced data set was run through the rest of the procedure. The resulting p-values were averaged and compared to p-values generated from the full data set.
Mahalanobis distance and outlier vs. non-outlier classification using the chi-squared distribution
We used a similar approach as described in Kong et al. to project samples into dimensionally-reduced geneset subspaces, aggregating the signal at the pathway level to improve robustness to gene level noise [53]. In the sub-set of the expression matrix corresponding to each
geneset, we projected the data onto the space of first n
principal components that account for≥90% of variance
(Figure 4 step 1) [51]. For the TGen data set, raw expres-sion levels, as output by PLIER, were input to PCA. For the Simons data set, residual values after linear modeling were used. In each dimensionally-reduced geneset
sub-space, we calculated each sample’s Mahalanobis distance
to the centroid of all samples, using the Fast Minimum Covariance Determinant algorithm to estimate the robust pooled covariance matrix and centroid [30] (Figure 4 step 2). The Mahalanobis distance formula is:
DMð Þ¼x
ffiffiffiffiffiffiffiffiffiffiffiffiffiffiffiffiffiffiffiffiffiffiffiffiffiffiffiffiffiffiffi
χ‐μ
ð ÞTS‐1ðχ‐μÞ
q
where x is the sample in question,S is the robustly
esti-mated covariance matrix of the pathway subspace, andμ
is the robust mean vector. Performing the Mahalanobis distance calculation for each pathway produced a dis-tance matrix of pathways by samples. Theoretically, the Mahalanobis distance will follow a chi-squared distribu-tion, with the number of degrees of freedom equaling the number of principal components used to calculate the distance. We defined the outlier cutoff as the
stand-ard value
ffiffiffiffiffiffiffiffiffiffiffiffi
χ2
d;:975 q
, the square root of the 97.5thpercentile
of the chi-squared distribution withddegrees of freedom,
generating a binary matrix of pathways by samples where 1/0 represents outlier/non-outlier (Figure 4 step 3). One problem with the Mahalanobis distance is that as the de-gree of freedom increases, samples yield increasingly simi-lar values [24]. We surmount this problem by applying the Mahalanobis distance to a small number of principal com-ponents (typically less than 10) rather than the complete
multidimensional gene space (10–300 genes per pathway).
Selection of significant pathways using Fisher’s exact test
Once we had defined which samples were outliers in each
pathway, we used Fisher’s exact test to select pathways
where outliers were predominantly case or control sam-ples (Figure 4 step 4). Because our tests were symmetric with respect to diagnosis, pathways could be enriched for case or control outliers. The inclusion of control-enriched pathways provided an automatic estimation of the
false-positive rate for pathway detection. Fisher’s test p-values
were transformed to FDR estimates following the q-value method of Storey and Tibshirani [88]. We defined a sig-nificance threshold of FDR < 10% and called any pathway
that passed this threshold“outlier-enriched”.
Pathway-specific differential expression
Differential expression was evaluated for each pathway by comparing outliers in that pathway to the remaining samples (Figure 4 step 5). Multiple probe sets were col-lapsed to the gene level by taking the maximum expressed
probe sets, then Welch’s t-test was then performed on log
(base 2) expression values for each gene. We corrected for multiple comparisons using the q-value FDR estimation with a significance threshold of FDR < 5%.
Group difference comparison
Samples Case Control
Genes
Case Control
kigenes
Principal Components: keep 90% of variance
Case Control
pi PC’s
PC1 PC2
Take Mahalanobis distance (MD) to pooled centroid of cases and controls
Case Control
MD
Pathwayi
Pathwayi
Pathwayi
Pathwayi
Over-expressed
Under-expressed
Step 1: Project into pathway subspaces
Step 2: Mahalanobis distance
Step 3: Apply outlier cutoff
MD contour plot
Step 4: Fisher’s exact test
Chi-squared 97.5%
Outliers
Non-Outliers
Distance
Samples
Non-Outlier
Case
Control
Rank pathways by Fisher’s test p-value
g1 g2 g3 g1
g2
g3
PC1 PC2
MD
Pathwayi
Case Control
Outlier Non-Outlier
All Pathways
P
a
th
w
a
y
s
Samples max
min max
min
Outlier
n1 n2
n3 n4
Case
Outlier Non-Outlier
All Pathways
P
a
thw
a
y
s
Samples
Control
1.
3. 2.
4. 5.
Outlier-enriched Not outlier-enriched
Step 5
:D
i
er
en
ti
a
lex
p
res
si
o
n
an
al
y
si
s
1.
2.
gene list 1
gene list 2
Figure 4Analysis flow chart.In brief, the steps of the method were:1)project samples onto the principal components (PC) of pathway subspaces,2)calculate the 1-dimensional Mahalanobis distance distribution of samples in the PC space of each pathway,3)classify samples as
tests for enrichment of these genes among the MSigDb pathways. We also performed GSEA on all pathways using Gene Pattern [89] with 1000 sample label permu-tations, ranking genes by signal to noise ratio.
Gene-level outlier analysis
We also compared pathway-level outlier analysis to gene-level outlier analysis. The expression set was collapsed to the gene level by taking the maximum probe for each gene. Then, only robustly expressed genes were retained by re-quiring that the log (base 2) expression level be at least 7 for at least 2/3 of samples. We performed this filter for gene-level analysis because low- or un-expressed genes are noisy when examined individually. Next we normalized genes by subtracting the median value and dividing by the median absolute deviation. This scaling method is ideal be-cause it is robust to outlier values. Two classes of outliers were then defined: high-outliers had expression values greater than the median plus the interquartile range (IQR), and low-outliers had expression values less than the median
minus the IQR. Fisher’s exact tests were performed on
con-tingency tables of high- or low-outliers by diagnosis, and
the lower of the two p-values was kept. The Fisher’s exact
tests were one-sided for ASD specificity. P-values were ad-justed for multiple hypothesis testing using the q-value FDR estimation. Pathway enrichment was calculated for these outlier genes using hypergeometric tests on the MSigDB pathways.
Unless otherwise specified, all calculations were performed in R version 2.14. A complete R script is available from the authors upon request.
Additional files
Additional file 1:Results from propensity sampling, with p-values averaged over 100 trials.
Additional file 2:3D PCA of neuron development pathway in TGen.
The percent of variance captured by each principal component is shown.
Additional file 3:Differentially expressed genes for each TGen subgroup.
Additional file 4:Results from group difference methods (hypergeometric tests, GSEA) for TGen.
Additional file 5:Overrepresented pathways from gene-level outlier analysis of TGen data set.
Additional file 6:Outlier-enriched pathways (uncorrected p-value < 0.05) from the Simons data set.
Additional file 7:Differentially expressed genes for the Simons neurogenesis subgroup.
Additional file 8:Results from the Simons data set with McNemar’s test on sibling/proband pairs substituted for Fisher’s test.
Additional file 9:Phenotype information for the TGen and Simons data sets.
Additional file 10:Microarray preprocessing.TGen before (A) and after (B) removal of total outliers. Batch effects were not significant in TGen (C). Simons data set before (D) and after (E) ComBat and linear modeling.
Competing interests
The authors declare no conflicts of interest.
Authors’contributions
ISK and SWK conceived of the project; SWK and MGC designed the method; MGC performed the analysis; all authors contributed to writing and reviewing the manuscript. All authors read and approved the final manuscript.
Acknowledgments
ISK and SWK are supported in part by NIMH P50MH094267, NIMH R01MH085143, and NHGRI U01HG006500.
Author details
1Center for Biomedical Informatics, Harvard Medical School, 10 Shattuck
Street, Boston, MA 02115, USA.2Informatics Program, Children’s Hospital Boston, 300 Longwood Avenue, Boston, MA 02115, USA.3Current address:
Stanford Neuroscience Program, Stanford University, Stanford CA94305, USA. Received: 16 October 2012 Accepted: 20 September 2013
Published: 24 September 2013
References
1. Manolio TA, Collins FS, Cox NJ, Goldstein DB, Lucia A, Hunter DJ, Mccarthy MI, Ramos EM, Cardon LR, Cho JH, Guttmacher AE, Kong A, Kruglyak L, Mardis E, Rotimi CN, Slatkin M, Valle D, Alice S, Boehnke M, Clark AG, Eichler EE, Gibson G:Finding the missing heritability of complex diseases.
Nature2009,461:747–753.
2. McClellan J, King M:Genetic heterogeneity in human disease.Cell2010, 141:210–217.
3. Bautista JF, Kelly JA, Harley JB, Gray-McGuire C:Addressing genetic heterogeneity in complex disease: finding seizure genes in systemic lupus erythematosus.Epilepsia2008,49:527–530.
4. Gatza ML, Lucas JE, Barry WT, Kim JW, Wang Q, Crawford MD, Datto MB, Kelley M, Mathey-Prevot B, Potti A, Nevins JR:A pathway-based classification of human breast cancer.Proc Natl Acad Sci USA2010, 107:6994–6999.
5. Kim S, Kon M, Delisi C:Pathway-based classification of cancer subtypes.
Biol Direct2012,7:21.
6. Abrahams BS, Geschwind DH:Advances in autism genetics: on the threshold of a new neurobiology.Nat Rev Genet2008,9:341–355. 7. Levy D, Ronemus M, Yamrom B, Lee Y, Leotta A, Kendall J, Marks S, Lakshmi
B, Pai D, Ye K, Buja A, Krieger A, Yoon S, Troge J, Rodgers L, Iossifov I, Wigler M:Rare de novo and transmitted copy-number variation in autistic spectrum disorders.Neuron2011,70:886–897.
8. Glessner JT, Wang K, Cai G, Korvatska O, Kim CE, Wood S, Zhang H, Estes A, Brune CW, Bradfield JP, Imielinski M, Frackelton EC, Reichert J, Crawford EL, Munson J, Sleiman PMA, Chiavacci R, Annaiah K, Thomas K, Hou C, Glaberson W, Flory J, Otieno F, Garris M, Soorya L, Klei L, Piven J, Meyer KJ, Anagnostou E, Sakurai T,et al:Autism genome-wide copy number variation reveals ubiquitin and neuronal genes.Nature2009,459:569–573. 9. Sanders SJ, Ercan-Sencicek AG, Hus V, Luo R, Murtha MT, Moreno-De-Luca
D, Chu SH, Moreau MP, Gupta AR, Thomson SA, Mason CE, Bilguvar K, Celestino-Soper PBS, Choi M, Crawford EL, Davis L, Wright NRD, Dhodapkar RM, DiCola M, DiLullo NM, Fernandez TV, Fielding-Singh V, Fishman DO, Frahm S, Garagaloyan R, Goh GS, Kammela S, Klei L, Lowe JK, Lund SC: Multiple recurrent de novo CNVs, including duplications of the 7q11.23 Williams syndrome region, are strongly associated with autism.
Neuron2011,70:863–885.
10. Sebat J, Lakshmi B, Malhotra D, Troge J, Lese- C, Walsh T, Yamrom B, Yoon S, Krasnitz A, Kendall J, Leotta A, Pai D, Zhang R, Lee Y, Hicks J, Sarah J, Lee AT, Puura K, Lehtimäki T, Ledbetter D, Peter K, Bregman J, Sutcliffe JS, Jobanputra V, Chung W, Warburton D, King M, Skuse D, Geschwind DH, Gilliam C:Strong association of de novo copy number mutations with autism.Science2007,316:445–449.
Mapping autism risk loci using genetic linkage and chromosomal rearrangements.Nat Genet2007,39:319–328.
12. Pinto D, Pagnamenta AT, Klei L, Anney R, Merico D, Regan R, Conroy J, Magalhaes TR, Correia C, Abrahams BS, Almeida J, Bacchelli E, Bader GD, Bailey AJ, Baird G, Battaglia A, Berney T, Bolshakova N, Bölte S, Bolton PF, Bourgeron T, Brennan S, Brian J, Bryson SE, Carson AR, Casallo G, Casey J, Chung BHY, Cochrane L, Corsello C,et al:Functional impact of global rare copy number variation in autism spectrum disorders.Nature2010, 466:368–372.
13. Marshall CR, Noor A, Vincent JB, Lionel AC, Feuk L, Skaug J, Shago M, Moessner R, Pinto D, Ren Y, Thiruvahindrapduram B, Fiebig A, Schreiber S, Friedman J, Ketelaars CEJ, Vos YJ, Ficicioglu C, Kirkpatrick S, Nicolson R, Sloman L, Summers A, Gibbons CA, Teebi A, Chitayat D, Weksberg R, Thompson A, Vardy C, Crosbie V, Luscombe S, Baatjes R:Structural Variation of Chromosomes in Autism Spectrum Disorder.
Am J Hum Genet2008,82:477–488.
14. Enstrom AM, Lit L, Onore CE, Gregg JP, Hansen RL, Pessah IN, Hertz-Picciotto I, Van de Water J a, Sharp FR, Ashwood P:Altered gene expression and function of peripheral blood natural killer cells in children with autism.Brain Behav Immun2009,23:124–133. 15. Garbett K, Ebert PJ, Mitchell A, Lintas C, Manzi B, Mirnics K, Persico AM:
Immune transcriptome alterations in the temporal cortex of subjects with autism.Neurobiol Dis2008,30:303–311.
16. Gregg JP, Lit L, Baron CA, Hertz-Picciotto I, Walker W, Davis RA, Croen LA, Ozonoff S, Hansen R, Pessah IN, Sharp FR:Gene expression changes in children with autism.Genomics2008,91:22–29.
17. Hu VW, Frank BC, Heine S, Lee NH, Quackenbush J:Gene expression profiling of lymphoblastoid cell lines from monozygotic twins discordant in severity of autism reveals differential regulation of neurologically relevant genes.BMC Genomics2006,7:118.
18. Hu VW, Sarachana T, Kim KS, Nguyen A, Kulkarni S, Steinberg ME, Luu T, Lai Y, Lee NH:Gene expression profiling differentiates autism case-controls and phenotypic variants of autism spectrum disorders: evidence for circadian rhythm dysfunction in severe autism.Autism Res2009,2:78–97. 19. Nishimura Y, Martin CL, Vazquez-Lopez A, Spence SJ, Alvarez-Retuerto AI,
Sigman M, Steindler C, Pellegrini S, Schanen NC, Warren ST, Geschwind DH: Genome-wide expression profiling of lymphoblastoid cell lines distinguishes different forms of autism and reveals shared pathways.
Hum Mol Genet2007,16:1682–1698.
20. Purcell AE, Jeon OH, Zimmerman AW, Blue ME, Pevsner J:Postmortem brain abnormalities of the glutamate neurotransmitter system in autism.
Neurology2001,57:1618–1628.
21. Voineagu I, Wang X, Johnston P, Lowe JK, Tian Y, Horvath S, Mill J, Cantor RM, Blencowe BJ, Geschwind DH:Transcriptomic analysis of autistic brain reveals convergent molecular pathology.Nature2011,474:380–384. 22. Glatt SJ, Tsuang MT, Winn M, Chandler SD, Collins M, Lopez L, Weinfeld M,
Carter C, Schork N, Pierce K, Courchesne E:Blood-based gene expression signatures of infants and toddlers with autism.J Am Acad Child Adolesc Psychiatry2012,51:934–944. e2.
23. Hawkins DM:Identification of Outliers. London: Chapman and Hall; 1980. 24. Kriegel HP, Kröger P, Schubert E, Zimek A:Outlier detection in axis-parallel
subspaces of high dimensional data. InAdvances in Knowledge Discovery and Data Mining.Edited by Theeramunkong T, Kijsirikul B, Cercone N, Ho TB. Berlin: Springer; 2009:831–838.
25. Ruts I, Rousseeuw PJ:Computing depth contours of bivariate point clouds.Comput Stat Data An1996,23:153–168.
26. Arning A, Agrawal R, Raghavan P:A linear method for deviation detection in large databases. InProceedings of the International Conference on Knowledge Discovery and Data Mining: 4-8 August 1996; Portland.Edited by Simoudis E, Han J, Fayyad U. California: AAAI Press; 1996:164–169. 27. Knorr EM, Ng RT:A unified approach for mining outliers. InProceedings of
Proceedings of the 1997 conference of the Centre for Advanced Studies on Collaborative research: November 10-13 1997: Toronto.Edited by Knorr EM, Ng RT. Toronto, Ontario, Canada: IBM Press; 1997:11–23.
28. Breunig MM, Kriegel HP, Ng RT, Sander J:LOF: identifying density-based local outliers. InProceedings of the 2000 ACM SIGMOD international conference on Management of data: May 16-18, 2000: Dallas, Texas.Edited by Chen W, Naughton JF, Bernstein PA. New York, NY: ACM; 2000:93–104. 29. Breunig M, Kriegel H, Ng R, Sander J:OPTICS-OF: identifying local outliers.
InProceedings of European Conference on Principles of Data Mining and Knowledge Discovery: September 15-18, 1999: Prague, Czech Republic.Edited byŻytkow JM, Rauch J. Berlin: Springer; 1999:262–270.
30. Driessen K Van, Rousseeuw P:Fast algorithm for the minimum covariance determinant.Technometrics1999,41:212–223.
31. Tan X, Liu J, Chen S:Sub-intrapersonal space analysis for face recognition.
Neurocomputing2006,69:1796–1801.
32. Jamdagnil A, Tan Z, Nanda P, He X, Liu RP:Mahalanobis Distance Map Approach for Anomaly Detection. InProceedings of 8th Australian Information Security Management Conference: November 30, 2010: Perth, Australia.Edited by School of Computer and Information Science, Edith Cowan University, Perth, Western Australia; 2010:8–15.
33. Rousseeuw PJ, Leroy AM:Robust Regression and Outlier Detection.New York: Wiley; 1987.
34. Tomlins SA, Rhodes DR, Perner S, Dhanasekaran SM, Mehra R, Sun X-W, Varambally S, Cao X, Tchinda J, Kuefer R, Lee C, Montie JE, Shah RB, Pienta KJ, Rubin MA, Chinnaiyan AM:Recurrent fusion of TMPRSS2 and ETS transcription factor genes in prostate cancer.Science2005,310:644–648. 35. MacDonald JW, Ghosh D:COPA: Cancer outlier profile analysis.
Bioinformatics2006,22:2950–2951.
36. Tibshirani R, Hastie T:Outlier sums for differential gene expression analysis.Biostatistics2007,8:2–8.
37. Wu B:Cancer outlier differential gene expression detection.Biostatistics
2007,8:566–575.
38. Hu J:Cancer outlier detection based on likelihood ratio test.
Bioinformatics2008,24:2193–2199.
39. Lian H:MOST: detecting cancer differential gene expression.Biostatistics
2008,9:411–418.
40. Ghosh D, Chinnaiyan AM:Genomic outlier profile analysis: mixture models, null hypotheses, and nonparametric estimation.Biostatistics2009, 10:60–69.
41. Mpindi JP, Sara H, Haapa-Paananen S, Kilpinen S, Pisto T, Bucher E, Ojala K, Iljin K, Vainio P, Björkman M, Gupta S, Kohonen P, Nees M, Kallioniemi O:GTI: a novel algorithm for identifying outlier gene expression profiles from integrated microarray datasets.PloS one2011,6:e17259.
42. Luo R, Sanders SJ, Tian Y, Voineagu I, Huang N, Chu SH, Klei L, Cai C, Ou J, Lowe JK, Hurles ME, Devlin B, State MW, Geschwind DH:Genome-wide Transcriptome Profiling Reveals the Functional Impact of Rare De Novo and Recurrent CNVs in Autism Spectrum Disorders.Am J Hum Genet
2012,91:38–55.
43. Loscalzo J, Kohane I, Barabasi A-L:Human disease classification in the postgenomic era: a complex systems approach to human pathobiology.
Molecular systems biology2007,3:124.
44. Ashburner M, Ball C, Blake J, Botstein D, Butler H, Cherry J, Davis A, Dolinski K, Dwight S, Eppig J, Harris M, Hill D, Issel-Tarver L, Kasarkis A, Lewis S, Matese J, Richardson J, Ringwald M, Rubin G, Sherlock G:Gene Ontology: tool for the unification of biology.Nat Genet2000,25:25–29. 45. Kanehisa M, Goto S:KEGG: kyoto encyclopedia of genes and genomes.
Nucleic Acids Res2000,28:27–30.
46. Kanehisa M, Goto S, Sato Y, Furumichi M, Tanabe M:KEGG for integration and interpretation of large-scale molecular data sets.
Nucleic Acids Res2012,40:D109–D114.
47. Matthews L, Gopinath G, Gillespie M, Caudy M, Croft D, De Bono B, Garapati P, Hemish J, Hermjakob H, Jassal B, Kanapin A, Lewis S, Mahajan S, May B, Schmidt E, Vastrik I, Wu G, Birney E, Stein L, D’Eustachio P:Reactome knowledgebase of human biological pathways and processes.
Nucleic Acids Res2009,37:D619–D622.
48. Subramanian A, Tamayo P, Mootha VK, Mukherjee S, Ebert BL, Gillette MA, Paulovich A, Pomeroy SL, Golub TR, Lander ES, Mesirov JP:Gene set enrichment analysis: a knowledge-based approach for interpreting genome-wide expression profiles.Proc Natl Acad Sci USA2005, 102:15545–15550.
49. O’Roak BJ, Vives L, Girirajan S, Karakoc E, Krumm N, Coe BP, Levy R, Ko A, Lee C, Smith JD, Turner EH, Stanaway IB, Vernot B, Malig M, Baker C, Reilly B, Akey JM, Borenstein E, Rieder MJ, Nickerson DA, Bernier R, Shendure J, Eichler EE:Sporadic autism exomes reveal a highly interconnected protein network of de novo mutations.Nature2012,485:246–250. 50. Sanders SJ, Murtha MT, Gupta AR, Murdoch JD, Raubeson MJ, Willsey AJ,
51. Valle S, Li W, Qin SJ:Selection of the number of principal components: The variance of the reconstruction error criterion with a comparison to other methods.Ind Eng Chem Res1999,38:4389–4401.
52. Garcia H, Filzmoser P:Multivariate Statistical Analysis using the R package chemometrics.Vienna: Austria; 2011.
53. Kong SW, Pu WT, Park PJ:A multivariate approach for integrating genome-wide expression data and biological knowledge.
Bioinformatics2006,22:2373–2380.
54. Basu SN, Kollu R, Banerjee-Basu S:AutDB: a gene reference resource for autism research.Nucleic Acids Res2009,37:D832–D836.
55. Feinstein Y, Borrell V, Garcia C, Burstyn-Cohen T, Tzarfaty V, Frumkin A, Nose A, Okamoto H, Higashijima S, Soriano E, Klar A:F-spondin and mindin: two structurally and functionally related genes expressed in the
hippocampus that promote outgrowth of embryonic hippocampal neurons.Development1999,126:3637–3648.
56. Berg JM, Geschwind DH:Autism genetics: searching for specificity and convergence.Genome Biol2012,13:247.
57. Kang E, Burdick KE, Kim JY, Duan X, Guo JU, Sailor KA, Jung D-E, Ganesan S, Choi S, Pradhan D, Lu B, Avramopoulos D, Christian K, Malhotra AK, Song H, Ming G:Interaction between FEZ1 and DISC1 in regulation of neuronal development and risk for schizophrenia.Neuron2011,72:559–571. 58. Kilpinen H, Ylisaukko-Oja T, Hennah W, Palo OM, Varilo T, Vanhala R,
Nieminen-von Wendt T, Von Wendt L, Paunio T, Peltonen L:Association of DISC1 with autism and Asperger syndrome.Mol Psychiatry2008, 13:187–196.
59. Boyce BF, Xing L:Biology of RANK, RANKL, and osteoprotegerin.
Arthritis Res Ther2007,9(Suppl 1):S1.
60. Takayanagi H, Kim S, Matsuo K, Suzuki H, Suzuki T, Sato K, Yokochi T, Oda H, Nakamura K, Ida N, Wagner EF, Taniguchi T:RANKL maintains bone homeostasis through c-Fos-dependent induction of interferon-beta.
Nature2002,416:744–749.
61. Courchesne E, Carper R, Akshoomoff N:Evidence of brain overgrowth in the first year of life in autism.JAMA: J Am Med Assoc2003,290:337–344. 62. Redcay E, Courchesne E:When is the brain enlarged in autism? A
meta-analysis of all brain size reports.Biol Psychiatry2005,58:1–9.
63. Sacco R, Militerni R, Frolli A, Bravaccio C, Gritti A, Elia M, Curatolo P, Manzi B, Trillo S, Lenti C, Saccani M, Schneider C, Melmed R, Reichelt K-L, Pascucci T, Puglisi-Allegra S, Persico AM:Clinical, morphological, and biochemical correlates of head circumference in autism.Biol Psychiatry2007,62:1038–1047. 64. Casanova MF, Van Kooten I a J, Switala AE, Van Engeland H, Heinsen H,
Steinbusch HWM, Hof PR, Trippe J, Stone J, Schmitz C:Minicolumnar abnormalities in autism.Acta neuropathologica2006,112:287–303. 65. Barnea-Goraly N, Kwon H, Menon V, Eliez S, Lotspeich L, Reiss AL:White
matter structure in autism: preliminary evidence from diffusion tensor imaging.Biol Psychiatry2004,55:323–326.
66. Alexander AL, Lee JE, Lazar M, Boudos R, DuBray MB, Oakes TR, Miller JN, Lu J, Jeong E-K, McMahon WM, Bigler ED, Lainhart JE:Diffusion tensor imaging of the corpus callosum in Autism.Neuroimage2007,34:61–73. 67. Courchesne E, Pierce K:Why the frontal cortex in autism might be
talking only to itself: local over-connectivity but long-distance disconnection.Curr Opin Neurobiol2005,15:225–230.
68. Scott-Van Zeeland AA, Abrahams BS, Alvarez-Retuerto AI, Sonnenblick LI, Rudie JD, Ghahremani D, Mumford JA, Poldrack RA, Dapretto M, Geschwind DH, Bookheimer SY:Altered functional connectivity in frontal lobe circuits is associated with variation in the autism risk gene CNTNAP2.Sci Transl Med2010,2:56ra80.
69. Gibson JR, Bartley AF, Hays SA, Huber KM:Imbalance of neocortical excitation and inhibition and altered UP states reflect network hyperexcitability in the mouse model of fragile X syndrome.
J Neurophysiol2008,100:2615–2626.
70. Hines RM, Wu L, Hines DJ, Steenland H, Mansour S, Dahlhaus R, Singaraja RR, Cao X, Sammler E, Hormuzdi SG, Zhuo M, El-Husseini A:Synaptic imbalance, stereotypies, and impaired social interactions in mice with altered neuroligin 2 expression.J Neurosci2008,28:6055–6067. 71. Olmos-Serrano JL, Paluszkiewicz SM, Martin BS, Kaufmann WE, Corbin JG,
Huntsman MM:Defective GABAergic neurotransmission and
pharmacological rescue of neuronal hyperexcitability in the amygdala in a mouse model of fragile X syndrome.J Neurosci2010,30:9929–9938. 72. Tabuchi K, Blundell J, Etherton MR, Hammer RE, Liu X, Powell CM, Südhof
TC:A neuroligin-3 mutation implicated in autism increases inhibitory synaptic transmission in mice.Science2007,318:71–76.
73. Jamain S, Betancur C, Quach H, Philippe A, Fellous M, Giros B, Gillberg C, Leboyer M:Linkage and association of the glutamate receptor 6 gene with autism.Mol Psychiatry2002,7:302–310.
74. Iossifov I, Ronemus M, Levy D, Wang Z, Hakker I, Rosenbaum J, Yamrom B, Lee Y-H, Narzisi G, Leotta A, Kendall J, Grabowska E, Ma B, Marks S, Rodgers L, Stepansky A, Troge J, Andrews P, Bekritsky M, Pradhan K, Ghiban E, Kramer M, Parla J, Demeter R, Fulton LL, Fulton RS, Magrini VJ, Ye K, Darnell JC, Darnell RB,et al:De novo gene disruptions in children on the autistic spectrum.Neuron2012,74:285–299.
75. Splawski I, Yoo DS, Stotz SC, Cherry A, Clapham DE, Keating MT:CACNA1H mutations in autism spectrum disorders.J Biol Chem2006,
281:22085–22091.
76. Splawski I, Timothy KW, Sharpe LM, Decher N, Kumar P, Bloise R, Napolitano C, Schwartz PJ, Joseph RM, Condouris K, Tager-Flusberg H, Priori SG, Sanguinetti MC, Keating MT:Ca(V)1.2 calcium channel dysfunction causes a multisystem disorder including arrhythmia and autism.Cell2004, 119:19–31.
77. Kim HG, Kishikawa S, Higgins AW, Seong I, Donovan DJ, Shen Y, Lally E, Weiss LA, Najm J, Kutsche K, Descartes M, Holt L, Braddock S, Troxell R, Kaplan L, Volkmar F, Klin A, Tsatsanis K, Harris DJ, Noens I, Pauls DL, Daly MJ, Macdonald ME, Morton CC, Quade BJ, Gusella JF:Disruption of Neurexin 1 associated with autism spectrum disorder.Am J Hum Genet2008,82:199–207.
78. Etherton MR, Blaiss CA, Powell CM, Su TC:Mouse neurexin-1 deletion causes correlated electrophysiological and behavioral changes.
Proc Natl Acad Sci USA2009,106:17998–18003.
79. DiCicco-Bloom E, Lord C, Zwaigenbaum L, Courchesne E, Dager SR, Schmitz C, Schultz RT, Crawley J, Young LJ:The developmental neurobiology of autism spectrum disorder.J Neurosci2006,26:6897–6906.
80. Curtis C, Shah SP, Chin S-F, Turashvili G, Rueda OM, Dunning MJ, Speed D, Lynch AG, Samarajiwa S, Yuan Y, Gräf S, Ha G, Haffari G, Bashashati A, Russell R, McKinney S, Langerød A, Green A, Provenzano E, Wishart G, Pinder S, Watson P, Markowetz F, Murphy L, Ellis I, Purushotham A, Børresen-Dale A-L, Brenton JD, Tavaré S, Caldas C,et al:The genomic and transcriptomic architecture of 2,000 breast tumours reveals novel subgroups.
Nature2012,486:346–352.
81. Neale BM, Kou Y, Liu L, Ma’ayan A, Samocha KE, Sabo A, Lin C-F, Stevens C, Wang L-S, Makarov V, Polak P, Yoon S, Maguire J, Crawford EL, Campbell NG, Geller ET, Valladares O, Schafer C, Liu H, Zhao T, Cai G, Lihm J, Dannenfelser R, Jabado O, Peralta Z, Nagaswamy U, Muzny D, Reid JG, Newsham I, Wu Y,et al:Patterns and rates of exonic de novo mutations in autism spectrum disorders.Nature2012, 485:242–245.
82. Alter MD, Kharkar R, Ramsey KE, Craig DW, Melmed RD, Grebe TA, Bay RC, Ober-Reynolds S, Kirwan J, Jones JJ, Turner JB, Hen R, Stephan DA:Autism and increased paternal age related changes in global levels of gene expression regulation.PloS one2011,6:e16715.
83. Affymetrix:Guide to Probe Logarithmic Intensity Error (PLIER). In
Affymetrix Technical Note. Guide to Probe Logarithmic Intensity Error; [http:// media.affymetrix.com/support/technical/technotes/plier_technote.pdf] 84. Bolstad B, Collin F, Brettschneider J, Simpson K, Cope L, Irizarry R, Speed T:
Quality Assessment of Affymetrix GeneChip Data. InBioinformatics and Computational Biology Solutions Using R and Bioconductor.Edited by Gentleman R, Carey V, Huber W, Irizarry R, Dudoit S. New York: Springer; 2005.
85. Johnson WE, Li C, Rabinovic A:Adjusting batch effects in microarray expression data using empirical Bayes methods.Biostatistics2007, 8:118–127.
86. Leek JT, Storey JD:Capturing heterogeneity in gene expression studies by surrogate variable analysis.PLoS genetics2007,3:1724–1735. 87. Rosenbaum PR, Rubin DB:The central role of the propensity score in
observational studies for causal effects.Biometrika1983,70:41–55. 88. Storey JD, Tibshirani R:Statistical significance for genomewide studies.
Proc Natl Acad Sci USA2003,100:9440–9445.
89. Reich M, Liefeld T, Gould J, Lerner J, Tamayo P, Mesirov J:GenePattern 2.0.
Nat Genet2006,38:500–501.
doi:10.1186/1755-8794-6-34
![Figure 4 Analysis flow chart. In brief, the steps of the method were: 1) project samples onto the principal components (PC) of pathwaysubspaces, 2) calculate the 1-dimensional Mahalanobis distance distribution of samples in the PC space of each pathway, 3) classify samples as“outliers” or “non-outliers” in each pathway based on the 97.5th percentile of the chi-squared distribution, 4) employ Fisher’s exact test to identifypathways that are specifically enriched for case or control outliers, using the False Discovery Rate (FDR) q-value of Storey and Tibshirani to correctfor multiple hypothesis testing [88], 5) for each subgroup of samples corresponding to the outliers in a candidate pathway, perform standarddifferential expression analysis to determine the genes responsible for the grouping.](https://thumb-us.123doks.com/thumbv2/123dok_us/8998236.1892819/12.595.54.539.87.640/pathwaysubspaces-mahalanobis-distribution-distribution-identifypathways-specifically-corresponding-standarddifferential.webp)
