https://doi.org/10.5194/gmd-11-2825-2018 © Author(s) 2018. This work is distributed under the Creative Commons Attribution 4.0 License.
TOAST 1.0: Tropospheric Ozone Attribution of Sources with
Tagging for CESM 1.2.2
Tim Butler1, Aurelia Lupascu1, Jane Coates1, and Shuai Zhu1,a 1Institute for Advanced Sustainability Studies, Potsdam, Germany
anow at: China Unicom System Integration Limited Corporation, Beijing, China Correspondence:Tim Butler ([email protected])
Received: 26 February 2018 – Discussion started: 12 March 2018
Revised: 5 June 2018 – Accepted: 13 June 2018 – Published: 13 July 2018
Abstract. A system for source attribution of tropospheric ozone produced from both NOx and volatile organic
com-pound (VOC) precursors is described, along with its imple-mentation in the Community Earth System Model (CESM) version 1.2.2 using CAM4. The user can specify an arbitrary number of tag identities for each NOxor VOC species in the
model, and the tagging system rewrites the model chemical mechanism and source code to incorporate tagged tracers and reactions representing these tagged species, as well as ozone produced in the stratosphere. If the user supplies emission files for the corresponding tagged tracers, the model will pro-duce tagged ozone tracers which represent the contribution of each of the tag identities to the modelled total tropospheric ozone. Our tagged tracers preserve Ox. The size of the tagged
chemical mechanism scales linearly with the number of spec-ified tag identities. Separate simulations are required for NOx
and VOC tagging, which avoids the sharing of tag identi-ties between NOx and VOC species. Results are presented
and evaluated for both NOx and VOC source attribution.
We show that northern hemispheric surface ozone is dom-inated year-round by anthropogenic emissions of NOx, but
that the mix of corresponding VOC precursors changes over the course of the year; anthropogenic VOC emissions con-tribute significantly to surface ozone in winter–spring, while biogenic VOCs are more important in summer. The system described here can provide important diagnostic information about modelled ozone production, and could be used to con-struct source–receptor relationships for tropospheric ozone.
1 Introduction
Tropospheric ozone is an important air pollutant, as well as a contributor to anthropogenic radiative forcing of the climate (Monks et al., 2015). Major sources of ozone in the tropo-sphere are transport from the stratotropo-sphere, and photochemi-cal production involving reactions of oxides of nitrogen (NO and NO2, collectively NOx) and volatile organic compounds
(VOCs), including methane. Almost all of this photochemi-cal production is related to the conversion of NO to NO2by reaction with a peroxy radical produced during the oxidation of VOCs (Atkinson, 2000). Due to its long lifetime in the troposphere (several weeks), ozone can be transported over intercontinental distances. Concentrations of ozone observed at any given location can be due to both transported ozone from elsewhere and ozone produced from precursors emitted nearby.
models show differing sensitivities in tropospheric ozone to changes in both climate and precursor emissions. In a more detailed comparison of the ACCMIP models with observed datasets, Parrish et al. (2014) showed that the models are not able to simulate the observed long-term changes in tropo-spheric ozone, and concluded that more work is needed to improve the representation of chemistry and transport pro-cesses in models, as well as our understanding of histori-cal emission changes, before the models could be reliably used to simulate future changes in tropospheric ozone. Young et al. (2013) identified the need for improved diagnostic in-formation about modelled ozone budgets in order to under-stand the differences among models.
Intercontinental source–receptor relationships for tropo-spheric ozone have been modelled in the HTAP (Hemi-spheric Transport of Air Pollution) project using a pertur-bation methodology in which emissions of ozone precursors in source regions are reduced by some fraction (e.g. 20 %), and the resulting modelled ozone concentrations in recep-tor regions are compared with a base simulation in which the emissions were not perturbed (Fiore et al., 2009). An alternative approach for determining source–receptor rela-tionships in model runs is a technique known as “tagging”, in which ozone molecules are labelled with the identity of their source, allowing direct attribution of ozone concentra-tions to these sources in receptor regions (e.g. Wang et al., 1998; Dunker et al., 2002; Sudo and Akimoto, 2007; Grewe et al., 2010, 2017; Emmons et al., 2012; Derwent et al., 2015; Kwok et al., 2015; Guo et al., 2017). Tagging (source appor-tionment) methodologies are complementary to perturbation (sensitivity) methodologies (Emmons et al., 2012; Grewe et al., 2017; Clappier et al., 2017). While tagging approaches produce information about the contribution of different pre-cursors to the total amount of ozone in a simulation, pertur-bation approaches produce information about the response of ozone in a simulation to changes in emissions. Grewe et al. (2017) showed that when individual emission sources are perturbed, the contribution of other sources to the total amount of modelled ozone can also change. A combination of the perturbation and tagging methodologies can provide information about these changes in source contributions un-der perturbed emission scenarios. Since tagging methods can deliver detailed information about the provenance of mod-elled ozone concentrations, they could potentially also be a useful tool for understanding the differences among models. In this paper we describe and characterize a novel method for tagged source attribution of tropospheric ozone and con-trast our approach with previous work. We present a review of prior tagging approaches in Sect. 2, then describe the implementation of our method in CESM 1.2.2 with CAM4 (Tilmes et al., 2015; Lamarque et al., 2012) in Sect. 3. The design of our model evaluation experiments is described in Sect. 4, and we evaluate and compare the results for both NOx and VOC tagging in Sect. 5. Conclusions and outlook
are presented in Sect. 6.
2 Review of tagging methods
There are many different examples of several different ap-proaches to ozone tagging in both regional and global mod-els. In this study, we focus on the attribution of ozone pro-duction to emitted precursors. Studies such as Wang et al. (1998), Sudo and Akimoto (2007), and Derwent et al. (2015) each tag ozone molecules based on the geographical model domains in which the ozone molecules are formed; thus they do not directly attribute chemical ozone production to emis-sions of particular precursors, and will not be discussed fur-ther here.
Attribution of ozone production to emissions in models of atmospheric chemistry involves several design decisions and associated trade-offs:
– Is ozone production attributed to emissions of NOx,
VOC, or both? And if both, how is the chemical regime (NOxor VOC limited) accounted for?
– Is ozone production attributed explicitly for each chem-ical reaction producing ozone, or is the total instanta-neous ozone production in each grid cell attributed ac-cording to the proportion of each precursor present? – Are tagged precursor species simulated explicitly, or are
they grouped into chemical “families”?
– How does the tagging system treat the O3–NOx null
chemical cycle?
Since both NOx and VOC are involved in the chemical
production of ozone, most tagging schemes attempt to at-tribute ozone production to both of these types of precursors. Two approaches for simultaneous attribution of ozone to both NOx and VOC have been used: determination of the
chem-ical regime with attribution to the limiting precursor (either NOx or VOC) and equal attribution to both NOx and VOC
precursors. In each case, additional tracers are added to the model, and track the emissions of NOx and VOC species,
which are typically labelled with the identities of their source sectors (e.g. transport, industry) or source regions (e.g. East Asia, North America).
Determination of the chemical regime is typically made according to the indicator ratio PH2O2/PHNO3 (the ratio between the production rates of hydrogen peroxide and ni-tric acid). According to Sillman (1995) the chemical regime is NOx or VOC limited if the ratio of total peroxide
(hy-drogen peroxide plus organic peroxides) production to nitric acid production is above or below 0.5, respectively, but that the PH2O2/PHNO3ratio can be used with a threshold value of 0.35 as an approximation for the chemical regime transi-tion. This approach somewhat simplifies the highly complex chemistry of ozone production, in which there is a transition regime of sensitivity to both NOx and VOC emissions. This
global models). VOC-limited chemical regimes are typically found in regions of very high NOxemissions, such as urban
areas, which are not well resolved by global models. Dunker et al. (2002) and Kwok et al. (2015) describe the use of this technique in the regional models CAMx and CMAQ, respec-tively. In both cases, the tagging scheme determines whether ozone production in each model grid cell is in a NOx-limited
or a VOC-limited chemical regime, and attributes all in-stantaneous ozone production to the limiting precursor, with tagged ozone tracers added in proportion to the relative con-centrations of the tagged precursor tracers present in that grid cell. Tagged ozone tracers are chemically destroyed accord-ing to the modelled instantaneous ozone chemical loss rate. Such tagging schemes account for the rapid null cycles in-volving Oxspecies by not considering their cycling reactions
as part of the instantaneous ozone production or loss rates. We are not aware of any global modelling study which has attempted to attribute ozone production to NOxor VOC
pre-cursors based on the chemical regime in each grid cell. In-stead, ozone tagging at the global scale has been performed either by focusing on only NOx precursors (e.g. Emmons
et al., 2012) or by giving equal weight to both NOxand VOC
precursors (e.g. Grewe et al., 2010, 2017; Guo et al., 2017). Grewe et al. (2010, 2017) use a similar approach to Dunker et al. (2002) and Kwok et al. (2015) in that they make use of the instantaneous ozone production rate modelled at each time step to determine the production rate of tagged ozone, but instead of allocating this ozone production to either NOx
or VOC based on the determination of a chemical regime, the tagged ozone molecules inherit their tag identities from a combination of both tagged NOx and VOC depending on
their abundances relative to the total amount of NOx and
VOC present in each grid cell at each time step. Emmons et al. (2012) and Guo et al. (2017) take a different approach, and add extra reactions to the base chemical mechanism rep-resenting the transformations of the tagged precursors and the production of tagged ozone, relying instead on the chem-ical solver of their model to calculate the production and loss rates of tagged species.
Similar to Grewe et al. (2010, 2017), Guo et al. (2017) also take a combinatorial approach to the simultaneous attribution of tagged ozone to both NOx- and VOC-tagged precursors.
They avoid the chemical mechanism becoming too large by only considering two tag identities (“East Asia” (EA) and “everywhere else” (EE)). Each reaction between a peroxy radical and NO then requires four corresponding tagged reac-tions: EA+EA, EA+EE, EE+EA, and EE+EE. The size of their tagged mechanism thus increases quadratically with the number of tag identities. In the case of the cross reac-tions (EA+EE and EE+EA), the NO2produced from the reaction between NO and a peroxy radical is split into equal parts NO2from EA and NO2from EE, despite the fact that the NO reactant in any given reaction can only have come from one of these regions. By using such a combinatorial ap-proach, Grewe et al. (2010, 2017) and Guo et al. (2017) allow
the transfer of tag identities between NOxand VOC species,
which can produce tagged tracer concentrations which have no physical meaning. For example, Fig. 5b of Grewe et al. (2017) attributes approximately 10 Tg of CO production per year to lightning, despite the fact that lightning is only a source of NOx in their model. Such an unphysical result
could be obtained in their tagging scheme after decomposi-tion of a molecule of PAN (peroxy acetyl nitrate, an organic nitrate), which had been tagged as coming from NOx due
to lightning. A similarly unphysical transfer of tag identity would be obtained in the approach used by Guo et al. (2017) if lightning were chosen as one of their tag identities.
The treatment of the NOx–O3 chemical cycle is another
area in which ozone-tagging schemes can produce unphys-ical results. As pointed out by Kwok et al. (2015), the ap-proach of Emmons et al. (2012) treats the reaction between NO and O3 (forming NO2) as chemical destruction of O3. The subsequent rapid reformation of O3 from NO2 pho-tolysis is treated as new ozone production due to an emit-ted NOx precursor, effectively “overwriting” the identity
of tagged ozone from remote sources with the identity of tagged NOxemissions from more nearby sources. The work
of Grewe et al. (2017) does not suffer from this problem because ozone is included in a chemical family (Ox=odd
oxygen=O3+O+NO2+others), which is preserved dur-ing fast chemical exchanges. Guo et al. (2017) do not give enough information to determine whether their approach also suffers from this tag overwriting problem.
While the use of the Ox chemical family is essential to
preserve the correct identity of tagged ozone species, the use of other chemical families for ozone precursors can intro-duce additional problems with tagging schemes. For exam-ple, Grewe et al. (2017) do not explicitly follow the propa-gation of tags through the full set of VOC oxidation interme-diates, but instead only tag a single “NMHC” (non-methane hydrocarbon) chemical family, which includes all VOC oxi-dation intermediate species, including the oxioxi-dation products of methane, but excludes PAN. Their use of this NMHC fam-ily leads to the unphysical result from their Fig. 5d, in which formation of PAN has been partially attributed to methane. There is no known chemical pathway in the atmosphere ca-pable of transforming methane into PAN. This is not an in-herent weakness of their tagging approach, but rather results from their choice of one chemical family to represent all VOC ozone precursors. In order to avoid such unphysical re-sults, the choice of chemical families must be made carefully. Ideally, each individual VOC oxidation intermediate should be explicitly tagged.
species in the MCM (Master Chemical Mechanism; Saun-ders et al. (2003)) by tagging each of the “primary“ (emitted) VOCs with its own identity, and were thus able to attribute ozone production from intermediate VOC species back to the emissions of each primary VOC species, thus avoiding the use of a generic VOC chemical family. Butler et al. (2011) showed that the chemistry of VOC intermediate products can contribute significantly to the total ozone production from VOC over the timescales of several days after emission. Us-ing this approach, it was feasible to tag each primary VOC and all of its intermediate oxidation products in the MCM with a unique tag, due to the way in which the interactions among different organic peroxy radicals are treated in the MCM. The peroxy–peroxy chemistry of each individual per-oxy radical in the MCM is represented as a unimolecular de-cay reaction with a rate constant proportional to the total con-centration of all other peroxy radicals. As also noted by Ying and Krishnan (2010), if these peroxy–peroxy reactions are treated explicitly in a tagged chemical mechanism, the size of the tagged mechanism would scale quadratically with the number of tags, which would rapidly become too large for practical use. The technique of Butler et al. (2011) was sub-sequently applied for comparison of several VOC oxidation mechanisms by Coates and Butler (2015). In order to avoid the quadratic scaling problem, the chemistry of the organic peroxy radicals in each chemical mechanism was rewritten in the MCM style, allowing the size of the tagged chemical mechanism to scale linearly with the number of tag identities.
3 Implementation of NOx and VOC tagging
In this paper we describe an extension to the ozone-tagging system first described fully by Emmons et al. (2012). This extended tagging system improves upon the earlier work of Emmons et al. (2012), avoiding the various problems with previous tagging schemes described above.
– Our tagging scheme allows an arbitrary number of user-defined tag names in a single model run, with the size of the chemical mechanism increasing linearly with the number of tag identities.
– Our tagging scheme introduces new tagged tracers for members of the Oxchemical family (which avoids the
problem that ozone tags are destroyed by the null cycle involving NOx).
– Our tagging scheme incorporates the recursive VOC-tagging system of Butler et al. (2011), explicitly VOC-tagging each intermediate VOC and avoiding the use of precur-sor families.
– Our tagging scheme avoids the possibility of VOC species being tagged with identities of NOxspecies (and
vice versa) by requiring that two separate model runs be performed, one with NOxtagging, and another with
VOC tagging. The tagged Oxproduced during the
con-version of NO to NO2can only be assigned to the tagged identity of the NO precursor, or the tagged identity of the peroxy radical involved in each such transformation, depending on whether NOx or VOC tagging is being
used.
The extended tagging system allows a completely closed source attribution of tropospheric ozone to all precursors to be performed in two model runs, one with NOxtagging, and
another with VOC tagging.
The tagging system is implemented as software, which takes as input an arbitrary list of chemical species to be tagged (typically precursor emissions), and for each of these species, an arbitrary list of tags to be applied. The tagging system rewrites the model chemical mechanism and CAM4 source files to include a new set of tracers and reactions cor-responding to these user-specified tagged species and their associated chemical reactions. As one possible example, if the user specifies that the tags “anthropogenic” and “bio-genic” are to be applied to the species NO and NO2, the chemical mechanism file will be modified to include all nec-essary species and reactions such that the model will be able to simulate ozone due to NOxemitted by anthropogenic and
biogenic sources. Other possibilities are tagging emissions based on geographical source regions, the time at which they were emitted, et cetera. In each case, the user must supply appropriate input files containing the emissions of each of the tagged species in order for the additional tagged reactions and tracers to have any effect. After some initial manual mod-ifications are made to the chemical mechanism and model source files (described below), the specification of a new set of tags representing emitted precursors is a completely auto-mated process. The full suite of tagging tools, input files, and machine-readable tagged mechanism files are included in the Supplement.
Due to the different requirements of NOx and VOC
tag-ging, the user must explicitly choose whether NOx or VOC
tagging is to be performed. The NOx-tagging approach is
scribed in Sect. 3.1, and the VOC-tagging approach is de-scribed in Sect. 3.2. The resulting complete lists of both NOx-tagged reactions and VOC-tagged reactions are
in-cluded in both machine- and human-readable forms in the Supplement. The size of the modified chemical mechanism scales linearly with the number of tag identities requested by the user. The tagging system also modifies all model source files which contain code in which the tagged species are mod-ified by other modelled processes such as deposition (dry and wet) and input or removal due to boundary conditions. The source code modification, including a full list of the source files which are modified, is described in more detail in Sect. 3.3.
shipped with CESM1.2.2 to raise some hard-coded limits and ensure that the addition of the tagged reactions contain-ing untagged species from the base mechanism does not alter the treatment of the untagged species in the chemical solver. The modified source code of the chemical preprocessor is in-cluded in the Supplement.
3.1 NOx-tagged mechanism
The base chemical mechanism used here is taken from Emmons et al. (2012). The same base mechanism is used for both NOx and VOC tagging. Following Emmons et al.
(2012), the reactions of tagged species are implemented as additional reactions in the model chemical mechanism file involving both tagged and untagged reactants. Untagged re-actants appear in stoichiometrically identical amounts in the reactants and products of each tagged reaction, so that tagged reactions do not alter the concentrations of untagged species. 3.1.1 Separation of NOy and Oxtagged species
In order to allow an arbitrary number of tags in a single model run, and to avoid the tag overwriting problem de-scribed in Sect. 2, the chemical families NOy (which
in-cludes NOxand all NOxreservoir species) and Oxare tagged
separately. The following species from the base chemical mechanism belong to the NOy family: NO, NO2, NO3, N2O5, HNO3, HO2NO2, ISOPNO3, ONIT, ONITR, PAN, and MPAN. The following species from the base chemical mechanism belong to the Ox family: O3, O(1D), O, NO2,
NO3, N2O5, HNO3, HO2NO2, ISOPNO3, ONIT, ONITR, PAN, and MPAN. When performing VOC tagging, HO2 is added to the Oxfamily (see Sect. 3.2.1 for more details).
Following Butler et al. (2011) we regard the reaction of NO with any peroxy radical (HO2 and all organic peroxy radicals) and subsequent production of NO2 as the process which effectively generates tropospheric ozone.
NO+HO2→NO2+OH (R1)
Reaction (R1) from the base chemical mechanism is rep-resented in our tagging system as follows:
NO_TAG+HO2→NO2_TAG+NO2_X_TAG+HO2. (R2) Since NO2is in both the NOyand Ox chemical families,
two different tagged versions of NO2are produced in Reac-tion (R2) and they represent the distinct roles of NO2in each of these chemical families: NO2_TAG is NOy-tagged NO2 while NO2_X_TAG is Ox-tagged NO2. The suffix “_TAG” is a placeholder which can be replaced by the tagging sys-tem with an arbitrary number of user-chosen tag identities, each of which is represented by a unique reaction added to the tagged chemical mechanism. The suffix “_X_TAG” rep-resents members of the Ox chemical family produced from
emitted NOxspecies tagged with the identity “TAG”.
Addi-tional reactions of Oxspecies are discussed below.
In the base chemical mechanism, ozone is produced from NO2via photolysis.
NO2+
hν
−→NO+O (R3)
O+O2→O3 (R4)
The NO produced from Reaction (R3) is then available for additional reaction with a peroxy radical, while the atomic O goes on to produce O3. In the tagged chemical mechanism, the fate of Ox-tagged NO2 is different from that of NOy
-tagged NO2. NO2_TAG+
hν
−→NO_TAG (R5)
NO2_X_TAG+−→hν O_X_TAG (R6)
O_X_TAG+O2→O3_X_TAG+O2 (R7)
In the tagged versions of Reactions (R3)–(R4), tagged ozone is produced from tagged Ox in Reaction (R6), while
the tagged Ox precursor NO remains available for further
subsequent conversion of NO to NO2 after its regeneration in Reaction (R5).
The tag overwriting problem (Sect. 2) emerges from the reaction between ozone and NO.
NO+O3→NO2+O2 (R8)
Because Emmons et al. (2012) did not clearly distinguish the NOy and Ox chemical families in their tagging system,
their tagged NO2effectively inherited its tag from NO, lead-ing to the replacement of tagged ozone identities by the O3– NOx null chemical cycle. This has the effect that tag
identi-ties from nearby sources of NOxare over-represented in the
tagged O3in the study of Emmons et al. (2012).
In our tagging system, we avoid this problem by handling Reaction (R8) as follows.
NO_TAG+O3→NO2_TAG+O3 (R9)
NO+O3_X_TAG→NO2_X_TAG+NO (R10) The tagged identity of the emitted NOx precursor is
pre-served in Reaction (R9), while the tagged identity of Ox is
preserved in Reaction (R10).
A major sink pathway for tropospheric ozone is photoly-sis followed by reaction of excited oxygen atoms with water vapour, producing hydroxyl radicals.
O3+−→hν O(1D)+O2 (R11)
O(1D)+H2O→2OH (R12)
This loss process is represented in our tagging system as follows.
O3_X_TAG+
hν
−→O(1D)_X_TAG (R13)
O(1D)_X_TAG+H2O→H2O (R14)
3.1.2 Preparation of the chemical mechanism for NOx tagging
Before the tagging system can automatically generate a tagged chemical mechanism file including the user-specified tag identities, a set of placeholder reactions must be added by hand to the base chemical mechanism. Machine-readable files containing these placeholder reactions can be found in the Supplement. In future versions of our tagging system, it may be possible to identify these reactions automatically. These reactions can be classified into a number of different categories based on their chemical characteristics.
1. Reactions of emitted NOx and corresponding NOy
reservoir species. This category includes all reactions between NO and peroxy radicals which generate Ox
-tagged NO2(NO2_X_TAG).
2. Reactions ofOx species, including transformations
be-tween Ox family members, and sinks ofOx. This
cat-egory changes slightly depending on whether NOx or
VOCs are being tagged; for NOx tagging, reactions of
OH radicals with atomic O and molecular O3are sinks of Ox, while for VOC tagging these reactions preserve
Ox(see Sect. 3.2.1 for more details).
3. Reactions which endogenously generate NOy or Ox
species. Stratospheric O3 is produced in this cate-gory of reactions, through the photolysis of O2 and N2O, which ultimately produce the specially tagged species O3_X_STR. A small amount of atomic O is produced from the self-reaction of OH radicals, produc-ing the specially tagged species “O_X_XTR” (“extra” sources). This category also changes slightly depending on whether NOxor VOCs is being tagged. When NOx
are being tagged, reaction of N2O with excited oxygen in the stratosphere produces NO_STR, and the reactions of HO2 with certain organic peroxy radicals produce O3_X_XTR.
Similar to Emmons et al. (2012), the species N2O5, which is formed by reaction between NO2and NO3, is duplicated to account for the possibility that its tag is inherited from either NO2or NO3. The species NO3is also subject to a tag inheritance problem when being tagged as a member of the Oxchemical family in the following reaction:
NO2+O3→NO3+O2. (R15)
In this case, the Ox tag identity could be inherited from
either NO2or O3. Following Emmons et al. (2012) we simply let the Oxtag be inherited from NO2in this case.
A full list of NOx-tagged reactions is given in the
Supple-ment, including reactions producing species specially tagged as “STR” and “XTR”.
3.2 VOC-tagged mechanism
Butler et al. (2011) introduced a methodology to recursively follow the chemistry of VOC species, starting from the emit-ted VOC, following all intermediate species, and ending when only unreactive products remain. For each intermedi-ate species, additional reactions and tracers are added to the chemical mechanism and are tagged with the same identity as the originally emitted species. The added species include tagged organic peroxy radicals (generically represented here as RO2, but which are explicitly tagged by our tagging sys-tem). These RO2produce Oxby converting NO to NO2: RO2_TAG+NO→NO+NO2_X_TAG
+tagged products. (R16)
The “tagged products” of Reaction (R16) include tagged versions of all of the intermediate VOCs associated with the corresponding reaction from the base chemical mechanism. Many such reactions also include HO2as a product, which may go on to produce Ox by converting NO to NO2 (Reac-tion R1). In order to attribute this Oxproduction to the
appro-priate tag identity, HO2is included in the Ox family when
performing VOC tagging, and the HO2produced in tagged organic reactions is given the identity of the organic reactant responsible for its production. The HO2_X_TAG thus pro-duced gives its Oxtag to NO2when reacting with NO: HO2_X_TAG+NO→NO2_X_TAG+NO. (R17)
The tagging software automatically identifies reactions in-volving the user-specified primary (or emitted) VOC species in the base chemical mechanism and automatically gener-ates tagged reactions of these species and their intermedigener-ates, including NO2_X_TAG and HO2_X_TAG, in the products where appropriate in order to attribute production of Ox to
these emitted VOC species.
3.2.1 Preparation of the chemical mechanism for VOC tagging
In the case of VOC tagging, a number of reactions must be identified and categorized by hand, similar to the case of NOx
tagging described in Sect. 3.1.2.
1. Reactions involving HO2. These include Reac-tion (R17), reacReac-tions of the HO2 reservoir species HO2NO2, and sinks of HO2which do not pass the tag identity onto their products (typically reactions of HO2 with RO2species).
2. Reactions ofOx species, including transformations
be-tweenOx family members and sinks of Ox. This
cat-egory has substantial overlap with reactions involved in NOx tagging, but with one small difference: since
when tagging VOC, the production of HO2from reac-tions of OH radicals with atomic O and molecular O3 is not treated as a sink for Ox as it is for NOx tagging
(Sect. 3.1.2). Instead, the tagged identity is preserved as HO2_X_TAG.
3. Reactions which endogenously generate NOy or Ox
species. This category also has substantial overlap with NOxtagging, including the production of stratospheric
O3 from photolysis O2. An additional reaction which is considered during VOC tagging is the production of the specially tagged species HO2_X_XTR from the re-action between OH and H2O2.
Following Coates and Butler (2015), the chemistry of the organic peroxy radicals in the base chemical mechanism is modified here to use the permutation approach employed by the MCM, in which the cross reactions of individual RO2species are represented as unimolecular decay reactions with rates proportional to the total concentration of all RO2 species. Further details are given in Coates and Butler (2015). A full list of VOC-tagged reactions is given in the Supple-ment, including reactions producing species specially tagged as STR and XTR.
3.3 Automatic source code rewriting
Several of the CAM source code files must be modified in order to correctly handle the processes involving the tagged tracers. Source files are first modified by hand in such a way that they can be automatically rewritten by the tagging soft-ware to accommodate the tagged tracers, and will also com-pile and run correctly when the CAM is run without tag-ging enabled. This is accomplished by enclosing sections of relevant code between FORTRAN comments. For exam-ple, model variables which index the concentration array for tagged species are declared as follows.
! START TAGGING CODE
integer :: no_tag_ndx, no2_tag_ndx, no2_x_tag_ndx
! END TAGGING CODE
The tagging logic itself is similarly enclosed between com-ments. The tagging software scans each source file for these comment lines, and expands the code where appropriate, adding code for each tagged tracer which has been added to the chemical mechanism.
The modified files are listed here, along with short sum-maries of the changes made in each case. The hand-modified source files themselves, along with the tagging software and all other necessary input files, are available in the Supple-ment.
– cam_history.F90 Code is modified to account for the larger number of tracers which could potentially be written to history files.
– mo_aerosols.F90Code for gas–aerosol partitioning of tag identities between ammonium nitrate and nitric acid is added.
– mo_airplane.F90Code is added to tag emissions from aircraft with the hard-coded identity “AIR”.
– mo_drydep.F90Dry deposition fluxes are calculated for tagged species using deposition velocities of the corre-sponding untagged species.
– mo_flbc.F90Species added at the lower model bound-ary are appropriately tagged if tags are defined for these species.
– mo_fstrat.F90 Tagged tracers are adjusted at the up-per model boundary based on the adjustments made to the corresponding non-tagged species. Any Ox or
NOy added to the model is tagged as being of
strato-spheric origin. Other species are added or removed in proportion to their share of the corresponding untagged species.
– mo_gas_phase_chemdr.F90Indices into the model con-centration array for tagged species are determined dur-ing initialization.
– mo_imp_sol.F90Relative error parameters for tagged species in the implicit solver are set to the same values as for the corresponding untagged species.
– mo_lightning.F90Code is added to tag NO production from lightning with the hard-coded identity “LGT”. – mo_neu_wetdep.F90 Wet deposition fluxes are
calcu-lated for tagged species using removal rates of the cor-responding untagged species.
– mo_photo.F90Photolysis rates for the tagged reactions are set equal to the corresponding untagged reactions. – mo_setext.F90Code is added to facilitate the tagging of
lightning NO and aircraft emissions.
– mo_sethet.F90Loss rates due to heterogeneous chem-istry are calculated for tagged species using removal rates of the corresponding untagged species.
– mo_srf_emissions.F90 Emissions of isoprene and monoterpenes are tagged appropriately if tags have been specified for these species.
4 Experiment design
We use CESM version 1.2.2 (Tilmes et al., 2015; Lamar-que et al., 2012) with the component set “FSDCHM” at a horizontal resolution of 1.9×2.5◦, with 56 vertical levels. This component set includes the tropospheric chemistry ver-sion of CAM4-chem forced with specified dynamics from year 2010 of the MERRA reanalysis (Rienecker et al., 2011). NOx, O3, HNO3, N2O5, N2O, CO, and CH4 are relaxed towards climatological values in the stratosphere. For this study, we replace the default chemical mechanism with the base mechanism from Emmons et al. (2012), modified as de-scribed in Sect. 3. Emissions of anthropogenic species are taken from the HTAP_v2.2 emission inventory (Janssens-Maenhout et al., 2015). Biomass burning emissions are from GFEDv3 (van der Werf et al., 2010). Emissions of NOxfrom
lightning are calculated online within the model according to Price et al. (1997). Biogenic emissions of NOx (from soils)
and VOC (from vegetation) are prescribed as in Tilmes et al. (2015). Mixing ratios of CH4and N2O are fixed at the sur-face as in Tilmes et al. (2015).
Model runs are carried out using both NOxand VOC
tag-ging, with the base chemical mechanism and model source code modified in each case as described in Sect. 3. We spec-ify separate tag identities for emissions from anthropogenic (ANT), biogenic (BIO), biomass burning (BMB), and air-craft (AIR) sources. For NOx-tagging runs we specify an
additional tag for NOxfrom lightning (LGT), and for
VOC-tagging runs we specify an additional tag for methane (CH4). Furthermore, in our VOC-tagging run, we tag CO emissions from ANT, BIO, and BMB sources separately from the non-methane VOC (NMVOC) emissions. In both cases (NOxand
VOC tagging) we include tags representing chemical pro-duction in the stratosphere (STR), extra chemical propro-duction (XTR, as described in Sect. 3), and a special tag represent-ing the initial conditions (INI), allowrepresent-ing us to monitor the progress of the model spin-up. This choice of tag identities allows us to compare our source attribution with that of Em-mons et al. (2012), who used a similar set of tag identities, on which our new tagging scheme is based.
Initial conditions for Ox species were tagged with STR in
the stratosphere and INI in the troposphere. Following Em-mons et al. (2012), we used a chemical tropopause definition of 150 ppb of ozone. Initial methane in the VOC-tagging run was tagged with CH4. The concentration of INI-tagged and STR-tagged species was set equal to the mixing ratio of the corresponding species in the initial conditions, and all other tagged tracers were set to zero at the beginning of the model run. The model was run with annually repeating meteorology from 2010 until the maximum contribution of surface ozone attributable to the initial conditions was less than 1 % of the total surface ozone, and the maximum difference between the stratospheric contribution to surface ozone in December and the stratospheric contribution to surface ozone in the previ-ous December was also less than 1 %. For VOC tagging we
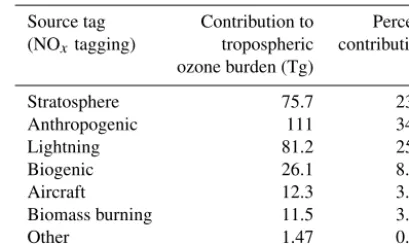
Table 1.Contribution to annual average tropospheric ozone burden
from tagged NOxsources and transport from the stratosphere.
Source tag Contribution to Percent
(NOxtagging) tropospheric contribution
ozone burden (Tg)
Stratosphere 75.7 23.7
Anthropogenic 111 34.9
Lightning 81.2 25.4
Biogenic 26.1 8.17
Aircraft 12.3 3.84
Biomass burning 11.5 3.59
Other 1.47 0.46
imposed the additional constraint that the difference between the contribution of methane to surface ozone in December and the contribution in the previous December was less than 1 %. This was achieved after 2 years of simulation for NOx
-tagged runs and 3 years of simulation for VOC--tagged runs. For the final year of simulation in each case (the second year for a NOx-tagged run and the third year for a VOC-tagged
run), we verified that the method was working as expected by comparing the sum of the tagged ozone tracers with the actual ozone simulated by the model. At the lowest model level, the maximum monthly average difference was of the order of 1×10⁻⁵ppb, while in the free troposphere the max-imum monthly average difference was of the order of 1 ppb. The actual ozone simulated when using a model modified for tagging is identical to the actual ozone simulated using an unmodified version of the model. The final year of simu-lation for both NOx- and VOC-tagged runs is presented and
discussed in Sect. 5.
5 Results
The contribution of each tagged source of NOx and VOCs
to the annual average global tropospheric burden of ozone is presented in Table 1 (for NOxtagging) and Table 2 (for VOC
tagging). Following Emmons et al. (2012) and Young et al. (2013), we define the troposphere as all model grid cells with an ozone mixing ratio lower than 150 ppb. Our simulation for the year 2010 produces a total tropospheric ozone burden of 320 Tg(O3). This ozone burden is within 1 standard deviation of the multi-model mean reported by Young et al. (2013) for the year 2000 (337±23 Tg(O3)).
Our source attribution is consistent with previous results noting the strong sensitivity of tropospheric ozone to anthro-pogenic NOxand biogenic VOC emissions (e.g. Young et al.,
methodologi-Table 2.Contribution to annual average tropospheric ozone burden from tagged sources of VOC and CO, and transport from the stratosphere. Sources of NMVOC and CO were further tagged as being of either anthropogenic, biogenic, or biomass burning origin. The contribution of these different individual source categories to the tropospheric ozone burden are also shown here in addition to the total contributions of each of these chemical species.
Contribution to tropospheric ozone burden (Tg)
Source tag Anthropogenic Biogenic Biomass Total Percent
(VOC tagging) burning contribution
Stratosphere – – – 66.9 20.9
Methane – – – 113 35.4
NMVOC 26.4 73.1 4.25 104 32.5
CO 18.6 3.24 9.43 31.3 9.78
Other – – – 4.65 1.45
o o o o o o o o o o o
o o o o o
o o o o o o o o o o
o o o o o o
o o o o o o o o o o
o o o o o o
o o o o o o o o o o
o o o o o o
o o o o o o o o o o
o o o o o o
o o o o o o o o o o
o o o o o o
o o o o o o o o o o
o o o o o o
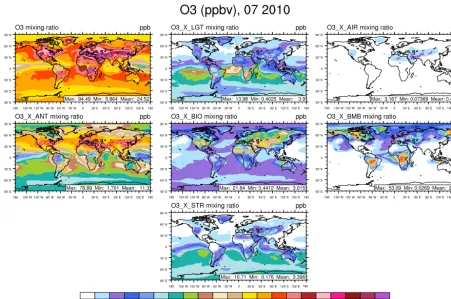
Figure 1.Surface ozone in January from the NOx-tagging run. Total surface ozone is shown in the top left panel. Other panels show the
contribution to surface ozone due to NOxprecursors emitted by lightning (LGT), aircraft (AIR), anthropogenic sources (ANT), biogenic
sources (BIO), biomass burning (BMB), and transport from the stratosphere (STR).
cal differences noted in Sect. 2. Grewe et al. (2017) combine the effects of NOxand VOC precursors, whereas our results
report their influences on tropospheric ozone separately. Em-mons et al. (2012) do not report the contributions of their tagged sources to the tropospheric ozone burden.
The stratospheric contribution to tropospheric ozone bur-den under NOx tagging (75.7 Tg(O3), Table 1) is higher
than the corresponding contribution under VOC tagging (66.9 Tg(O3), Table 2). Since the direct production of
o o o o o o o o o o o
o o o o o
o o o o o o o o o o
o o o o o o
o o o o o o o o o o
o o o o o o
o o o o o o o o o o
o o o o o o
o o o o o o o o o o
o o o o o o
o o o o o o o o o o
o o o o o o
o o o o o o o o o o
o o o o o o
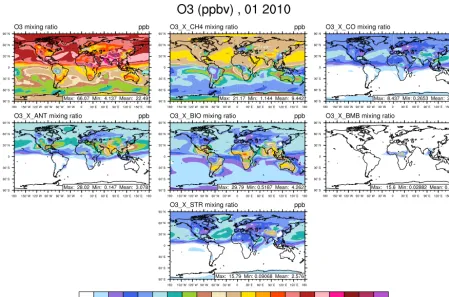
Figure 2.Surface ozone in January from the VOC-tagging run. Total surface ozone is shown in the top left panel. Other panels show the contribution to surface ozone due to methane (CH4), all CO emissions (CO), anthropogenic NMVOC sources (ANT), biogenic NMVOC sources (BIO), biomass burning NMVOC sources (BMB), and transport from the stratosphere (STR).
note that our model does not include a comprehensive treat-ment of stratospheric chemistry and associated stratosphere– troposphere exchange. While our model does explicitly rep-resent the photochemistry of O2 and N2O in the strato-sphere, the mixing ratios of Ox and NOy species are also
relaxed towards climatological values in the stratosphere. Fu-ture work examining the contribution of stratospheric NOxto
tropospheric ozone production should implement our tagging methodology in a fully coupled stratosphere–troposphere model.
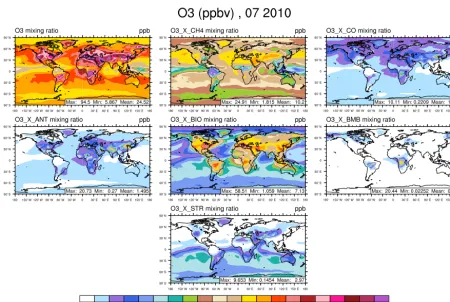
The rest of this section focuses on the contribution of tagged sources to the mixing ratio of ozone at the surface. The January average surface ozone mixing ratio along with the mixing ratios of major contributing sources are shown from the NOx-tagging run in Fig. 1 and from the
VOC-tagging run in Fig. 2. Similarly, the July average surface ozone mixing ratio is shown for the NOx-tagged and
VOC-tagged runs in Figs. 3 and 4. A complete set of figures show-ing the contribution of each tagged source to the monthly average mixing ratio of ozone at the surface, for each month of our simulation, for both NOx and VOC tagging, can be
found in Sect. 2 of the Supplement. January–December from the NOx-tagging run are shown in Figs. S1–S12 in the
Sup-plement, and January–December from the VOC-tagging run are shown in Figs. S13–S24.
Over the Northern Hemisphere mid-latitude continental regions, modelled surface ozone has its maximum in sum-mer and its minimum in winter. Over the remote Northern Hemisphere ocean regions, the opposite is the case; mod-elled surface ozone concentrations are higher in winter than they are in summer. These changes are strong enough in our model that in the northern mid-latitudes the land–sea gradi-ent of modelled total surface ozone reverses sign between January and July. Low modelled surface ozone mixing ra-tios over the northern mid-latitudes in winter are consistent with high local emissions of NOx, and ozone removal by
Re-action (R8). Examination of the tagged ozone tracers from both the NOx-tagged run and the VOC-tagged run shows
that high modelled surface ozone mixing ratios over the northern mid-latitudes in summer are primarily attributable to a combination of anthropogenic NOx emissions and
o o o o o o o o o o o
o o o o o
o o o o o o o o o o
o o o o o o
o o o o o o o o o o
o o o o o o
o o o o o o o o o o
o o o o o o
o o o o o o o o o o
o o o o o o
o o o o o o o o o o
o o o o o o
o o o o o o o o o o
o o o o o o
Figure 3. Surface ozone in July from the NOx-tagging run. Total surface ozone is shown in the top left panel. Other panels show the
contribution to surface ozone due to NOxprecursors emitted by lightning (LGT), aircraft (AIR), anthropogenic sources (ANT), biogenic
sources (BIO), biomass burning (BMB), and transport from the stratosphere (STR).
strong seasonal cycle in biogenic NMVOC emissions in mid-latitude regions, being emitted almost exclusively during the growing season.
Low modelled surface ozone mixing ratios over the re-mote northern hemispheric ocean regions in summer are con-sistent with a stronger chemical sink due to photolysis of ozone with subsequent production of OH radicals from wa-ter vapour (Johnson et al., 1999). The strength of this sink decreases during the boreal winter, allowing modelled ozone to build up over large regions of the remote Northern Hemi-sphere. This northern hemispheric background ozone reaches a maximum in March–April (please refer to the Supplement) before the chemical sink increases again. Examination of the tagged ozone tracers from both the NOx-tagged run and the
VOC-tagged run shows that this boreal winter–spring remote maritime build-up of ozone is primarily attributable to both anthropogenic NOxand NMVOC emissions. This is in
con-trast to the summer maximum in surface ozone modelled over continental regions, for which the primary responsi-ble NMVOC precursor is of biogenic origin (in both hemi-spheres). We are not aware of any previous work in the peer-reviewed literature showing that anthropogenic NMVOCs contribute disproportionately to springtime ozone over re-mote regions of the Northern Hemisphere.
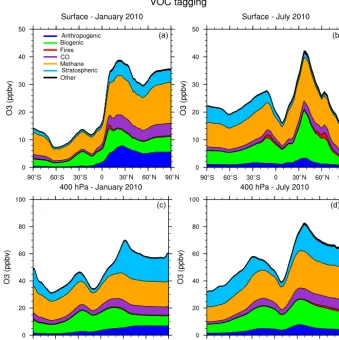
Another noteworthy feature of Figs. 2 and 4 is the strong contribution of methane to the modelled mixing ratio of ozone at the surface, in both January and July in both hemi-spheres, consistent with its high contribution to the total tropospheric ozone burden (Table 2). Here, we show that the contribution of surface ozone attributable to methane as an organic precursor remains remarkably constant at about 15 ppb over large regions of the Northern Hemisphere year-round (at least in our model).
o o o o o o o o o o o
o o o o o
o o o o o o o o o o
o o o o o o
o o o o o o o o o o
o o o o o o
o o o o o o o o o o
o o o o o o
o o o o o o o o o o
o o o o o o
o o o o o o o o o o
o o o o o o
o o o o o o o o o o
o o o o o o
Figure 4. Surface ozone in July from the VOC-tagging run. Total surface ozone is shown in the top left panel. Other panels show the contribution to surface ozone due to methane (CH4), all CO emissions (CO), anthropogenic NMVOC sources (ANT), biogenic NMVOC sources (BIO), biomass burning NMVOC sources (BMB), and transport from the stratosphere (STR).
a stratospheric ozone tracer to determine the contribution of the stratosphere to surface ozone.
Emmons et al. (2012) determined the contribution of stratospheric ozone to the modelled mixing ratio of ozone at the surface using their tagging approach. Since they did not explicitly tag the ozone originating in the stratosphere, they calculated the stratospheric contribution to tropospheric ozone as the residual after subtracting all of the ozone which had been produced from tagged tropospheric sources. They found that their residual stratospheric contribution to surface ozone was less than half of the contribution determined us-ing a stratospheric tracer such as that used by Roelofs and Lelieveld (1997), which is set equal to the ozone mixing ratio in the stratosphere and removed from the troposphere at the same rate as ozone itself. Emmons et al. (2012) pointed out that such a stratospheric ozone tracer is likely to give an up-per bound on the stratospheric contribution to surface ozone due to the fact that the tagged stratospheric ozone is set equal to the total ozone mixing ratio in the stratosphere, which ef-fectively overwrites any tropospheric ozone which may have been imported into the stratosphere. In contrast to the use of a stratospheric tracer, we regard the residual estimate of Em-mons et al. (2012) as a lower bound on the contribution of stratospheric ozone to surface ozone, due to the overwriting
problem mentioned above, in which their ozone tag identities are overwritten with the identity of nearby sources.
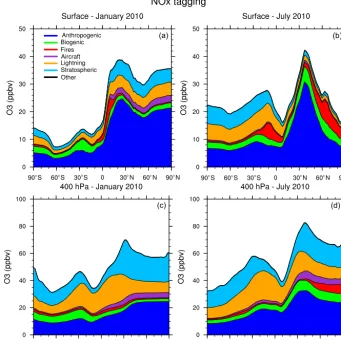
Figure 5 shows the contribution of each of our tag iden-tities to the zonally averaged ozone at the surface and at 400 hPa from our NOx-tagging run. This figure is designed
anthro-o o o o
o
o o o o o o o
o o o o
o
o o o o o o o
Figure 5.Zonal average of tagged ozone source contributions at the surface(a, b)and at 400 hPa(c, d)for January(a, c)and July(b, d)
from the NOx-tagging run.
pogenic emissions to zonal average surface ozone than we see in our Fig. 5 and show effectively no stratospheric con-tribution in July, while our run shows a small concon-tribution of about 3 ppb of stratospheric ozone to northern hemispheric surface ozone in July. These results illustrate the importance of explicitly separating tagged species which are members of both the NOyand Oxfamilies to preserve the tagged
identi-ties of ozone transported over long distances. The contribu-tion of the tagged VOC precursors to zonal average surface ozone is shown in Fig. 6. The widespread, year-round contri-bution of methane to ozone production is clearly visible, as is the increased importance of anthropogenic NMVOCs as an ozone precursor during the boreal winter, noted earlier.
6 Conclusions
We have introduced and described a technique for attribution of tropospheric ozone to emitted precursors of both NOxand
VOC, as well as transport from the stratosphere. The results obtained using this technique are consistent with
understand-ing of tropospheric ozone chemistry based on previous work. Our work shares features with many earlier methodologies for attribution of tropospheric ozone, but combines these fea-tures in unique ways which allow a unique and deeper under-standing of the processes influencing tropospheric ozone in our model and avoid many of the problems associated with previous work such as over-attribution of ozone to locally emitted precursors and the unphysical transfer of tag identi-ties between NOxand VOC species.
By performing simultaneous but separate attribution of ozone to both its NOx and VOC precursors, we have
quan-tified, for example, the changing contributions of anthro-pogenic and biogenic sources to modelled seasonal cycles of surface ozone over the populated and remote regions of the Northern Hemisphere. In particular, we have identified the combination of anthropogenic NOx and anthropogenic
Fur-o o o o
o
o o o o o o o
o o o o
o
o o o o o o o
Figure 6.Zonal average of tagged ozone source contributions at the surface(a, b)and at 400 hPa(c, d)for January(a, c)and July(b, d)
from the VOC-tagging run.
ther experiments using this tagging technique should exam-ine the winter–spring contribution of anthropogenic VOCs in more detail. Such experiments could instead tag anthro-pogenic VOC emissions according to their source sector, ge-ographical region, time of emission, or even according to the particular kinds of VOC molecules emitted, in order to understand more about the ultimate sources of this spring-time ozone in different receptor regions. Future work us-ing this taggus-ing technique could also examine the change in the contribution of all ozone precursors to tropospheric ozone when individual sources are perturbed. For example, it would be possible to quantify the change in the contribution of methane oxidation to modelled tropospheric ozone when anthropogenic NOxemissions are reduced by some amount.
Given the problems of the current generation of global chemistry–climate models in simulating amounts, trends, and seasonal cycles of tropospheric ozone, the deeper un-derstanding provided by our tagging methodology may yield information about deficiencies in these models and point the way towards improvements. If implemented in additional chemistry–climate models, our methodology could be a
use-ful tool in understanding the differing responses of different models to changes in precursor emissions. Given the large number of alternative methodologies for attribution of tro-pospheric ozone, including the several different ways of im-plementing tagging which have been reviewed here, we also believe that the community would benefit from a systematic intercomparison of the different techniques for constructing source–receptor relationships of tropospheric ozone.
Code availability. The full suite of tagging tools, input files, and machine-readable tagged mechanism files are included in the Sup-plement.
Author contributions. TB conceived and designed the study. TB implemented the automatic mechanism-rewriting and code-generation tools. ZS and AL adapted the CESM source code. AL performed the model runs and subsequent analysis. AL and JC both contributed tools for analysing the model runs. TB wrote the paper.
Competing interests. The authors declare that they have no conflict of interest.
Acknowledgements. This work was hosted by IASS Potsdam, with financial support provided by the Federal Ministry of Education and Research of Germany (BMBF) and the Ministry for Science, Research and Culture of the State of Brandenburg (MWFK).
Edited by: Gerd A. Folberth
Reviewed by: two anonymous referees
References
Atkinson, R.: Atmospheric chemistry of VOCs and NOx, Atmos.
Environ., 34, 2063–2101, 2000.
Butler, T., Lawrence, M., Taraborrelli, D., and Lelieveld, J.: Multi-day ozone production potential of volatile organic compounds calculated with a tagging approach, Atmos. Environ., 45, 4082– 4090, https://doi.org/10.1016/j.atmosenv.2011.03.040, 2011. Clappier, A., Belis, C. A., Pernigotti, D., and Thunis, P.: Source
apportionment and sensitivity analysis: two methodologies with two different purposes, Geosci. Model Dev., 10, 4245–4256, https://doi.org/10.5194/gmd-10-4245-2017, 2017.
Coates, J. and Butler, T. M.: A comparison of chemical mechanisms using tagged ozone production potential (TOPP) analysis, At-mos. Chem. Phys., 15, 8795–8808, https://doi.org/10.5194/acp-15-8795-2015, 2015.
Derwent, R. G., Utembe, S. R., Jenkin, M. E., and Shallcross, D. E.: Tropospheric ozone production regions and the intercontinen-tal origins of surface ozone over Europe, Atmos. Environ., 112, 216–224, https://doi.org/10.1016/j.atmosenv.2015.04.049, 2015. Dunker, A., Yarwood, G., Ortmann, J., and Wilson, G.: Compari-son of source apportionment and source sensitivity of ozone in a three-dimensional air quality model, Environ. Sci. Technol., 36, 2953–2964, https://doi.org/10.1021/es011418f, 2002.
Emmons, L. K., Hess, P. G., Lamarque, J.-F., and Pfister, G. G.: Tagged ozone mechanism for MOZART-4, CAM-chem and other chemical transport models, Geosci. Model Dev., 5, 1531– 1542, https://doi.org/10.5194/gmd-5-1531-2012, 2012.
Fiore, A. M., West, J. J., Horowitz, L. W., Naik, V., and Schwarzkopf, M. D.: Characterizing the tropospheric ozone response to methane emission controls and the benefits to climate and air quality, J. Geophys. Res., 113, D08307, https://doi.org/10.1029/2007JD009162, 2008.
Fiore, A. M., Dentener, F. J., Wild, O., Cuvelier, C., Schultz, M. G., Hess, P., Textor, C., Schulz, M., Doherty, R. M., Horowitz, L. W., MacKenzie, I. A., Sanderson, M. G., Shindell, D. T., Steven-son, D. S., Szopa, S., Van Dingenen, R., Zeng, G., Atherton, C., Bergmann, D., Bey, I., Carmichael, G., Collins, W. J., Duncan, B. N., Faluvegi, G., Folberth, G., Gauss, M., Gong, S.,
Hauglus-taine, D., Holloway, T., Isaksen, I. S. A., Jacob, D. J., Jonson, J. E., Kaminski, J. W., Keating, T. J., Lupu, A., Marmer, E., Montanaro, V., Park, R. J., Pitari, G., Pringle, K. J., Pyle, J. A., Schroeder, S., Vivanco, M. G., Wind, P., Wojcik, G., Wu, S., and Zuber, A.: Multimodel estimates of intercontinental source-receptor relationships for ozone pollution, J. Geophys. Res., 114, D04301, https://doi.org/10.1029/2008JD010816, 2009. Grewe, V., Tsati, E., and Hoor, P.: On the attribution of
con-tributions of atmospheric trace gases to emissions in atmo-spheric model applications, Geosci. Model Dev., 3, 487–499, https://doi.org/10.5194/gmd-3-487-2010, 2010.
Grewe, V., Tsati, E., Mertens, M., Frömming, C., and Jöckel, P.: Contribution of emissions to concentrations: the TAG-GING 1.0 submodel based on the Modular Earth Submodel System (MESSy 2.52), Geosci. Model Dev., 10, 2615–2633, https://doi.org/10.5194/gmd-10-2615-2017, 2017.
Guo, Y., Liu, J., Mauzerall, D. L., Li, X., Horowitz, L. W., Tao, W., and Tao, S.: Long-Lived Species Enhance Sum-mertime Attribution of North American Ozone to
Up-wind Sources, Environ. Sci. Technol., 51, 5017–5025,
https://doi.org/10.1021/acs.est.6b05664, 2017.
Janssens-Maenhout, G., Crippa, M., Guizzardi, D., Dentener, F., Muntean, M., Pouliot, G., Keating, T., Zhang, Q., Kurokawa, J., Wankmüller, R., Denier van der Gon, H., Kuenen, J. J. P., Klimont, Z., Frost, G., Darras, S., Koffi, B., and Li, M.: HTAP_v2.2: a mosaic of regional and global emission grid maps for 2008 and 2010 to study hemispheric trans-port of air pollution, Atmos. Chem. Phys., 15, 11411–11432, https://doi.org/10.5194/acp-15-11411-2015, 2015.
Johnson, C., Collins, W., Stevenson, D., and Derwent, R.: Relative roles of climate and emissions changes on future tropospheric oxidant concentrations, J. Geophys. Res.-Atmos., 104, 18631– 18645, 1999.
Kwok, R. H. F., Baker, K. R., Napelenok, S. L., and Tonnesen, G. S.: Photochemical grid model implementation and application of
VOC, NOx, and O3source apportionment, Geosci. Model Dev.,
8, 99–114, https://doi.org/10.5194/gmd-8-99-2015, 2015. Lamarque, J.-F., Emmons, L. K., Hess, P. G., Kinnison, D. E.,
Tilmes, S., Vitt, F., Heald, C. L., Holland, E. A., Lauritzen, P. H., Neu, J., Orlando, J. J., Rasch, P. J., and Tyndall, G. K.: CAM-chem: description and evaluation of interactive at-mospheric chemistry in the Community Earth System Model, Geosci. Model Dev., 5, 369–411, https://doi.org/10.5194/gmd-5-369-2012, 2012.
Lamarque, J.-F., Shindell, D. T., Josse, B., Young, P. J., Cionni, I., Eyring, V., Bergmann, D., Cameron-Smith, P., Collins, W. J., Do-herty, R., Dalsoren, S., Faluvegi, G., Folberth, G., Ghan, S. J., Horowitz, L. W., Lee, Y. H., MacKenzie, I. A., Nagashima, T., Naik, V., Plummer, D., Righi, M., Rumbold, S. T., Schulz, M., Skeie, R. B., Stevenson, D. S., Strode, S., Sudo, K., Szopa, S., Voulgarakis, A., and Zeng, G.: The Atmospheric Chemistry and Climate Model Intercomparison Project (ACCMIP): overview and description of models, simulations and climate diagnostics, Geosci. Model Dev., 6, 179–206, https://doi.org/10.5194/gmd-6-179-2013, 2013.
ozone and its precursors from the urban to the global scale from air quality to short-lived climate forcer, Atmos. Chem. Phys., 15, 8889–8973, https://doi.org/10.5194/acp-15-8889-2015, 2015. Parrish, D., Lamarque, J.-F., Naik, V., Horowitz, L., Shindell, D.,
Staehelin, J., Derwent, R., Cooper, O., Tanimoto, H., Volz-Thomas, A., Gilge, S., Scheel, H.-E., Steinbacher, M., and Fröh-lich, M.: Long-term changes in lower tropospheric baseline ozone concentrations: Comparing chemistry-climate models and observations at northern midlatitudes, J. Geophys. Res., 119, 5719–5736, https://doi.org/10.1002/2013JD021435, 2014.
Price, C., Penner, J., and Prather, M.: NOxfrom lightning 1. Global
distribution based on lightning physics, J. Geophys. Res.-Atmos., 102, 5929–5941, 1997.
Rienecker, M. M., Suarez, M. J., Gelaro, R., Todling, R., Bacmeis-ter, J., Liu, E., Bosilovich, M. G., Schubert, S. D., Takacs, L., Kim, G.-K., Bloom, S., Chen, J., Collins, D., Conaty, A., da Silva, A., Gu, W., Joiner, J., Koster, R. D., Lucchesi, R., Molod, A., Owens, T., Pawson, S., Pegion, P., Redder, C. R., Re-ichle, R., Robertson, F. R., Ruddick, A. G., Sienkiewicz, M., and Woollen, J.: MERRA: NASA’s Modern-Era Retrospective Anal-ysis for Research and Applications, J. Climate, 24, 3624–3648, https://doi.org/10.1175/jcli-d-11-00015.1, 2011.
Roelofs, G.-J. and Lelieveld, J.: Model study of the influence of
cross-tropopause O3transports on tropospheric O3levels, Tellus
B, 49, 38–55, 1997.
Saunders, S. M., Jenkin, M. E., Derwent, R. G., and Pilling, M. J.: Protocol for the development of the Master Chemical Mech-anism, MCM v3 (Part A): tropospheric degradation of non-aromatic volatile organic compounds, Atmos. Chem. Phys., 3, 161–180, https://doi.org/10.5194/acp-3-161-2003, 2003.
Sillman, S.: The use of NOy, H2O2, and HNO3as indicators for
ozone-NOx-hydrocarbon sensitivity in urban locations, J.
Geo-phys. Res., 100, 14175–14188, 1995.
Stevenson, D. S., Young, P. J., Naik, V., Lamarque, J.-F., Shindell, D. T., Voulgarakis, A., Skeie, R. B., Dalsoren, S. B., Myhre, G., Berntsen, T. K., Folberth, G. A., Rumbold, S. T., Collins, W. J., MacKenzie, I. A., Doherty, R. M., Zeng, G., van Noije, T. P. C., Strunk, A., Bergmann, D., Cameron-Smith, P., Plummer, D. A., Strode, S. A., Horowitz, L., Lee, Y. H., Szopa, S., Sudo, K., Na-gashima, T., Josse, B., Cionni, I., Righi, M., Eyring, V., Conley, A., Bowman, K. W., Wild, O., and Archibald, A.: Tropospheric ozone changes, radiative forcing and attribution to emissions in the Atmospheric Chemistry and Climate Model Intercompari-son Project (ACCMIP), Atmos. Chem. Phys., 13, 3063–3085, https://doi.org/10.5194/acp-13-3063-2013, 2013.
Sudo, K. and Akimoto, H.: Global source attribution of tropospheric ozone: Long-range transport from various source regions, J. Geo-phys. Res., 112, D12302, https://doi.org/10.1029/2006jd007992, 2007.
Tilmes, S., Lamarque, J.-F., Emmons, L. K., Kinnison, D. E., Ma, P.-L., Liu, X., Ghan, S., Bardeen, C., Arnold, S., Deeter, M., Vitt, F., Ryerson, T., Elkins, J. W., Moore, F., Spackman, J. R., and Val Martin, M.: Description and evaluation of tropospheric chemistry and aerosols in the Community Earth System Model (CESM1.2), Geosci. Model Dev., 8, 1395–1426, https://doi.org/10.5194/gmd-8-1395-2015, 2015.
van der Werf, G. R., Randerson, J. T., Giglio, L., Collatz, G. J., Mu, M., Kasibhatla, P. S., Morton, D. C., DeFries, R. S., Jin, Y., and van Leeuwen, T. T.: Global fire emissions and the contribution of deforestation, savanna, forest, agricultural, and peat fires (1997–2009), Atmos. Chem. Phys., 10, 11707–11735, https://doi.org/10.5194/acp-10-11707-2010, 2010.
Wang, Y., Jacob, D. J., and Logan, J. A.: Global
simula-tion of tropospheric O3-NOx-hydrocarbon chemistry: 3.
Ori-gin of tropospheric ozone and effects of nonmethane hy-drocarbons, J. Geophys. Res.-Atmos., 103, 10757–10767, https://doi.org/10.1029/98jd00156, 1998.
Ying, Q. and Krishnan, A.: Source contributions of volatile
organic compounds to ozone formation in
south-east Texas, J. Geophys. Res.-Atmos., 115, D17306,
https://doi.org/10.1029/2010JD013931, 2010.