Open Access
Research
Mathematical modeling of endovenous laser treatment (ELT)
Serge R Mordon*
1, Benjamin Wassmer
2and Jaouad Zemmouri
2Address: 1INSERM (French National Institute of Health and Medical Research) IFR 114, Lille University Hospital, Lille, France and 2Osyris SA, Hellemmes, France
Email: Serge R Mordon* - mordon@lille.inserm.fr; Benjamin Wassmer - benjamin.wassmer@osyris.com; Jaouad Zemmouri - jaouad.zemmouri@osyris.com
* Corresponding author
Abstract
Background and objectives: Endovenous laser treatment (ELT) has been recently proposed as an alternative in the treatment of reflux of the Great Saphenous Vein (GSV) and Small Saphenous Vein (SSV). Successful ELT depends on the selection of optimal parameters required to achieve an optimal vein damage while avoiding side effects. Mathematical modeling of ELT could provide a better understanding of the ELT process and could determine the optimal dosage as a function of vein diameter.
Study design/materials and methods: The model is based on calculations describing the light distribution using the diffusion approximation of the transport theory, the temperature rise using the bioheat equation and the laser-induced injury using the Arrhenius damage model. The geometry to simulate ELT was based on a 2D model consisting of a cylindrically symmetric blood vessel including a vessel wall and surrounded by an infinite homogenous tissue. The mathematical model was implemented using the Macsyma-Pdease2D software (Macsyma Inc., Arlington, MA, USA). Damage to the vein wall for CW and single shot energy was calculated for 3 and 5 mm vein diameters. In pulsed mode, the pullback distance (3, 5 and 7 mm) was considered. For CW mode simulation, the pullback speed (1, 2, 3 mm/s) was the variable. The total dose was expressed as joules per centimeter in order to perform comparison to results already reported in clinical studies.
Results: In pulsed mode, for a 3 mm vein diameter, irrespective of the pullback distance (2, 5 or 7 mm), a minimum fluence of 15 J/cm is required to obtain a permanent damage of the intima. For a 5 mm vein diameter, 50 J/cm (15W-2s) is required. In continuous mode, for a 3 mm and 5 mm vein diameter, respectively 65 J/cm and 100 J/cm are required to obtain a permanent damage of the vessel wall. Finally, the use of different wavelengths (810 nm or 980 nm) played only a minor influence on these results.
Discussion and conclusion: The parameters determined by mathematical modeling are in agreement with those used in clinical practice. They confirm that thermal damage of the inner vein wall (tunica intima) is required to achieve the tissue alterations necessary in order to lead the vein to permanent occlusion. However, in order to obtain a high rate of success without adverse events, the knowledge of the vein diameter after tumescent anesthesia is recommended in order to use the optimal energy. As clearly demonstrated by our calculations, both pulsed and continuous mode operations of the laser can be efficient. An interesting observation in our model is that less amount of energy is required in pulsed mode than in continuous mode. Damaging the vein sequentially along its entire length may lead to permanent occlusion. However, the pulsed mode requires a very precise positioning of the fiber after each pullback and the duration of the treatment is much longer. For these reasons, continuous irradiation seems to be preferred by most clinicians. This model should serve as a useful tool to simulate and better understand the mechanism of action of the ELT
Published: 25 April 2006
BioMedical Engineering OnLine2006, 5:26 doi:10.1186/1475-925X-5-26
Received: 14 February 2006 Accepted: 25 April 2006
This article is available from: http://www.biomedical-engineering-online.com/content/5/1/26
© 2006Mordon et al; licensee BioMed Central Ltd.
Introduction
Lower-extremity venous insufficiency is a common medi-cal condition afflicting 25% of women and 15% of men in the United States and in Europe. Great saphenous vein (GSV) reflux is the most common underlying cause of sig-nificant varicose veins. Traditional treatment of GSV reflux has been surgical removal of the GSV. Although sur-gical ligation and stripping of the GSV has been the most durable treatment, it is associated with significant peri-operative morbidity. Less-invasive surgical treatments including high ligation of the GSV at the saphenofemoral junction (SFJ) have been attempted in the hope that grav-itational reflux would be controlled while the vein is pre-served for possible use as a bypass graft. Unfortunately, ligation of the GSV alone usually results in recurrent vari-cose veins. Even when high ligation has been combined with phlebectomy of varicose tributaries or retrograde sclerotherapy, recurrence has been the rule. Therefore, when it is determined that GSV reflux is the principal underlying problem, treatment should involve eliminat-ing this source of reflux with ablation of any associated incompetent venous segments [1].
In an attempt to reduce morbidity and improve recovery time, several minimally invasive techniques have been developed as alternatives to surgery in the last few years. Endovenous laser treatment (ELT) is one of the most promising of these new techniques [2-4]. In 1999, Boné first reported the delivery of endoluminal laser energy [5].
Numerous studies have since demonstrated that this tech-nique is both safe and efficacious. Several wavelengths have been proposed, respectively 810, 940, 980, 1064 and 1320 nm [6-10] with 810, 940 and 980 the most com-monly used. At these wavelengths, power is usually set between 10 and 15 W. The energy is administered endov-enously, either in a pulsed fashion (pulse duration: 1 to 3 s with fiber pull back in 3 to 5 mm increments every 2 sec-onds) or continuously with a constant pullback of the laser fiber (pullback velocity ranging from 1 to 3 mm). At these parameters, doses applied range from 20 J/cm to 140 J/cm [11,12]. These doses induce an heating of the vein wall which is necessary to cause collagen contraction and destruction of endothelium. This stimulates vein wall thickening leading to luminal contraction, venous throm-bosis and vein fibrosis [13]. Since tumescent anesthesia is always delivered, patients feel no pain during endovenous laser ablation at the suggested or commonly used laser parameters. The pain that patients feel occurs 5–8 days following the procedure and is related to the inflamma-tion resulting from a successful endovenous ablainflamma-tion (i.e. wall thickening). It is not related to the presence or degree of ecchymosis nor is it the result of non-target laser dam-age to perivenous tissue. However, if greater doses of energy are delivered, the treatment is becoming painful.
Excessive and nonspecific thermal damage has led to 67% of patients complaining of pain along the treated vein for 1 week in one study using the 940-nm intravascular laser [14].
Consequently, successful ELT must achieve permanent damage of the vessel wall, with both the endothelium (tunica intima) and also the outer layer (tunica externa) requiring sufficient heating. Conversely, to avoid side effects "collateral" damage of the perivenous tissue must be avoided. In this context, reports concerning tempera-tures reached inside vessel lumen during ELT are contro-versial. In the model studied by Zimmet and Min, peak temperatures (maximum: 50°C) of perivenous tissues generated during ELT (810 nm, 12 W, 1.5s-pulse dura-tion) were unlikely to cause permanent damage to the
Graphical representation of the geometry used for simula-tion
Figure 2
Graphical representation of the geometry used for simula-tion.
Ultra sound image recorded after tumescent anesthesia
Figure 1
perivenous tissues. Using another experimental model, Weiss showed that 100% of the laser (810 nm, 12 W, 1s-pulse duration) treated veins showed perforations.
Mathematical modeling of ELT may provide a better understanding of the ELT process and help determine optimal dosage as a function of vein diameter. Although many other models address the laser treatments of blood vessels (Port Wine Stains for example) or Interstitial laser therapy, the mathematical modeling of ELT is yet to be proposed [15-19].
The aim of this paper is to present a mathematical model using dynamic tissue changes based upon the Arrhenius damage model. Numerical simulations are compared to data previously reported in the literature. Optimal param-eters emerging from these calculations can be taken in account for improving ELT clinical application.
Materials and methods
Mathematical modelingAn opto-thermal model of ELT consists of calculations of light distribution, temperature rise and the extent of ther-mal damage. The following sections describe the manner in which each stage has been implemented in our calcula-tions.
Geometrical description of the model
The geometry used to simulate ELT was based on a 2D model consisting of a cylindrical blood vessel (radius: R) including a vessel wall (Thickness: T) and surrounded by infinite and homogenous tissue. Calculations were per-formed for different vein diameters (3, 5 mm) and at dif-ferent distances from the center of the vein: in the tunica
intima, in the tunica externa and at 1, 2 and 3 mm from the tunica externa.
The different vein diameters were chosen since Ultra Sound images recorded after tumescent anesthesia have clearly showed that vein diameters can reach up to 5 mm (figure 1).
Since, a cylindrical blood vessel is going to be symmetrical from its axis, a 2D section along this axis was considered sufficient for the purposes of calculation (figure 2)
Light distribution in tissue
The light emitted from the fiber inserted in the vein was modeled as an isotropically radiating point source. As pre-viously proposed by Lizuka et al, spatial distribution has been considered to be dominated by scattering processes [20]. The light irradiance rate (W.mm-2) of an isotropic
point source emitting Plaser (W) within an infinite homo-geneous medium can be expressed as
where: PLaser (W) : power of the light source
µeff (mm-1) : effective attenuation coefficient
φ µ
π
r P r
Dr
Laser eff
( )
= exp(
−)
( )
4 1
Damage obtained for two different wavelengths (800 nm and 980 nm) power: 12 W, CW, pullback speed : 1.5 mm/s, Energy: 80 J/cm, vein diameter: 3 mm
Figure 4
Damage obtained for two different wavelengths (800 nm and 980 nm) power: 12 W, CW, pullback speed : 1.5 mm/s, Energy: 80 J/cm, vein diameter: 3 mm.
Light distribution inside and outside a 3 mm vein when using a 600 µm fiber
Figure 3
r (mm) : radial distance from the source
D (mm): optical diffusion distance
µeff is determined by the following equation
where µa (mm-1) : absorption coefficient in tissue
µ's (mm-1) : reduced scattering coefficient: = µ
s (1 - g)
µs (mm-1) : scattering coefficient
g : anisotropy factor incorporating the effects of direction-ally dependent scattering.
D (mm) is determined by the following equation:
r is defined by the following equation
Where: x (mm): transverse dimension
z (mm): longitudinal dimension
The absorbed power density (W.mm-3) is expressed as
fol-lows (Welch 1984):
Pabs = µaφ(r) (4)
The first laser pulse is always applied at coordinates (0,0) in figure 1. When using several pulses, the relative posi-tion of the fiber inside the vein is given by:
z' = z - zinc
Where: zinc (mm) is the absolute position of the fiber
inside the vein. This position is calculated for each pulse by taking into account the pull-back distance.
When simulating a continuous irradiation performed with a progressive pull-back of the fiber, the relative posi-tion of each irradiaposi-tion is obtained by taking into account the pull-back speed:
zinc = t × v
where : v (mm.s-1) is the pull back speed.
Calculation of temperature rise
Absorption of light in tissue causes a local elevation in temperature. Tissue heat transfer due to the deposited light is described by the bioheat transfer equation as pro-posed by Zhang et al [21].
Where
T (r,t): temperature (°K)
ρ : density of tissue (g mm-3)
C : specific heat of tissue (J. g-1.°K-1)
µeff = 3µ µa
(
a+ ′µs)
( )
2′ µs
D
a s
a eff
=
+ ′
(
)
=( )
1
3 µ µ 2 3
µ µ
r = x2+z2
∇ ⋅ ⋅ ∇
( )
+ = ∂( )
∂
( )
k T r t P C T r t t
abs p
, , 5
Damage as a function of power, pulse duration and pull back distance for a 5 mm vein diameter (delay between pulses: 2s,
λ = 980 nm)
Figure 6
Damage as a function of power, pulse duration and pull back distance for a 5 mm vein diameter (delay between pulses: 2s, λ = 980 nm).
Damage as a function of power, pulse duration and pull back distance for a 3 mm vein diameter (delay between pulses: 2s,
λ = 980 nm)
Figure 5
Cp = C·ρ: heat capacity (J.mm-3.°K-1)
k = thermal conductivity of tissue (W. mm-1.°K-1)
r = radial distance (mm)
t = time (s)
Values used for calculation are reported in Table 1
Phase transition of blood
In our analysis, we considered that the maximum temper-ature of blood would not exceed 100°C for all laser parameters. Water being the main constituent of blood, the latent heat of water was included in the calculations. It takes 4.18 J to raise the temperature of one gram of water by one degree C. When considering a 50 mm3
cylin-der (diameter: 4 mm, length: 4 mm), the energy required to reach 100°C is 13 J. The latent heat of vaporization of water is 2260 kJ/kg at 100°C. The relationship between pressure and temperature is given by the phase transition diagram of water. At normal pressure: 1.105 Pa and body
temperature 37°C, water is in a liquid state. When the temperature increases, two phenomena can be observed: 1) pressure increases and the water stays in its liquid state, 2) pressure remains constant and water reaches its gaseous state, (steam or vapor) [22] To reach the gaseous state of this 50 mm3 cylinder, (steam or vapor) 119 J will be
required. It is therefore unlikely that the blood will boil during ELT.
If we consider the vessel to be a closed but deformable container, water evaporation will not occur, and conse-quently, water will return to its initial liquid state as soon as the temperature drops back to below 100°C. In conclu-sion, the assumption is that blood temperature stays around 100°C during laser irradiation is both valid and confirmed by previous studies [23].
Damage function
Thermal damage in cells and tissue can be described mathematically by a first-order thermal-chemical rate equation, in which temperature history determines dam-age. Damage is considered to be a unimolecular process, where native molecules transform into a denatured/coag-ulated state through an activated state leading to cell death. Damage is quantified using a single parameter Ω, which ranges on the entire positive real axis and is calcu-lated from the Arrhenius law [24]. Damage Ω is dimen-sionless, exponentially dependent on temperature, and linearly dependant on time of exposure.
where A (s-1) is the frequency factor,
Ea (J. mole-1) is the activation energy,
R (J. mole-1.°K-1) is the universal gas constant,
log log log( exp(
, ) ) Ω
( )
=( )
+ −( )
( )
∫
A E
RT r t dt a
0 6
∞
Isodamage distribution inside tissues: power: 15 W, pulse: 2s, delay: 2s, pull-back distance: 3 mm ; vein diameter: 3 mm; λ = 980 nm)
Figure 8
Isodamage distribution inside tissues: power: 15 W, pulse: 2s, delay: 2s, pull-back distance: 3 mm ; vein diameter: 3 mm; λ = 980 nm).
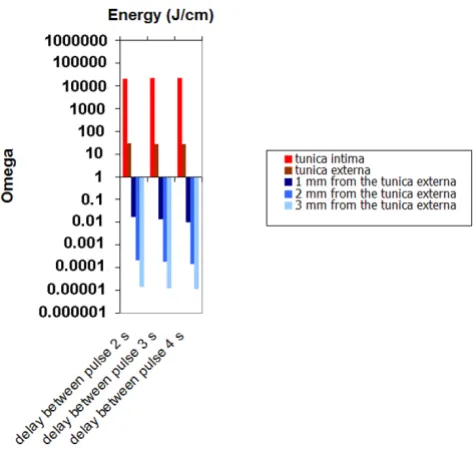
Damage as a function delay between pulse (2s, 3s and 4s)
Figure 7
The activation energy Ea and the frequency factor A are derived from thermodynamic variables. They describe the denaturation process of proteins and other cellular con-stituents. A ranges from 1040s-1 to 10105s-1, and E
a from
105J/mole to 106J/mole [25]. Values used for calculations
are reported in Table 1.
T (°K) is the temperature.
Ω can be determined by the following equation
where: C0 is the concentration of the undamaged mole-cules at the beginning
C(t) is the concentration of the undamaged molecules at
time τ.
The equation indicates that the measure of damage describes the probability of tissue being destroyed. It is the logarithm of the ratio of the initial concentration of undamaged tissue to the concentration once damage has accumulated, for the time interval t = 0 to t = τ. Therefore,
Ω = 1 corresponds to an irreversible damage of 100% of the affected cells.
Numerical implementation
The mathematical model was implemented using the Macsyma-Pdease2D software (Macsyma Inc., Arlington, MA, USA). This Finite Element CAD Software needs to specify the Partial Differential Equations, variables, geom-etry, and boundary conditions; PDEase2D creates both numerical output tables and plots. PDEase2D generates and refines the element grid, adaptively selects time steps, and iterates until it attains convergence in nonlinear prob-lems. And because PDEase2D does automatic error analy-sis, you do not need to make several runs with different meshes to verify convergence. You can choose whether or not to override the automatic defaults
For numerical simulations, parameters commonly used for ELT were used. A 600 µm laser fiber was considered. Two different vessel diameters were evaluated: 3 mm and 5 mm. Laser power (10 & 15 W), pulse duration (1, 2, 3 s), delay (or off-phase) between pulses (2, 3 and 4 s) and pullback distances (3, 5 and 7 mm) were the variables. In this case, thermal energy is applied along the length of the vein by withdrawing the laser fiber in 3, 5 or 7 mm incre-ments.
For CW mode simulation, laser power (10, 15 W) and pullback speed (1,2 and 3 mm/s) were the variables.
An irregular 10 × 60 finite element grid was used. The time steps were 0.1s. The tolerances used to converge the solu-tion were 10-3. The vein wall thickness was considered to
Ω = −lnC t
( )
( )
C0
7
Isodamage distribution inside tissues power: 15 W, pulse: 2s, delay: 2s, pull-back distance: 5 mm; vein diameter: 3 mm, λ = 980 nm)
Figure 10
Isodamage distribution inside tissues power: 15 W, pulse: 2s, delay: 2s, pull-back distance: 5 mm; vein diameter: 3 mm, λ = 980 nm).
Isodamage distribution inside tissues power: 15 W, pulse: 2s, delay: 2s, pull-back distance: 5 mm; vein diameter: 3 mm, λ = 980 nm)
Figure 9
be 0.4 mm. The initial temperature was set at 37°C. The listing of physical parameters used for numerical simula-tion is reported in Table 1.
The product of pullback rate and power yields the total dose of energy delivered to a vein during treatment. Sev-eral studies have suggested that this parameter is a major determinant of treatment outcome [26-28]. In order to compare the results obtained through mathematical mod-eling, the energy per centimeter (J/cm) was calculated.
Results
Light distribution
Figure 3 illustrates how the light is distributed inside and outside a 3 mm vein when using a 600 µm fiber. The line illustrates where 10% of the initial light irradiance rate is obtained.
Wavelength
The role of the laser wavelength was investigated. Figure 4 presents the results of mathematical modeling for 810 and 980 nm, using the same energy of 80 J/cm. Due to its greater absorption in blood, 980 nm leads to slightly greater damage of the tunica intima.
Pulsed mode
Figure 5 (3 mm vein diameter) and Figure 6 (5 mm vein diameter) summarize the results of mathematical mode-ling for the different set of parameters. For a 3 mm vein diameter, irrespective of the pullback distance (2, 5 or 7 mm), at least 15 J/cm is required to achieve permanent damage of the tunica intima. For a 5 mm vein diameter,
permanent damage of the tunica intima is achieved at 15 W and when using a 3 mm pullback distance. A power level of 15 W delivered for 2 s (50 J/cm) or 3s (90 J/cm) is efficacious. A power level of 10 W is too low to lead to per-manent damage of the intima.
Figure 7 shows that the delay between pulses has a very limited effect on wall damage since heat convection play a minor role on heat transport. For a 3 mm diameter vein, energy between 30 J/cm up to 50 J/cm seems to be opti-mal to provide selective damage to the vessel wall.
Figures 8, 9 and 10 display some examples of damage dis-tribution at different sets of parameters. These figures clearly show that pull-back distance plays a major role when determining the energy applied per centimeter.
When using 3 mm increments, the vein is damaged homogenously along its length. When using 5 mm incre-ments, damage is less homogeneous even though the tunica intima is always damaged. Finally, for 7 mm incre-ments, it is evident that the vein is damaged sequentially along the entire length and consequently the energy applied is lower. Cinepak movies of real time isodamage distribution are also provided for figures 8, 9 and 10 (see additional files 1, 2 and 3).
CW mode
Figure 11 displays the results obtained for several set of parameters for a 3 mm vein diameter. Simulations show that for 10 W and 2 mm/s pull-back speed, the tunica
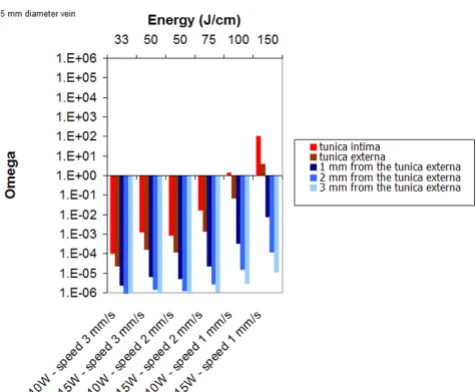
Damage as a function as a function of power and pullback speed for a 5 mm diameter; λ = 980 nm
Figure 12
Damage as a function as a function of power and pullback speed for a 5 mm diameter; λ = 980 nm.
Damage as a function as a function of power and pullback speed for a 3 mm diameter vein; λ = 980 nm
Figure 11
intima is damaged (50 J/cm). A minimum of 100 J/cm is required to obtain a permanent damage of the vessel wall.
Figure 12 displays the results obtained for several set of parameters for a 5 mm vein diameter. Simulations show that for 15 W and 2 mm/s pull-back speed, the tunica intima remains undamaged. A minimum of 100 J/cm is required to obtain a permanent damage of the intima and 150 J/cm to damage the vessel wall.
Figure 13 display one example of damage distribution for CW (Power: 15 W, pullback speed: 1.5 mm/s, Vein diam-eter: 3 mm). This figure shows that the vein is damaged homogenously along its length Cinepak movie of real time isodamage distribution is also provided for figure 13 (see additional file 4)
Discussion
To date, mathematical modeling of ELT has never been proposed. This task was performed to assist in providing a better understanding of the ELT process and possibly to determine the optimal dosage as a function of vein diam-eter. Our model remains a mathematical model, implying that errors may appear owing to the considerations and simplifications required to realize it. Generally, such errors appear because of inaccuracy of the optical, ther-mal, and damage properties that are critical points in the model's set of equations. In fact, these properties play a key role in the accuracy of the results achieved. Many methods have been presented to calculate these properties but still we see differences in the values presented by the different groups, which reflect the difficulty of measuring
these properties. The problem is increased by the reliance of the properties on different variables (temperature, damage) over time. This makes the deviation neither lin-ear nor regular [24].
Before attempting to compare the parameters used for simulation to those usually reported in the literature, the following comments must be made:
1) One of the main problems remains the knowledge of the vein diameters during ELT treatment. Since the vein diameter is considerably reduced after tumescent anesthe-sia, it should be systematically measured. A recent study by Desmyttere et al have demonstrated that after tumes-cent anesthesia, the vein diameter was usually reduced down to 5 mm or less [27].
2) In contrast to the mode of action of VNUS closure (radiofrequency) where a significant shrinkage of the ves-sel wall is observed, Proebstle has clearly demonstrated that, when performing ELT, permanent occlusion, reported at 3 months or later, can be obtained by thermal damage of the tunica intima inner vein wall only [29]. This observation is confirmed by the histological study performed by Corcos et al. They showed that when perma-nent occlusion was observed, the endothelium and intima were always damaged and that success was independent of the vessel wall thickness [30].
The results of mathematical modeling for 810 and 980 nm shows 980 nm leads to a slightly greater damage of the tunica intima when compared to 810 nm. This is owed to
Isodamage distribution inside tissues : power: 15 W, pull-back speed: 1.5 mm/s, vein diameter: 3 mm, λ = 980 nm)
Figure 13
Isodamage distribution inside tissues : power: 15 W, pull-back speed: 1.5 mm/s, vein diameter: 3 mm, λ = 980 nm). Table 1: listing of physical parameters used for numerical simulation
Blood Vessel wall Perivenous tissue References
µa (mm-1) Deoxy-hemoglobin 0.20 (810 nm) 0.28 (980 nm) 0.1 0.030 [32,33]
µ's (mm-1) 0.70 (810 nm) 0.6 (980 nm) 2.0 1.0 [32,33]
µeff (mm-1) 0,86 (980 nm) 0.79 0.30 [32,34]
C (J.g-1.K-1) 3.82 3.78 3.78 [33,34]
ρ(g.mm-3) 1.05.10-3 1.05.10-3 1.05.10-3 [33,34]
k (W.mm-1.K-1) 5.6.10-4 5.6.10-4 5.6.10-4 [33,34]
Ea (J.mol-1) 4.48.105 4.30.105 4.30.105 [34,35]
its better absorption by blood at 980 nm. However, because of the inaccuracy on vein diameter, one can con-sider that the choice of the wavelength between 810 and 980 nm has no influence on the results. This is confirmed by the literature where 810, 940, 980 nm were used for ELT with similar parameters [7,9,10]. Proebstle et al per-formed an in vitro study to evaluate the role of intravascu-lar blood for the effective transfer of thermal damage to the vein wall through absorption of laser energy with 810, 940 and 980 nm. Similar results were obtained with 810 nm, 940 nm and 980 nm [29].
When using the continuous mode (810 nm, 14 W), Tim-perman, has treated 100 veins with an average energy of 95 J/cm (range, 57–145 J/cm; SD: 16 J/cm). Follow-up and success at 1 week was 100%, 96% at 3 month follow-up and finally 95% at 9 month follow-follow-up [31]. Using 58 J/cm, in another series, Timperman reported only a 76% complete vein ablation rate. Similarly, Theivacumar has confirmed that, of all parameters, energy per cm was the main determinant of successful LSV ablation by ELT [26]. The parameters used by Timperman are very similar to those determined by our simulations. In continuous mode, for a 3 mm vein diameter, 50 J/cm are required to damage the vessel wall. For a 5 mm diameter, 100 J/cm are required.
In pulsed mode, it is often difficult to obtain details con-cerning parameters used for ELT. If power and pulse dura-tion are usually reported, informadura-tion concerning speed of fiber withdrawal is usually missing. Results reported in the literature are highly variable and tend to prove that this parameter is not well controlled by the operator. In a study performed in 476 limbs (810 nm, 12 W, 1s and a pull back distance varying from 2 mm to 2.8 mm giving respectively 61 J/cm and 43 J/cm), Theivacumar et al observed that occlusion rates were significantly greater at higher energy levels [26]. Using 50 J/cm, in a series of 56 limbs in 41 patients, Mozes et al reported complete reso-lution at 3-month follow up [11]. Finally, Proebstle et al on a series of 77 patients, performed ELT with a median energy delivery of 23.4 J/cm (range of 11.8 to 35.5) Using these parameters, at 3 months post ELT, 10% of GSVs were found open by color Doppler examination [12]. These results are similar to our calculations in that it was determined that 15 J/cm is required to obtain a perma-nent damage of a 3 mm vein diameter and 50 J/cm for a 5 mm vein diameter.
An interesting observation is that less energy is required in pulsed mode than in continuous mode because the vein is not heated along its entire length. However, as illus-trated in figures 9 and 10, damaging the vein sequentially along its entire length may lead to permanent occlusion.
At last, if steam formation during ELT has already been reported, the interpretation given by the authors is inap-propriate [6]. Steam bubbles originating from boiling blood cannot be the pathophysiological mechanism of action of ELT. The steam produced by absorption of laser energy by the blood is a tiny fraction of the energy neces-sary to damage the vein wall and cannot be the primary mechanism of injury to the vein with endovenous laser. The carbonization and tract within the vein walls seen by histology following endovenous laser can only be the result of direct contact between the laser fiber tip and the vein wall. Venous caliber reduction is maybe due to colla-gen shrinking by simple heating, but media contraction is only obtained by selective 810–980 nm irradiation.
Consequently, the parameters determined through calcu-lation in our model, especially the ones concerning the different outcome in relation with the different diameters, seem to confirm and explain the observations emerged by the clinical practice
Conclusion
The parameters determined by mathematical modeling are in agreement with those used in clinical practice. They confirm that thermal damage of the inner vein wall (tunica intima) is required to achieve the tissue alterations necessary in order to lead the vein to permanent occlu-sion. However, in order to obtain a high rate of success without adverse events, the knowledge of the vein diame-ter afdiame-ter tumescent anesthesia is recommended in order to use the optimal energy. As clearly demonstrated by our calculations, both pulsed and continuous mode opera-tions of the laser can be efficient. An interesting observa-tion in our model is that less amount of energy is required in pulsed mode than in continuous mode. Damaging the vein sequentially along its entire length may lead to per-manent occlusion. However, the pulsed mode requires a very precise positioning of the fiber after each pullback and the duration of the treatment is much longer. For these reasons, continuous irradiation seems to be pre-ferred by most clinicians.
This model should serve as a useful tool to simulate and better understand the mechanism of action of the ELT
Additional material
Additional File 1
The movie shows the isodamage distribution inside tissues using the fol-lowing parameters: power: 15 W, pulse: 2s, delay: 2s, pull-back distance: 3 mm ; vein diameter: 3 mm; λ = 980 nm. The movie belongs to Figure 8. The file can be played using the internet browser.
Click here for file
Acknowledgements
The authors wish to thank Pascal Servell for careful reading of the manu-script.
References
1. Min RJ, Khilnani N, Zimmet SE: Endovenous laser treatment of saphenous vein reflux: long-term results. J Vasc Interv Radiol
2003, 14(8):991-996.
2. Beale RJ, Mavor AI, Gough MJ: Minimally invasive treatment for varicose veins: a review of endovenous laser treatment and radiofrequency ablation. Int J Low Extrem Wounds 2004, 3(4):188-197.
3. Morrison N: Saphenous ablation: what are the choices, laser or RF energy. Semin Vasc Surg 2005, 18(1):15-18.
4. Mordon S: L'endolaser: une alternative à la phlébectomie ambulatoire. Réalités Thérapeutiques en Dermato-Vénérologie 2001, 109:26-31.
5. Boné Salat C: Tratamiento endoluminal de las varices con laser de diodo: estudio preliminar. Rev Patol Vasc 1999, 5:35-46. 6. Proebstle TM, Lehr HA, Kargl A, Espinola-Klein C, Rother W, Bethge S, et al.: Endovenous treatment of the greater saphenous vein with a 940-nm diode laser: thrombotic occlusion after endo-luminal thermal damage by laser- generated steam bubbles.
J Vasc Surg 2002, 35(4):729-736.
7. Chang CJ, Chua JJ: Endovenous laser photocoagulation (EVLP) for varicose veins. Lasers Surg Med 2002, 31(4):257-262. 8. Goldman MP, Mauricio M, Rao J: Intravascular 1320-nm laser
clo-sure of the great saphenous vein: a 6- to 12-month follow-up study. Dermatol Surg 2004, 30(11):1380-1385.
9. Oh CK, Jung DS, Jang HS, Kwon KS: Endovenous laser surgery of the incompetent greater saphenous vein with a 980-nm diode laser. Dermatol Surg 2003, 29(11):1135-1140.
10. Min RJ, Zimmet SE, Isaacs MN, Forrestal MD: Endovenous laser treatment of the incompetent greater saphenous vein. J Vasc Interv Radiol 2001, 12(10):1167-1171.
11. Mozes G, Kalra M, Carmo M, Swenson L, Gloviczki P: Extension of saphenous thrombus into the femoral vein: a potential
com-plication of new endovenous ablation techniques. J Vasc Surg
2005, 41(1):130-135.
12. Proebstle TM, Krummenauer F, Gul D, Knop J: Nonocclusion and early reopening of the great saphenous vein after endov-enous laser treatment is fluence dependent. Dermatol Surg
2004, 30(2):174-178.
13. Weiss RA: Endovenous techniques for elimination of saphen-ous reflux: a valuable treatment modality. Dermatol Surg 2001, 27(10):902-905.
14. Proebstle TM, Gul D, Kargl A, Knop J: Endovenous laser treat-ment of the lesser saphenous vein with a 940-nm diode laser: early results. Dermatol Surg 2003, 29(4):357-361.
15. Sturesson C, Andersson-Engels S: Mathematical modelling of dynamic cooling and pre-heating, used to increase the depth of selective damage to blood vessels in laser treatment of port wine stains. Phys Med Biol 1996, 41(3):413-428.
16. Babilas P, Shafirstein G, Baumler W, Baier J, Landthaler M, Szeimies RM, et al.: Selective photothermolysis of blood vessels follow-ing flashlamp-pumped pulsed dye laser irradiation: in vivo results and mathematical modelling are in agreement. J Invest Dermatol 2005, 125(2):343-352.
17. Anvari B, Rastegar S, Motamedi M: Modeling of intraluminal heat-ing of biological tissue: implications for treatment of benign prostatic hyperplasia. IEEE Trans Biomed Eng 1994, 41(9):854-864.
18. Beacco CM, Mordon SR, Brunetaud JM: Development and exper-imental in vivo validation of mathematical modeling of laser coagulation. Lasers Surg Med 1994, 14(4):362-373.
19. Glenn TN, Rastegar S, Jacques SL: Finite element analysis of tem-perature controlled coagulation in laser irradiated tissue.
IEEE Trans Biomed Eng 1996, 43(1):79-87.
20. Iizuka MN, Vitkin IA, Kolios MC, Sherar MD: The effects of dynamic optical properties during interstitial laser photoco-agulation. Phys Med Biol 2000, 45(5):1335-1357.
21. Zhang R, Verkruysse W, Aguilar G, Nelson JS: Comparison of dif-fusion approximation and Monte Carlo based finite element models for simulating thermal responses to laser irradiation in discrete vessels. Phys Med Biol 2005, 50(17):4075-4086. 22. Chang IA, Nguyen UD: Thermal modeling of lesion growth with
radiofrequency ablation devices. Biomed Eng Online 2004, 3(1):27.
23. Shafirstein G, Baumler W, Lapidoth M, Ferguson S, North PE, Waner M: A new mathematical approach to the diffusion approxi-mation theory for selective photothermolysis modeling and its implication in laser treatment of port-wine stains. Lasers Surg Med 2004, 34(4):335-347.
24. Mohammed Y, Verhey JF: A finite element method model to simulate laser interstitial thermo therapy in anatomical inhomogeneous regions. Biomed Eng Online 2005, 4(1):2. 25. Welch A, Van Gemert M: Optical-Thermal Response of
Laser-Irradiated Tissue. New York: Plenum Press; 1995.
26. Theivacumar N, Beale RJ, Mavor AI, Gough MJ: Factors influencing the effectiveness of Endovenous Laser Treatment (EVLT) for varicose veins due to saphenofemoral (SF) and long saphenous (LSV) reflux. Ireland TVSoGBa, editor. In The Vas-cular Society Yearbook London, UK; 2005:40.
27. Desmyttere J, Grard C, Mordon S: A 2 years follow-up study of endovenous 980 nm laser treatment of the great saphenous vein: role of the blood content in the GSV. Medical Laser Appli-cation 2005, 20:283-289.
28. Mundy L, Merlin TL, Fitridge RA, Hiller JE: Systematic review of endovenous laser treatment for varicose veins. Br J Surg 2005, 92(10):1189-1194.
29. Proebstle TM, Sandhofer M, Kargl A, Gul D, Rother W, Knop J, et al.: Thermal damage of the inner vein wall during endovenous laser treatment: key role of energy absorption by intravascu-lar blood. Dermatol Surg 2002, 28(7):596-600.
30. Corcos L, Dini S, De Anna D, Marangoni O, Ferlaino E, Procacci T, et al.: The immediate effects of endovenous diode 808-nm laser in the greater saphenous vein: morphologic study and clini-cal implications. J Vasc Surg 2005, 41(6):1018-24.
31. Timperman PE: Prospective evaluation of higher energy great saphenous vein endovenous laser treatment. J Vasc Interv Radiol 2005, 16(6):791-794.
32. Spinelli L, Torricelli A, Pifferi A, Taroni P, Danesini GM, Cubeddu R: Bulk optical properties and tissue components in the female
Additional File 2
The movie shows the isodamage distribution inside tissues using the fol-lowing parameters: power: 15 W, pulse: 2s, delay: 2s, pull-back distance: 5 mm ; vein diameter: 3 mm; λ = 980 nm. The movie belongs to Figure 9. The file can be played using the internet browser.
Click here for file
[http://www.biomedcentral.com/content/supplementary/1475-925X-5-26-S2.avi]
Additional File 3
The movie shows the isodamage distribution inside tissues using the fol-lowing parameters: power: 15 W, pulse: 2s, delay: 2s, pull-back distance: 7 mm ; vein diameter: 3 mm; λ = 980 nm. The movie belongs to Figure 9. The file can be played using the internet browser.
Click here for file
[http://www.biomedcentral.com/content/supplementary/1475-925X-5-26-S3.avi]
Additional File 4
The movie shows the isodamage distribution inside tissues using the fol-lowing parameters: : power: 15 W, pull-back speed: 1.5 mm/s, vein diam-eter: 3 mm, λ = 980 nm. The movie belongs to Figure 13. The file can be played using the internet browser.
Click here for file
Publish with BioMed Central and every scientist can read your work free of charge "BioMed Central will be the most significant development for disseminating the results of biomedical researc h in our lifetime."
Sir Paul Nurse, Cancer Research UK
Your research papers will be:
available free of charge to the entire biomedical community
peer reviewed and published immediately upon acceptance
cited in PubMed and archived on PubMed Central
yours — you keep the copyright
Submit your manuscript here:
http://www.biomedcentral.com/info/publishing_adv.asp
BioMedcentral breast from multiwavelength time-resolved optical
mam-mography. J Biomed Opt 2004, 9(6):1137-1142.
33. Cheong W, Welch A: Analysis of optical and thermal behavior of laser assisted balloon angioplasty. IEEE Trans Biomed Eng
1999, 36(12):1233-1243.
34. Pfefer TJ, Choi B, Vargas G, McNally KM, Welch AJ: Pulsed laser-induced thermal damage in whole blood. J Biomech Eng 2000, 122(2):196-202.