613
Copyright © 2011-15. Vandana Publications. All Rights Reserved.
Volume-5, Issue-3, June-2015
International Journal of Engineering and Management Research
Page Number: 613-617
FPGA Implementation of CT/MRI Image Fusion using Lifting-based
Discrete Wavelet Transform
Priyanka L. Darkunde1, Sushma S. Agrawal2
1
PG Student, Department of Electronics and Telecommunication Engineering, Government College of Engineering, Aurangabad (M.S.), INDIA
2
Assistant Professor, Department of Electronics and Telecommunication Engineering, Government College of Engineering, Aurangabad (M.S.), INDIA
ABSTRACT
The goal of image fusion is to combine two or more images into a single image, keeping the important information from each of the original images. Image fusion is a technique to improve the image content such that the resultant fused image will be useful for further analysis tasks. This paper presents FPGA implementation of fusion of medical images such as computer tomography (CT) and magnetic resonance imaging (MRI) images, based on application of lifting-based scheme of discrete wavelet transform. Pixel level fusion rules are applied after one level wavelet decomposition of input images. The results of proposed methods are compared and analyzed with different image quality metrics such as entropy, MES and PSNR.
Keywords— Discrete wavelet transform (DWT), lifting scheme, haar transform, image fusion, FPGA, CT image, MRI image.
I.
I
NTRODUCTIONWith the fast development of number of image sensors, image fusion techniques has been extensively used in various fields, including computer vision, medical imaging, satellite imaging and remote sensing, etc. Image fusion is a technique to merge two or more input images, keeping the important content, without introducing any distortion, artifacts or loss of information. In the process of image fusion, corresponding information is integrated from two input images to obtain more accurate and reliable fused image the quality of which cannot be achieved otherwise. Therefore, the new fused image will be more informative than any of the single input images and is more helpful and suitable for human visual perception and machine perception or further analysis tasks [1]. Medical image fusion performs the matching operation and fusion between two or more input images such as CT and MRI images obtained from different medical imaging equipments.
Discrete Wavelet Transform (DWT) is very useful tool for image processing applications because of efficiency and image quality it offers. Convolution-based scheme and Lifting-based scheme are the two schemes available for implementation of DWT. In the lifting-based scheme, the high pass filters and low-pass filters are broken up into a series of upper and lower triangular matrices and the filter implementation of DWT is transformed into matrix multiplications. The lifting-based scheme of DWT has become more popular and more powerful tool over the convolution-based scheme for its simplified computation, parallel and fast implementation, in place computation, integer to integer mapping, low memory requirement.
The rest of the paper is organized as follows. Section II briefs about lifting scheme of DWT. Various fusion rules have been discussed in section III. Section IV proposes image fusion rules presented in the paper. Results are compared in section V. Section VI concludes this paper.
II.
L
IFTING-B
ASEDS
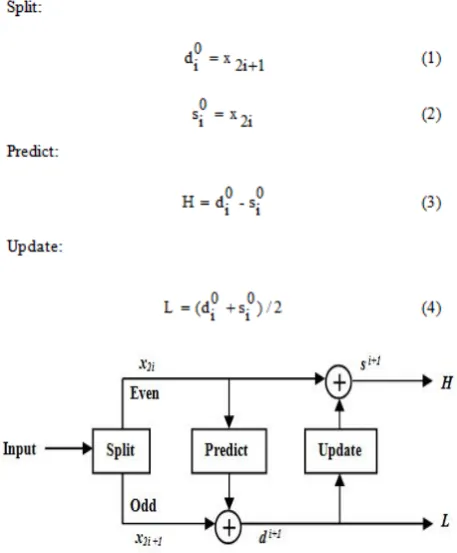
CHEMEThe Wim Sweldens [2] developed the lifting scheme for the construction of biorthogonal wavelets and according to [3], every wavelet filter bank can be decomposed into a lifting scheme. Lifting scheme is based on data correlation. Fig. 1 shows the structure of lifting scheme consisting of three steps, Split, Predict and Update. The input data is divided into even samples i.e. x2i and odd
samples i.e. x2i+1 using split step. In predict step, even
samples are used to predict odd samples. Odd samples are replaced by odd ones minus the even sample to obtain detail coefficients H, also known as wavelet coefficients. Update step uses obtained detail coefficients H
Split:
to update even samples and gives approximation coefficients L, also known as scaling coefficients.
614
Copyright © 2011-15. Vandana Publications. All Rights Reserved.
Lifting steps for inverse haar transform are as follows.III.
I
MAGE FUSION METHODSImage fusion method can be generally grouped in to three categories- (i) Pixel level (ii) Feature level (iii) Decision level. In Pixel level image fusion, information associated with each pixel is determined from a set of pixels in source images to improve the performance of image processing tasks. Pixel level fusion has the advantage that the images used contain the original measured quantities, and the algorithms are computationally efficient and easy to implement, the most image fusion applications employ pixel level based methods. Pixel level image fusion methods are as follows. A. Wavelet Average Method
Once the images have been separated into their lifting based wavelet coefficients, the simple average algorithm is applied to each of the coefficients. In this
method, the resultant fused image is obtained by taking the average intensity of corresponding pixels from both the input image. This method is very simple, easy to understand and easy to implement. Averaging method works well when images to be fused from same type of sensor and contain additive noise. This method proves good for certain particular cases where in the input images have an overall high brightness and high contrast. This method leads to undesirable side effect such as reduced contrast. With this method some noise is easily introduced into the fused image, which will reduce the resultant image quality consequently [4].
B. Wavelet Maximum/Minimum Method
After separating the images into their lifting based wavelet coefficients, the simple maximum/minimum pixel algorithm is applied to each of the coefficients. The maximum/minimum intensity of corresponding pixels from both the input image is selected to obtain the resultant fused image. A selection process if performed here wherein, for every corresponding pixel in the input images, the pixel with maximum/minimum intensity is selected, respectively, and is put in as the resultant pixel of the fused image. This method results in highly focused image output obtained from the input image as compared to average method. This method has disadvantage of blurring effect which directly affect on the contrast of the image [5].
IV.
P
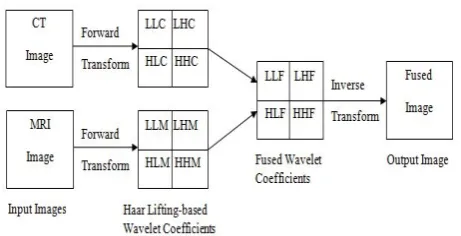
ROPOSED METHODSThe lifting based wavelet transform contains the low-high bands, the high-low bands and the high-high bands of the image at different scales, plus the low-low band of the image at coarsest level. Except for the low-low band which has all positive transform values, all other bands contain transform values in these bands correspond to sharper brightness values and thus to the salient features in the image such as edges, lines, and region boundaries. Selection of fusion rule plays an important role in the process of image fusion. In this paper, pixel level image fusion methods are implemented on FPGA platform. The steps involved in image fusion using wavelet transform for hardware implementation on FPGA are given below and shown in Fig. 2.
1) Get the input images to be fused, MRI image and CT image.
2) Apply the lifting based wavelet transform on both the images through chosen wavelet at the desired level. In the paper, one level decomposition is performed using lifting based haar wavelet transform.
3) Get the approximation and detail coefficients for both the input images.
4) Merge the approximation and detail coefficients of both the input images by desired fusion rule.
615
Copyright © 2011-15. Vandana Publications. All Rights Reserved.
Following fusion rules are used in this paper.Table I summarizes fusion rules proposed in the paper along with method applied for each band of input images. A. Method I:Mean-Max-Mean
In the method I, the resultant low-low band i.e. LLF band is obtained by taking the average of corresponding pixels from both the input low-low bands i.e. LLC band and LLM band. The maximum intensity of corresponding pixels is selected from both the input high-low bands i.e. HLC band and HLM band to get the resultant high-low band i.e. HLF band. From the two input low-high bands i.e. LHC band and LHM band, the resultant low-high band i.e. LHF band is obtained by selecting the maximum intensity of corresponding pixels. The resultant high-high band i.e. HHF is obtained by calculating the average of corresponding pixels from both the input high-high bands i.e. HHC band and HHM band. B. Method II: Mean-LHM-HLC-Mean
Here, in this method, the average of corresponding pixels from both the input LLC band and LLM band taken to obtain the resultant LLF band. Using both the input HHC band and HHM band, average is calculated for corresponding pixels and resultant HLF band is obtained. For selection of resultant HLF band and LHF band, sum of all pixel values in each decomposed band is calculated for both input images. The resultant HLF band and LHF band is selected for which sum value is greater than the sum value of band of other image.
>
=
∑
∑
else
HLM,
j)
MRI(i,
j)
CT(i,
HLC,
HLF
>
=
∑
∑
else
LHC,
j)
CT(i,
j)
MRI(i,
LHM,
LHF
In the paper, sum value of HLC band for input image II i.e. CT image is greater than the sum value of the same band i.e. HLM band for input image I i.e. MRI image, resultant HLF band is the HLC band of CT image. LHM band of MRI image is selected as resultant LHF band as sum all pixel values in LHM band is greater than LHC band of CT image.
C. Method III: Mean-LHM-HLC-Min
For this method, both the input HHC band and HHM band are used to choose minimum intensity from corresponding pixels to obtain resultant HHF band. For
selection of resultant LLF band, HLF band and LHF band, same rules are used which are described in the method II.
TABLE I
SUMMARY OF PROPOSED IMAGE FUSION METHODS
Method LLF Band LHF Band HLF Band HHF Band Method I: Mean-Max-Mean Averag e Maximu m Maximu m Average Method II: Mean-LHM-HLC-Mean Averag e LH Band of MRI HL Band of CT Average Method III: Mean-LHM-HLC-Min Averag e LH Band of MRI HL Band of CT Minimu m
V.
HARDWARE
IMPLEMENTATION
R
ESULTS&
P
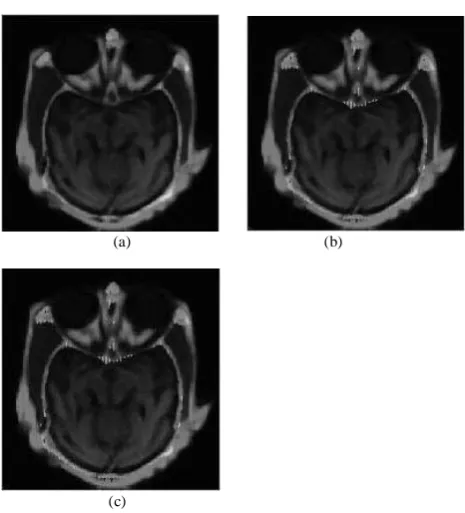
ERFORMANCE ANALYSISIn the paper, for image fusion methods II and III, the resultant LHF band is the LHM band of MRI image and the resultant HLF band is the HLC band of CT image. The MRI image and CT image used as input images are shown in Fig. 3. Fig.4 shows the results of the proposed methods.
The proposed image fusion methods based on haar lifting scheme are synthesized using Xilinx ISE 14.7 for Xilinx Virtex-5 xc5vsx50t-1ff1136 FPGA target device. Input images, CT image and MRI image are of size 256 by 256. The resultant fused images obtained from the proposed fusion methods are of size 256 by 256. For hardware implementation on FPGA, coefficient files of input CT/MRI Images are loaded into the required memory blocks. The input images are decomposed, fusion methods are applied and fused image is reconstructed using hardware description language VHDL. The FPGA device utilization summary for the proposed fusion methods is reported in Table II.
Performance of the resultant fused image is evaluated by entropy, mean square error (MSE) peak signal to noise ratio (PSNR) and correlation coefficient. A. Entropy
Entropy is a measure to calculate average information present in the image. If entropy of fused image is found to be high, it shows that image has good amount of information.
Entropy of the image is given by
∑
− =−
=
M 10 k
k 2 k
log
(p
)
p
H
where., M is the number of gray levels and pk
B. Mean Squared Error and Peak Signal to Noise Ratio is the probability associated with gray level k.
616
Copyright © 2011-15. Vandana Publications. All Rights Reserved.
good fusion of input images. PSNR is mostly defined viathe mean squared error. Smaller value of mean squared error implies the better image quality. In this paper, PSNR and RMSE are used to evaluate the effectiveness of the proposed fusion methods.
TABLE II
FPGA DEVICE UTILIZATION SUMMARY FOR THR PROPOSED IMAGE FUSION METHODS, IMAGE
SIZE=256 × 256
The MSE between the reference image R and fused image F are defined as follows.
∑∑
− =−
=
−
=
M 10 i 1 N 0 j 2
J)]
F(i,
j)
[R(i,
MN
1
MSE
where, R is the reference image, F is the fused image, i and j are image dimensions, M×N is the size of the image.
The PSNR measure is given by
)
MSE
MAX
(
10.log
PSNR
2 10=
where, MAX is the maximum possible pixel value of the image.
C. Correlation Coefficient
The correlation coefficient is used to calculate similarity between fused image and reference image. It is given by the following equation.
−
−
−
−
=
∑∑
∑∑
∑∑
− = − = − = − = − = − = 1 M 0 i 1 N 0 j 2 1 M 0 i 1 N 0 j 2 1 M 0 i 1 N 0 j)
F'
j)
(F(i,
)
R'
j)
(R(i,
)
F'
j)
)(F(i,
R'
j)
(R(i,
r
where, R is the reference image, F is the fused image, i and j are image dimensions, M×N is the size of the image, R’ is mean value of R and F’ is mean value of F.
Table III shows performance analysis of the proposed image fusion methods. On applying the fusion methods proposed in the paper, it is observed that Method I: Mean-Max-Mean gives the best result with MSE of 466.258, PSNR of 21.4785 and correlation coefficient of 0.8615. It is also observed that this method has good entropy of 6.0260.
TABLE III
PERFORMANCE ANALYSIS OF PROPOSED IMAGE FUSION METHODS
Method Entro py
MSE PSNR Correlati on Method I: Mean-Max-Mean 6.026 0 466.2 58 21.47 85 0.8615 Method II: Mean-LHM-HLC-Mean 6.091 9 527.8 49 20.93 97 0.8390 Method III: Mean-LHM-HLC-Min 6.092 2 526.3 37 20.95 22 0.8395
(a) (b)
(c)
Fig. 4. (a) Result of Method I: Mean-Max-Mean (b) Result of Method II: Mean-LHM-HLC-Mean (c) Result of method III: Mean-LHM-HLC-Min
(a) (b)
617
Copyright © 2011-15. Vandana Publications. All Rights Reserved.
VI.
C
ONCLUSIONIn this paper, lifting-based scheme of discrete wavelet transform is used for image fusion of CT/MRI images on FPGA. Three methods of image fusion, on the basis of pixel level image fusion are proposed. Out of the three methods, one method is based on wavelet average rule and wavelet maximum rule. The remaining two methods are based on sum of all pixel values in each band, for both input images along with average rule and maximum/minimum rule. Results of all fusion rules are compared with image metrics, entropy MSE, PSNR and correlation coefficient. Analysis results shows that lifting scheme based image fusion of CT/MRI images is a effective method of medical image fusion.
REFERENCES
[1] G. Pajares, J. M. D. L. Cruz, “A wavelet-based image fusion tutorial, Pattern Recognition,” vol. 37, no. 9, pp. 1855–1872, 2004.
[2] W. Sweldens, “The lifting scheme: A custom-design construction of biorthogonal wavelets,” Appl. Comput. Harmon. Anal., vol. 3, no. 2, pp. 186– 200, Apr. 1996. [3] Daubechies and W. Sweldens, “Factoring wavelet transforms into lifting steps,” J. Fourier Anal. Appl., vol. 4, no. 3, pp. 247–269, 1998.
[4] Zang Bin, “Study on Image Fusion Based on Different Fusion Rules of Wavelet Transform”, 3rd International Conference on Advanced Computer Theory and Engineering (ICACTE), vol. 3, pp. 649-653, 2010.
[5] Anjali Malviya, S. G. Bhirud, “Wavelet Based Multi-Focus Image Fusion”, International Conference on Methods and Models in Computer Science, 2009.