aAssist. Prof., PhD., Trakya University, Department of Health Management, Edirne, Turkiye, emreatilgan@trakya.edu.tr
Abstract: In this study, the efficiency analysis of Turkish Ministry of Health (MoH) hospitals’ inpatient care services is done by using the Stochastic Frontier Analysis (SFA) method. In the analysis, cross-sectional data on 459 acute-care hospitals in 2013 were used and the sample was consisted of only MoH general and teaching hospitals. A cross sectional version of SFA inefficiency efeects model speciiccation is used to estimate the inpatient care service production efficiency. The results of this paper suggest that, the technical inefficiency of inpatient care services of MoH hospitals is closely related with the hospital size. As the hospital capacity decreases or/and the role group of the hospital lowers down, the hospital efficiency scores reduces signiiccantly. The other important icnding of this paper is that the efficiency scores are inversely related with the socio-economic development level of the region or province where the hospital is located. The mean efficiency scores decreases in the western part of the Turkey which has the regions that are socio-economically more developed and more populated compared to the others.
Keywords: Stochastic Frontier Analysis, Technical Efficiency, Hospital Efficiency, Inpatient Care Services, Inefficiency Effects
JEL Classification: D24, I11
1. Introduction
As in all other countries, health expenditure is also progressively increasing in Turkey. As is well known, the growth of health expenditure is related with aging of the society, increasing demand for health services created by income growth, epidemiological changes and especially with the use of advanced diagnostic and treatment methods. This process inevitably led the policy makers to provide tools to control the growth of health expenditure in countries such as Turkey, where the health services are substantially financed by public resources. Within the health services production units, the largest share of government health resources is consumed by the hospitals. Therefore the analysis of hospital efficiency and productivity in hospital services became a matter of priority for both researchers and policy makers as efficiency improvements in those services yield utmost important benefits for the health system and the public entirely.
In the last decade, the structure of Turkish health system has been changed evidently with the implementation of the Health Transformation Program (HTP), which was announced with the aim of achieving efficiency and effectiveness in the use of financial resources in health sector, by imposing reforms
Emre Atılgan
aBusiness and Economics Research Journal
Volume 7
Number 2
2016
pp. 203-214
ISSN: 1309-2448 DOI Number: 10.20409/berj.2016217537related to health care delivery, finance and human resources1. HTP was constructed on three main pillars.
The first main pillar was the reforms regarding health care delivery and social security, i.e. all Social Insurance Organizations’ (SII) health facilities were transferred to the Ministry of Health (MoH) which was then followed by the announcement of the General Health Insurance Program (GHIP) in 2008. The second main pillar was the establishment of family physicians in the primary health care scheme. The last one was the enactments of the Public Hospital Associations (PHA) in 2012, which are basically regional hospital unions.
Establishment of the PHAs introduced a new management model for Turkish public hospitals and their managers on the basis of institutional performance. Thus, in recent years, the hospital efficiency analysis that holds key for hospital performance assessment, is located at the core of Turkey Ministry of Health policy applications. The performance assessment of Turkish public hospitals are being done in a framework of the Balanced Score Card approach. In the performance assessment of these hospitals, SFA production efficiency analysis holds a key position. As briefly explained by Atilgan (2016), in in this assessment model, the efficiency scores are being estimated in four dimensions; that is hospital’s outpatient, inpatient, surgery and emergency service productions. By using the Stochastic Frontier Analysis (SFA) method.
In this study, the efficiency analysis of Turkish public hospitals’ inpatient care services is done by using SFA, with respect to a similar model that is used by MoH for hospital performance assessment. The main purpose of the study is to analyze the distribution of efficiency scores within the hospitals with respect to some key hospital characteristics, as well as assessing the environmental factors that affect the efficiency scores on the basis of regional differences. Accordingly, while being one of the rare examples of SFA hospital efficiency studies in Turkish case, this study also tries to contribute to the hospital efficiency literature by introducing one of the MoH’s hospital efficiency assessment model in an analytical way with respect to theoretical basics.
The rest of the paper is organized as follows. In the second section, a literature review on hospital efficiency studies is given. In the third section, research design and methods are introduced with the model specifications and the data used in the analysis. In the section four, the results of the estimations are given. Then the paper concludes with discussions.
2. Literature Review
Since the pioneer study of Wagstaff (1989), who examined the efficiency of Spanish hospitals, a wide literature has been conducted on efficiency estimation of hospitals with SFA. While the majority of these studies carried out with US hospitals2, a considerable number of studies are also performed with other
countries’ data, i.e. Australia (Paul, 2002), Finland (Linna, 1998; Linna & Hakkinen, 1998), Belgium (Bosmans & Fecher, 1995), Portugal (Dismuke & Sena, 2001) and Italia (Daidone & D’Amico, 2009).
Bilsel & Tarcan (2014) analyzed the performance of 330 Turkish provincial general hospitals for the year 2009, using DEA with a directional distance approach and found that congested hospitals’ inefficiency scores are negatively related to patient satisfaction. On the other hand, the study indicated that the hospitals located in the emigrating regions are better off in terms of efficiency when compared to the hospitals located in immigrating regions. In a more recent study, Gok & Altındağ (2015), analyzed the effects of the pay for performance system on the efficiencies of public and private hospitals in Turkey, with a sample of 251 hospitals of which 25 are private and 226 are public for the years 2001-2008. According to the results of their study, while the average efficiencies of public hospitals tend to increase particularly in the implementation period of the pay for performance system, the change in the average efficiencies of private hospitals was vice versa.
The number of studies concerning the efficiency estimation of Turkish hospitals using SFA method is limited with the examples Atilgan & Caliskan (2015) and Atilgan (2015). Atilgan & Caliskan (2015) estimated cost efficiencies of Turkey MoH hospitals with a panel data for the years 2007, 2008 and 2009, using SFA model in which the cost function was described by translog technology. The main aim of the study was to determine the effect of performance-based supplementary payment system, which was introduced after HTP, on the hospital cost efficiency. The study suggests that the performance-based supplementary payment system does not increase the cost efficiency of hospitals. Moreover, while hospitals efficiency is found to be inversely associated with the population and socio-economic development level of regions, the results of their analysis also asserted a positive correlation between the hospital capacity and the efficiency scores. Atilgan (2015) used SFA to estimate the technical efficiency of hospital outpatient care services, with a sample of 589 MoH hospitals for the year 2014. In the study, the SFA model was described with a translog production technology with inefficiency effects, which is similar to the one that is being used by the Turkish Public Hospitals Institution (PHI) to evaluate the technical efficiency of outpatient care for the MoH hospitals. The results of the study indicated significant differences in hospital efficiency distribution across Turkey’s regions, where the socio-economic development level of the region is found to contribute the technical efficiency scores of outpatient care services. Additionally, the study suggested that hospital capacity is positively associated with efficiency scores.
3. Research Design and Methods
Technical efficiency refers to producers’ choices to allocate the resources at their disposal to obtain the maximum possible output from given inputs, or to use the minimum possible inputs in the production of a given level of outputs (Coelli, Rao, O'Donnell, & Battese, 2005). The efficient production bundles (input-output) are the frontiers of production. The technical inefficiency of a firm is then measured by the deviation from its production frontier. As seen from these definitions, any analysis on technical efficiency needs two different information: information about the frontier and information about the deviation from frontier. If the frontier is not known, then it has to be estimated.
The most general and the unrestricted model specification of SFA model is as:
,
i i i i
Y
f x E
(1)where Yi represents production,
x
is a vector of inputs,E
is a vector of control variables and
isthe composite error term which can be decomposed as
i vi ui, wherev
is the statistical noise whichassumed to be distributed
2N 0, σ , and
u
is the positive deviation from the production frontier whichrepresents production (technical) inefficiency and assumed to be independently distributed as truncations at zero of the
2
,
i u
N m
distribution. Thus the model defined as the inefficiency effects model where'
i i i
m z
e and zi is a px1 vector of variables which may influence the efficiency of a hospital, and
is a1xp vector of parameters to be estimated (Battese & Coelli, 1995).
The SFA model could be defined different from the one given in Equation (1). Imposing restrictions to the distribution of inefficiency part of the composite error term or/and using panel data are also practicable. The composite error term,
u
, could be assumed to have a half-normal distribution, gamma (Greene, 1980a, 1980b) and a more general distribution such as the truncated normal (Stevenson, 1980) in SFA studies. As of now, there are no theoretical reasons for selection of the distributional forms ofu
. While Coelli et al. (2005) indicates that the truncated normal distribution assumption has a potential to partially alleviate the distribution problem, Rosko (2001) and Rosko & Mutter (2008) both reported that varying assumptions about the distribution of the deterministic error has had little impact on the estimated inefficiencies in the health care inefficiency literature.3.1. Model Specification
In this study, a cross sectional version of Battese & Coelli (1995) SFA specification is used to estimate the inpatient care service production efficiency , which is same with the model that is being used by MoH for hospital efficiency assessment. This specification allows to estimate the correlates of inefficiency, namely inefficiency effects, in one step process. The production function is specified under the translog production technology, which characterizes a flexible functional form, is commonly used by the researchers to avoid modeling errors or/and to get flexibility in the specification of input and output relations without having a-priory assumptions (Rosko & Mutter, 2008).
The model specifications is as follows:
4 4 4
0
1 1 1
1
Ε 2
h i ih ik ih kh i İh it it
i i k
lny
lnx
lnx lnx
v u
(2)In Equation (2),
,
ve
are the parameters to be estimated, and h:1,….., n represents the hospitals where; yh: output of hospital h, xih: inputs of hospital h, Εih: control variables,v
is the statisticalnoise which assumed to be distributed N 0, σ
2 , andu
is the positive deviation from the production frontier which represents production (technical) inefficiency and assumed to be independently distributed as truncations at zero of the N m
i,
u2
distribution. Thus, the model defined as the inefficiency effects model where 'i i i
m z
e and zi is a px1 vector of variables which may influence the efficiency of a3.2. Data and Variables
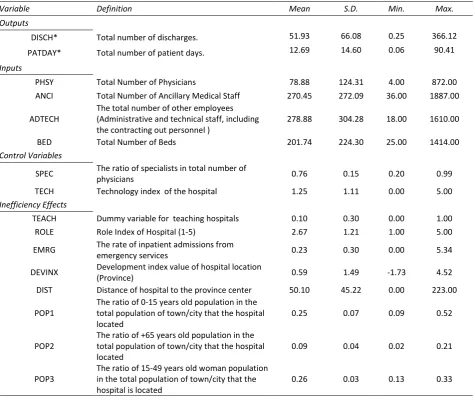
Cross-sectional data on 459 acute-care hospitals in 2013 were used and the sample was consisted of only MoH general hospitals including the teaching hospitals. To ensure the data homogeneity, the hospitals which had incomplete input and output data and those with less than 25 beds were excluded from the sample. For reasons of confidentiality, the real names of the hospitals were withheld in this study. The description of the variables used in the models are presented in Table (1) with summary descriptive statistics.
3.2.1. Input and Output Variables
In the literature, there is no yet a consensus on the correct measure of inpatient activity in a hospital. Whether to choose patient days or discharges as a measure of inpatient care output depends on the hospitals’ internal conditions. Li & Rosenman (2001) suggest the use of discharges when the majority of the costs for a patient is incurred by the visit, indicating that most costs are fixed. However, labor is a variable input and its use is usually dependent on the number of patient days rather than the number of discharges. Therefore, they recommend to use patient days as a measure of inpatient care output. On the other hand Rosko & Mutter (2008) suggest to use discharges as a measure of inpatient care output. They claim that the use of the patient days has several disadvantages since the magnitude of patient days could be affected by the differences in hospitals’ discharge planning, quality improvements or by the variations in case-mix. Grannemann, Brown, & Pauly (1986) suggest the use of a combination of the two variables in order to analyze both of the hotel service and treatment aspects of health care delivered in hospitals.
In this study, both of the inpatient care output measures, discharges and patient days, are used by defining to different single output production models. In the first model, the hospitals’ output is measured by the total number of discharges and the output variable named as DISCH. In the second model, the total patient days is used to measure inpatient care output and the variable named as PATDAY. The output variables is not adjusted due to the unavailability of data that measures the case-mix of general hospitals in Turkey. Therefore, it is assumed that there were no systematic differences in case-mix across sample hospitals, vice versa, the results could be biased.
Four different inputs are used in both of the production functions of DISCH and PATDAY models. Three of them represents the labor input used in the hospitals. PHSY is the total number of physicians, including general practitioners, specialist doctors for non-teaching hospitals. Full time employed residents (assistant physicians/trained physicians) are accounted in PHSY for the teaching hospitals, as the residents also take a part in the production process of the inpatient care services. The other labor input variable ANCI is the total number of ancillary (allied) medical staff, those who are taking active role in providing health care, i.e. nurses, paramedics etc. The last labor input variable ADTECH is the total number of the other employees, which consists from administrative and technical staff, including the contracted personnel. The variable BED, being a proxy for capital input, is the total number of the hospital beds.
3.2.2. Control Variables
The inputs used in the hospitals are heterogeneous in terms of quality. In the production functions, two different control variables are used to capture the input quality differences in both of the models. SPEC is the ratio of specialists in total the number of physicians, and TECH is the technology index of the hospital that represents the use of high-tech diagnostics in the hospitals. The index consists of CT, MRI, CT Simulator, SPECT-CT, PET-CT/PET scanners. Any of those scanners presents in a hospital makes a contribution of one point to the index, thus TECH takes the values between 0 – 5 (i.e. if any hospital has all the high-tech diagnostics, then the TECH index value would be 5).
3.2.3. Inefficiency Effects
influence of managerial actions- are defined in the stochastic frontier regression models. Three of them are hospital-specific factors and the rest five variables account the effect of hospital environment on the efficiency.
TEACH is a dummy variable for teaching hospitals. ROLE is an index of hospitals defined on the basis of MoH’s hospital role classification. In the MoH’s hospital classification scheme, general hospitals are classified into E, D, C, B, A2 and A1 groups3. The sample of the study does not have any E group hospital.
Therefore, the variable ROLE takes to values of 1, 2, 3, 4, and 5 for the hospital role groups D, C, B, A2 and A1 respectively. The last hospital specific efficiency effects variable EMRG is the rate of inpatient admissions from the emergency services. This variable represents the effect of demand uncertainty on the technical efficiency scores.
DEVINX is a socio – economic development index of the provinces that hospitals are located, calculated in the study of Ministry of Development (MoD) (2013). DISC is the distance of the hospital to the province center measured in kilometers (km.). The last three inefficiency effects variables define the demographic characteristics of the hospital location. The variables POP1, POP2 and POP3 are defined respectively as the ratio of 0-15 aged population, +65 years old population and 13-49 years old woman population in the total population of the hospitals’ service area (i.e. town, city).
Table 1. Variable Definitions and Summary Statistics
Variable Definition Mean S.D. Min. Max.
Outputs
DISCH* Total number of discharges. 51.93 66.08 0.25 366.12
PATDAY* Total number of patient days. 12.69 14.60 0.06 90.41
Inputs
PHSY Total Number of Physicians 78.88 124.31 4.00 872.00
ANCI Total Number of Ancillary Medical Staff 270.45 272.09 36.00 1887.00 ADTECH
The total number of other employees (Administrative and technical staff, including the contracting out personnel )
278.88 304.28 18.00 1610.00
BED Total Number of Beds 201.74 224.30 25.00 1414.00
Control Variables
SPEC The ratio of specialists in total number of
physicians 0.76 0.15 0.20 0.99
TECH Technology index of the hospital 1.25 1.11 0.00 5.00
Inefficiency Effects
TEACH Dummy variable for teaching hospitals 0.10 0.30 0.00 1.00
ROLE Role Index of Hospital (1-5) 2.67 1.21 1.00 5.00
EMRG The rate of inpatient admissions from
emergency services 0.23 0.30 0.00 5.34
DEVINX Development index value of hospital location
(Province) 0.59 1.49 -1.73 4.52
DIST Distance of hospital to the province center 50.10 45.22 0.00 223.00 POP1
The ratio of 0-15 years old population in the total population of town/city that the hospital located
0.25 0.07 0.09 0.52
POP2
The ratio of +65 years old population in the total population of town/city that the hospital located
0.09 0.04 0.02 0.21
POP3
The ratio of 15-49 years old woman population in the total population of town/city that the hospital is located
0.26 0.03 0.13 0.33
4. Estimation Results
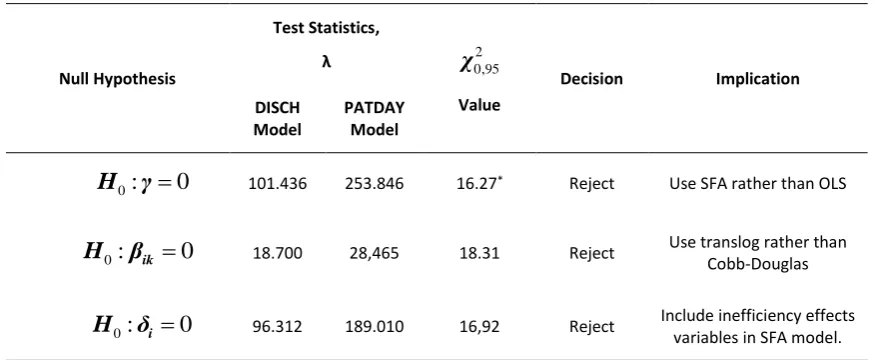
Although SFA production function estimates could be done under many different specifications, these choices are not guided by theory, so the preferred model should be based on the results of a number of restriction tests. The appropriate model is specified with the information gained by generalized likelihood statistic,
λ
. This is defined byλ
2 [ln L H
0
ln L H ]
1 , whereL H
0 andL H
1 are the values of the likelihood function under the two hypotheses, restricted and unrestricted versions of the models respectively. The results of the tests are presented in Table 2. According to the results, the appropriate SFA models are found to have translog production technology with the inefficiency effect variables.Table 2. Hypothesis Tests
Null Hypothesis
Test Statistics,
λ
χ
0,952Value
Decision Implication
DISCH Model
PATDAY Model
0: 0
H γ 101.436 253.846 16.27* Reject Use SFA rather than OLS
0: ik 0
H β 18.700 28,465 18.31 Reject Use translog rather than
Cobb-Douglas
0: i 0
H δ 96.312 189.010 16,92 Reject Include inefficiency effects variables in SFA model.
*Test statistic has a mixed Χ2 distribution (for details see Kodde & Palm (1986)
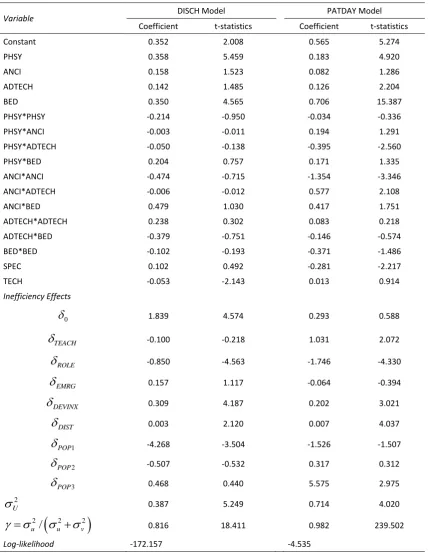
In the models, all the production function variables are expressed in deviations from their sample means for ease of simplicity. This is simply a change in the units of measurement and does not change the underlying data; however, it has the advantage that the estimated first-order parameters in the translog function can now be directly interpreted as estimates of the production elasticities, evaluated at the sample means (Coelli, Estache, Perelman, & Trujillo, 2003). The maximum-likelihood estimates of the translog production function given in the Equation (2) with the specifications for the inefficiency-effects are presented in Table (3).
In Table (3), the results are presented by two models: one (i.e., DISCH model) in which the total number of discharges is used as an output variable; and other in which the total number of patient days is used as an output variable (PATDAY model). All the coefficients of input variables are found to be positive in both of the models. According to the first order parameter estimates, for both models, the production function exhibits increasing returns to scale as the scale elasticities are eDISCH 1.008 1 and ePATDAY 1.097 1
respectively for the DISCH and PATDAY models. In the DISCH model, while the coefficients of PHYS and BED are statistically significant(p0.05), neither of the coefficients of ANCI and ADTECH is. In the PATDAY model, all the first order parameters, except ANCI, are statistically significant(p0.05). These results suggest that the most important inputs for the production of inpatient care are physicians and beds in the hospitals.
is negative and significant in both models, implying that the rise in the hospitals’ role group increases the efficiency scores. On the other hand, DIST rises inefficiency in both models, but the effects are so small.
In the DISCH model, the coefficient of POP1 found to be negative and statistically significant
(p0.05). This result implies that the hospital location with a demographic characteristics that has bigger child population ratio, contributes to hospitals’ inpatient care technical efficiency scores. The coefficients of TEACH and POP3 are positive and significant in PATDAY model. This indicates that teaching hospitals and the hospitals that serve for a more old aged demographic area are more inefficient than the others.
Table 3. Parameter Estimates of The Frontier Production Functions
Variable DISCH Model PATDAY Model
Coefficient t-statistics Coefficient t-statistics
Constant 0.352 2.008 0.565 5.274
PHSY 0.358 5.459 0.183 4.920
ANCI 0.158 1.523 0.082 1.286
ADTECH 0.142 1.485 0.126 2.204
BED 0.350 4.565 0.706 15.387
PHSY*PHSY -0.214 -0.950 -0.034 -0.336
PHSY*ANCI -0.003 -0.011 0.194 1.291
PHSY*ADTECH -0.050 -0.138 -0.395 -2.560
PHSY*BED 0.204 0.757 0.171 1.335
ANCI*ANCI -0.474 -0.715 -1.354 -3.346
ANCI*ADTECH -0.006 -0.012 0.577 2.108
ANCI*BED 0.479 1.030 0.417 1.751
ADTECH*ADTECH 0.238 0.302 0.083 0.218
ADTECH*BED -0.379 -0.751 -0.146 -0.574
BED*BED -0.102 -0.193 -0.371 -1.486
SPEC 0.102 0.492 -0.281 -2.217
TECH -0.053 -2.143 0.013 0.914
Inefficiency Effects
0
1.839 4.574 0.293 0.588TEACH
-0.100 -0.218 1.031 2.072ROLE
-0.850 -4.563 -1.746 -4.330EMRG
0.157 1.117 -0.064 -0.394DEVINX
0.309 4.187 0.202 3.021DIST
0.003 2.120 0.007 4.0371
POP
-4.268 -3.504 -1.526 -1.5072
POP
-0.507 -0.532 0.317 0.3123
POP
0.468 0.440 5.575 2.9752
U
0.387 5.249 0.714 4.020
2 2 2
/
u u v
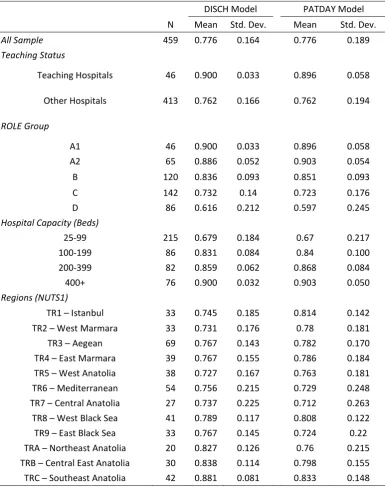
0.816 18.411 0.982 239.502The mean efficiency scores estimated in SFA analysis is presented in Table (4). For the all hospitals in the sample, the mean efficiency score is found 0.776 in both models. When the distribution of the efficiency scores analyzed, the efficiency scores obtained from DISCH model and PATDAY model are found to be highly correlated as the Pearson correlation is found 0.773 (p0.01)and Spearman's rho is 0.705(p0.01).
Regarding the total number of beds as an indicator of hospital size, the hospital mean efficiency scores increase with an enlargement in the hospital size. Similarly, the mean efficiency increases in the upper role group hospitals in general. The only exception of this statement is the decrease of the mean efficiency of A1 group hospitals in the PATDAY model, which is relatively small and negligible. These results are consistent with the findings about scale elasticity and returns to scale in the inpatient care production functions. On the other hand, the estimates of the inefficiency effects variable ROLE’s coefficient contributes to this statement.
Table 4. Distribution of Efficiency Scores by Selected Hospital Characteristics (Mean)
DISCH Model PATDAY Model N Mean Std. Dev. Mean Std. Dev.
All Sample 459 0.776 0.164 0.776 0.189
Teaching Status
Teaching Hospitals 46 0.900 0.033 0.896 0.058 Other Hospitals 413 0.762 0.166 0.762 0.194 ROLE Group
A1 46 0.900 0.033 0.896 0.058
A2 65 0.886 0.052 0.903 0.054
B 120 0.836 0.093 0.851 0.093
C 142 0.732 0.14 0.723 0.176
D 86 0.616 0.212 0.597 0.245
Hospital Capacity (Beds)
25-99 215 0.679 0.184 0.67 0.217
100-199 86 0.831 0.084 0.84 0.100
200-399 82 0.859 0.062 0.868 0.084
400+ 76 0.900 0.032 0.903 0.050
Regions (NUTS1)
TR1 – Istanbul 33 0.745 0.185 0.814 0.142 TR2 – West Marmara 33 0.731 0.176 0.78 0.181
TR3 – Aegean 69 0.767 0.143 0.782 0.170
The mean efficiency score of the teaching hospitals is intensively high when compared to the other hospitals. The difference between these groups stems from the low efficiency scores taken by the small sized hospitals that are mainly classified in C and D Role groups. When we compare of A1 (group of teaching hospitals) and A2 role groups, the gap of the mean efficiency scores is very slight, even A2 hospitals are more efficient in the PATDAY model. The parameter estimate of TEACH in PATDAY model is consistent with this result.
The regional distribution of the mean efficiency scores across Turkey’s NUTS I (Classification of Statistical Region Units Level 1) regions offers an interesting picture. The mean efficiency scores decreases in the western part of the country which has the regions that are socio-economically more developed and more populated compared to the others. The maximum mean efficiencies are reached in the Northeast, Central East and Southeast regions which are socio-economically less developed ones. These findings are parallel with the statements of the DEVINX coefficient.
5. Conclusion and Discussion
The SFA technical efficiency analysis has to be carried out with a production function defined in the model specification. In the basic model, the productions functions, regardless of the technology definition (i.e. Cobb – Douglas, Translog etc.), does not allow to use multiple outputs in the estimation. This is the main disadvantage of using SFA in technical efficiency analysis when compared to DEA. Although there are several methods to overcome such a defect, these are not used due to the data constraints and/or purpose of the study. There are several ways to deal with multiple input – output production technologies in SFA technical efficiency studies. While creating an output index build with different inpatient and outpatient output variables is a way to, this method could not be used in the study as this method requires information about the weights of outputs, which is not predictable for the present. The other way is using “distance functions” for SFA technical efficiency estimation, which would mean a total change in the estimation process or in the analytical framework of this study which in we also try to interpret the MoH’s hospital performance assessment methodology. For this reason, keeping in mind that the hospitals are the production units that have a multi input-output production technologies, single outputs are used in the estimation with an assumption that inpatient and outpatient case-mix properties of an individual hospital are the same.
The results of this study suggest that the technical inefficiency of the inpatient care services of Turkish public hospitals is closely related with the hospital size. As hospital capacity decreases or/and the role group of the hospital lowers down, the hospital efficiency reduces significantly. The main reasonable explanation for this result is the economics of scale and the increasing returns to scale existing in the inpatient care production functions that have been put forward by the estimations. The other reason may be the patient behaviors that affect the demand of the inpatient care services and the hospital choice. In Turkey, as referral chain is not applied, the patients choose the hospital by themselves with respect to their personal set of information, i.e. their experiences and hearsay knowledge. The bigger hospitals, especially the teaching hospitals, are believed to serve a better quality for health treatments. For this reason, the patients prefer to get the inpatient treatment in bigger hospitals that have much technological endowments, regardless of medical requirements or necessities. Thus, even if the patient could be treated properly in a small hospital, he/she does not prefer to utilize that hospital. Therefore, it can be argued that the overutilization of the big hospitals and the insufficient use of small hospitals could be the other reasons of the variations in the efficiency scores across different hospital sizes and groups.
located in these regions might be found inefficient than the others. Unfortunately, the data used in the analysis could not be adjusted in terms of case-mix, case-severity and quality due to lack of data for DRG weights of hospital. Even if using the case mix index offered by Roemer et al (1968), which multiplies average length of stay (ALS) by its occupancy rate and divides this by the average occupancy of all the samples, was a way to adjust the output data, we have not used that method as the outputs variables DISCH and OUTPAT thought to give an approximate information of Roomer index when analyzed together.
End Notes
1 See OECD (2009) and Akdağ (2009) for details of HTP reforms implemented in the Turkish health system.
2 For a detailed literature survey see Hollingsworth (2003), Worthington (2004) and Rosko & Mutter (2008).
3 The MoH Hospital Role Classification can be summarized as following; A1: research hospitals, A2: General hospitals
located at the central city of the province that have level III emergency and intensive care units; B: hospitals located in city and some of pre-determined town centers that have level II emergency and intensive care units; C: Hospitals located in town centers that have level I emergency and intensive care units; D: Hospitals located in town centers which are not classified in the upper level role classes; E: Hospitals having less than 25 beds.
References
Aigner, D., Lovell, C. A. K., & Schmidt, P. (1977). Formulation and estimation of stochastic frontier production function models. Journal of Econometrics, 6, 21-37. doi: 10.1016/0304-4076(77)90052-5
Akdağ R. (2009). Health transformation program in Turkey progress report. Ministry of Health Ankara, Turkey.
Atilgan, E. (2015). The Technical Efficiency Of Outpatient Services In Turkish Public Hospitals: A Stochastic Frontier Estimation. Paper presented at the International Healthcare Management Conference (IHMC), Gumushane, Turkey.
Atılgan, E. (2016). An assessment for Public Hospitals Associations' performance measurement approach – “Kamu Hastaneleri Birlikleri performans ölçüm yöntemi üzerine bir değerlendirme”, International Journal of Human Sciences, 13(1), 695-712.
Atilgan, E., & Çalişkan, Z. (2015). The Cost Efficiency of Turkish Hospitals: A Stochastic Frontier Analysis. Iktisat Isletme ve Finans, 30(355), 09-30.
Battese, G. E., & Coelli, T. J. (1995). A model for technical inefficiency effects in a stochastic frontier production function for panel data. Empirical Economics, 20, 325-332. doi: 10.1007/BF01205442
Bosmans N. & Fecher, F. (1995). Performance of Belgian hospitals: A frontier approach. Health Economics, 4, 389–397. Coelli, T. J., Estache, A., Perelman, S., & Trujillo, L. (2003). A primer on efficiency measurement for utilities and transport
regulators: WBI Development Studies.
Coelli, T. J., Rao, D. S. P., O'Donnell, C. J., & Battese, G. E. (2005). An introduction to efficiency and productivity analysis, New York: Springer.
Daidone, S., & D’Amico, F. (2009). Technical efficiency, specialization and ownership form: evidences from a pooling of Italian hospitals. Journal of productivity Analysis, 32(3), 203-216.
Davutyan, N., Bilsel, M., & Tarcan, M. (2014). Migration, Risk-Adjusted Mortality, Varieties of Congestion and Patient Satisfaction in Turkish Provincial General Hospitals, Data Envelopment Analysis Journal, 2014, 1: 135–169 . Dismuke, C. E. & Sena, V. (2001). Has DRG payment system influenced the technical efficiency and productivity of
diagnostic technologies in portuguese public hospitals? An empirical analysis using parametric and non-parametric methods. Health Care Management Science, 2, 107–116.
Ersoy K., Kavuncubaşı S., Özcan Y.A.,& Harris J. M. (1997). Technical Efficiencies of Turkish Hospitals: DEA Approach. Journal of Medical Systems, 21(2), 67–74.
Gok, M. S., & Altındağ, E. (2015). Analysis of the cost and efficiency relationship: experience in the Turkish pay for performance system. The European Journal of Health Economics, 16(5), 459-469.
Greene, W. H. (1980a). Maximum likelihood estimation of econometric frontier functions. Journal of Econometrics, 13(1), 27-56.
Greene, W. H. (1980b). On the estimation of a flexible frontier production model. Journal of Econometrics, 13(1), 101-115.
Hollingsworth, B. (2003). Non-parametric and parametric applications measuring efficiency in health care. Health Care Management Science, 6 (November), 203-218.
Kavuncubaşı, S. (1995). Hastanelerde Göreli Verimlilik Ölçümü: Veri Çevreleme Analizinin Uygulanması. Hacettepe Üniversitesi Sağlık Bilimleri Enstitüsü Doktora Tezi. Ankara.
Kodde, D., & Palm, F. (1986). Wald criteria for jointly testing equality and inequality restrictions. Econometrica: journal of the Econometric Society, 54, 1243-1248.
Kumbhakar, S., & Lovell, C. (2000). Stochastic Frontier Analysis. Cambridge: Cambridge University Press.
Li, T., & Rosenman, R. (2001). Cost inefficiency in Washington hospitals: a stochastic frontier approach using panel data. Health care management science, 4(2), 73-81.
Linna M. & Hakkinen, U. (1998). A comparative application of econometric frontier and DEA methods for assessing cost efficiency of Finnish hospital., P. Zweifel(ed.), Health, the Medical Profession and Regulation, Boston: Kluwer. Linna, M. (1998). Measuring hospital cost efficiency with panel data models. Health Economics, 7 (5), 415-427.
Meeusen, W., & Broeck, J. V. d. (1977). Efficiency estimation from Cobb-Douglas production functions with composed error. International economic review, 18, 435-444. doi: 10.2307/2525757
Ministry of Development (2013). İllerin ve Bölgelerin Sosyo-Ekonomik Gelişmişlik Sıralaması Araştırması (SEGE-2011). Ankara.
OECD (2009). Reviews of Health Systems Turkey. OECD and the International Bank for Reconstruction and Development/The World Bank.
Paul, C.J.M. (2002). Productive structure and efficiency of public hospitals. K.J. Fox (ed.), Efficiency in the Public Sector, Boston:Kluwer.
Roemer, M. I., Moustafa, A. T., & Hopkins, C. E. (1968). A proposed hospital quality index: hospital death rates adjusted for case severity. Health Services Research, 3(2), 96.
Rosko, M. (2001). Cost efficiency of US hospitals: a stochastic frontier approach. Health Economics, 551, 539 - 551. doi: 10.1002/hec.607
Rosko, M., & Mutter, R. (2008). Stochastic Frontier Analysis of Hospital Inefficiency A Review of Empirical Issues and an Assessment of Robustness. Medical Care Research and Review, 65, 131-166.
Şahin, İ. (1999). Sağlık Kurumlarında Göreceli Verimlilik Ölçümü: Sağlık Bakanlığı Hastanelerinin İllere Göre Karşılaştırmalı Verimlilik Analizi., Amme İdaresi Dergisi, 32(2), 124 – 146.
Sahin, I. (2009). Sağlık Bakanlığı'na devredilen SSK hastanelerinin teknik etkinliği ve toplam faktör verimliliği analizi. Iktisat Isletme ve Finans, 24(283), 9-40.
Sahin, I., & Ozcan, Y. A. (2000). Public sector hospital efficiency for provincial markets in Turkey. Journal of Medical Systems, 24(6), 307-320.
Şahin, İ., Özcan Y.A., & Özgen, H. (2011). Assesment of Hospital Efficiency Under Health Transformation Program in Turkey, Central European Journal of Operations Research, 19(1), s.19-37, DOI: 10.1007/s10100-009-0121-3. Stevenson, R. E. (1980). Likelihood functions for generalized stochastic frontier estimation. Journal of Econometrics,
13(1), 57-66.
Sulku, S. N. (2012). The health sector reforms and the efficiency of public hospitals in Turkey: provincial markets. The European Journal of Public Health, 22(5), 634-638.
Temur, Y. (2010). İllerin Gelişmişlik Derecelerine Göre Hastanelerin Etkinlik Analizi. Uludağ Üniversitesi İktisadi ve İdari Bilimler Fakültesi Dergisi, Cilt XXIX, Sayı 2, 1-22
Wagstaff, A. (1989). Estimating efficiency in the hospital sector: A comparison of three statistical cost frontier models, Applied Economics, 21, 659-672.
Worthington, A. (2004). Frontier efficiency measurement in health care: A review of empirical techniques and selected applications. Medical Care Research and Review, 61, 135-170.