International Journal of Finance and Managerial Accounting, Vol.1, No.2, Summer 2016
61
With Cooperation of Islamic Azad University – UAE Branch
Relationship between quality of earning and
abnormal stock return of companies accepted in
Mumbai Stock Exchange
Akbar Rahimipoor
Young researchers and elite club, sirjan branch, Islamic azad university, sirjan,iran
Corresponding Author
akbarrazraz83@yahoo.com
Mehrnoosh Ebrahimi
Master's graduates and member of young researchers and elites of Islamic Azad
University, Eslamshahr Branch
ABSTRACT
In this research, role of accruals in elaboration of quality of earning of the companies accepted in Mumbai Stock Exchange has been studied and relationship between quality of earning through accruals and its constituents and abnormal stock return has been studied. The studied sample includes 35 companies in group A of Mumbai Stock Exchange in 2009-2013.For data analysis and hypothesis testing multiple linear regression model based on panel data has been used with Estimated Generalized Least Square (EGLS) with eviews and stata software and results of the research indicate that there is direct and significant relationship between accruals and abnormal stock return. There is also direct and significant relationship between discretionary accruals and abnormal stock return and non- discretionary accruals and abnormal stock return.
Keywords:
1. Introduction
Accounting is an information system and is considered in economic enterprises as effective tools in process of preparation and provision of financial information to make conscious decisions by the users. Major information part which is required in economic enterprises for decision making by the managers is accounting information. Most of this information is reflected in financial reports. On the one hand, it has been recognized as gravity center of financial reports and essential financial statements. Therefore, one of the important goals of essential financial statements is to provide reliable, transparent, comparable, timely and comprehensible information for making optimal decisions by persons and stakeholders.
Manager of institutes should prepare financial statements. One of the essential financial statements which is highly important for evaluation of managers’ accounting and making economic decisions is loss and profit report. This report reflects performance of economic enterprise in a financial period. In addition, this report along with balance sheet, manner and extent of using resources by managers under control of the manager and return resulting from use of resources. For different reasons, managers of commercial units try to tamper with financial period earning by applying different accounting methods to provide the desired condition from performance of the economic enterprise. In other words, some agents stimulate management of commercial unit in coping with issues to manage earning. Managers of these units try to achieve their goals by altering earning.
Earning can be applied not only for telling truth but for deception. Regarding earning quality, many writings have helped explain relation of managers, stockholders, financial suppliers in improvement of figures and quality of accounting reports. Accounting earning is one of the main criteria for economic decision making but the presence of estimations and different methods in accounting alters validity and reliability of earning.
One of the important users of accounting information to be used for decision making is investors and it can be mentioned that main goal of each investment is to gain benefit and benefit means stock return. Therefore, considering the above materials, it can be concluded that prediction of return is highly important and one of the cases of return prediction is
considered by financial analysts is accounting earnings and quality of the reported earnings.
2. Literature Review
The earning reported by companies is regarded as important information which is used by different users such as securities analysts, managers of companies and investors and quality of the reported earning is one of the components which has been considered in different researches. One of the effective factors in study of earning quality is closeness of earning to liquidity of company and accruals volume is used to measure it. Main goal of this research is to study relationship between earning quality and abnormal return of companies in capital market of India.
Main questions of this research are as follows: Is abnormal stock return affected by quality of earning of companies?
Are factors and components of earning quality effective on abnormal stock return of companies?
To find answer of the raised questions, relationship between earning quality and abnormal stock return is studied because information content of earning is measured by studying market reaction to forms of change in volume of transactions and change in share price and stock return.
It is worth noting that the criterion for earning quality is traced in accruals and accruals have been mentioned and used in many researches as symbol of earning quality. For this reason, accruals and their smaller parts i.e. discretionary and non-discretionary parts of accruals and separate study of their relationship with abnormal stock return are considered.
It is important to study earning quality in India considering three main reasons. Firstly, this study has been conducted in newly emerging market particularly India where few studies of this type have been conducted. Secondly, foreign direct investment has increased considerably in India while its earning quality should be improved so that it is inevitable to correct resources allocation. Thirdly, lack of an accepted definition of earning quality creates doubts in capability of earning quality indices for measuring persistence of earning quality of companies.
Definition of earning quality: Primary goal of the profit report is to provide useful information for those who are highly interested in financial reports but accounting profit always cannot be a good criterion for decisions of investors and is sometimes altered by manager, therefore, concept of earning quality was raised to help investors make correct decisions.
There are different definitions for earning quality and there is no consensus on it. One of the potential reasons for diversity in definitions of earning quality can be different attitudes of researchers to different aspects of this concept (2006،Hermans).
Some of the most important definitions are:
Hunt, financial manager of General Miller Company believes that two cases are evaluated in assessment of earning quality: proportion between the current corporate earning and the past earnings and market’s perception of earning quality of the company which is manifested in P/E ratio.
Haegen, financial manager of Reynolds Company believes that earning quality can be measured by identifying or removing effects of change in accounting methods, accruals or provisional costs.
Conolly, another financial analyst believes that earning quality can be assessed by measuring net realizable value of assets. Wallon, financial manager of American Casting Company believes that earning quality can be measured by differentiating between inflation earning and reported earning.
Earning quality is defined by Benish and Wargas (2002) as persistence of the current earnings in future. According to Richardson et al. (2001), earning quality is the extent to which performance of earnings is stable in the future period. Penman and Jang (2002) define earning quality as ability of earning to show the future earnings.
Lougee & Marquardt (2004) define high quality earning as the earning which is closer to corporate value in long term and has more information content. Bellovary et al. (2007) define earning quality as symbol of ability of the reported earnings to reflect actual earning of commercial unit, ability to predict future earning and persistence and non-variability of the reported earnings. Lee (2008) believes that high earning is the earning for which accounting methods and estimations are impartial.
Hawkins, accounting professor of Harvard University believes that quality of earning per share is
affected by six factors such as economic environment (such as inflation rate and change in exchange rate), extraordinary events (such as sale of administrative buildings), ordinary and repeatable activities, capital structure (financial leverage), tax methods, accounting methods and relationship between them and change of earning per share (Esmaeil Zadeh et al., 2014).
The concept of efficiency: Rate of return on an investment, a concept that has a different meaning from the standpoint of investors, some firms are seeking to return cash and short-term yields are lower value.
Such companies may have large stocks of companies that pay cash dividends, buy. Some investors primarily to the development of care.
Such investors invest in the companies with very high stock return or equity. Some other investors firstly regard growth and development as important. Such investors invest in the companies whose stock return or equity is very high. Francis believes that investment is a type of money transfer which is expected to have additional money. Any investment includes a degree of risk which requires losing that money at present for gaining the future benefits. Markowitz believes that suitable definition of return may be different from an investor to another investor but the investors prefer the highest return in any sense. In simple sense, return means total earning which an investment shows and is shown as a percent of primary investment. Return or reward of investment includes current income (annual earning) and increase or decrease of assets’ value (capital benefit or loss), therefore, return rate shows total annual income and capital benefit is expressed in terms of a percent of investment price (DehBozorgi, 2007).
Abnormal stock return:Abnormal stock return or excess return indicates difference between actual stock return of company and expected return of the shareholders. Expected return of the shareholders means the return rate which should be acquired for protecting market value of company or its share price and company gains this return from investment to fulfill expectations of the investors who have provided long-term funds of company.
this trend, lack of quality of financial information published by companies can affect decision of investor and when it is recognized by market, it leads to loss for investors. Ajit et al. (2013) contribute to the existing papers by studying and determining quality of EMin India by studying a group of 2229 Indian registered companies (nonfinancial) in 2008 to 2011. This study shows that average earning management in corporate(nonfinancial ) section in India is 2.9% of total assets of these companies which is comparable with estimates of USA, Europe and other parts of the world (about 1 to 5% of total asset). This study shows that small enterprises in India extravagate in earning management compared with the medium and small enterprises (10.6% of total asset). Classification in terms of industry shows that companies in business line i.e. construction, extraction etc. are involved in relatively high level of earning management. Another finding of this study shows that discretionary accruals have reverse relationship with leverage of companies. In addition, this study didn’t find any statistically significant relationship between EM and performance of companies.
From the viewpoint of supervisors, these findings may be useful because they provide additional instruments for ensuring that financial reporting matches with actual economic value of companies. More improvement of quality of accounting and financial information can reduce dissymmetry of information in capital market and protect the investors who are finally capital loaners for these companies. Efficiency and consistency of capital market and financial system is a general instrument which each supervisor seeks to maximize. An incremental earning management level in a company or enterprise (above average threshold of enterprise) may provide very desirable red signal for supervisors to increase control on the company or enterprise such that comprehensiveness and consistency of the financial system are not endangered.
Policy implication of this study is need for better and timely disclosure of financial information. Auditors can play an important role in supervision and disclosure of financial reporting of the companies so that power of management is minimized according to Indian GAAP. Movement to IFRS designed in corporate industries of India may reduce powers of management in financial reporting. Considering international evidence that efficient board of directors
and auditing committee can reduce earning management level in companies. Effectiveness of board of directors and auditing committee may require more attention of supervisors.
India is one of the rapidly goring economies of the world. The number of companies registered in Mumbai Stock Exchange has increased from 4344 companies in 1985 to 5133 companies in late March 2012. Current value of these companies was about 74% of the Gross Domestic Product (GDP) of India in late March 2012(SEBI, 2012). Study of EM among companies can be considerable in section of Indian private companies and also in companies and enterprises which EM prevailed. This case provides valuable insight for the supervisors such as Securities Exchange Board of India (SEBI) about competency or necessary changes in regulations so that investors (particularly inexperienced investors) can have the best possible result from the financial statements.
Jink (2007) studied relationship between earning quality measurement with seven features including quality of accruals, continuity, predictability, flexibility, value relevance, timeliness and conservatism, synchronization and symmetry and stock return. He also studies relationship between earning quality and symmetry of the stock return which is stronger or weaker. Results indicate that quality of higher (lower) earnings has relationship with lower (higher) stock return. This evidence indicates that earning quality is highly important in processing of registration information of company.
Chan et al.(2006) studied relationship between earning quality and stock return. They defined accrual as difference between accosting earning and cash flow and studied predictability of accruals from stock return. They also studied if future stock return reflected information about quality of current earnings which have been replaced with accruals. When earning increase is accompanied by increase of accruals, it is assumed that earning has low quality and relationship between accruals and earning should be negative.
mentioned that insignificant relationship between accruals and stock return may be due to the fact that high accruals indicate interference of managers in earning. This interference reduces earning quality and leads to negative relationship between stock return and accruals.
Chan et al.(2009) conducted a study for analysis of relationship between return and earning quality for 13 countries. Their findings show that earning quality is not equal and varies from a country to another country. Their findings also show that countries which have high support investor have high level of earning quality compared with the countries which have lower support of investor.
Perotti, & Wagenhofer(2011) studied earning quality measures and excess returns. This paper studies relative ability of 8 earning quality measures for explaining the future excess return. They ranked these measures based on size of return resulting from stock portfolio constructed by classification of all related measures. Their findings with a large sample of American nonfinancial companies in 1988 to 2000 show that market-based measures (earning response coefficient. value relevance) are related to coverage return compared with accounting –based measures where quality of accruals and abnormal accruals is much better than that of follow-up, predictability and smoothing. These results are not explained based on effects of capital cost or fully documented pricing abnormalities. Results also show that accruals with high abnormality and smoothing may show high earning quality instead of low earning quality.
Saghafi and Kordestani (2004) studied and explained relationship between earning quality and reaction of market to changes of cash earning. Main goal of this research is to study and explain relationship between earning quality and abnormal accumulated stock return in companies with increase or decrease of cash earning. In this research, earning quality based on persistence of earning, earning predictability and relationship between earning and operating cash flows have been measured and on this basis, there are three definitions of earning quality as follows:
First definition of earning quality is based on relationship between operating cash flow and earning or earning components.
Second definition is based on earning predictability.
Third definition has based on persistence of reported earnings which means repeatability of current earning.
As a result, the reported earning in financial statements of the companies accepted in stock exchange has information content.
Ghaemi et al. (2008) studied relationship between earning quality through accruals and its discretionary components and normal and abnormal stock return. The studied sample includes 136 companies in 1998 to 2005. Accruals have been divided into discretionary and non discretionary components. Results showed that stock return of companies is affected by accruals and its related components. In other words, there is significant relationship between returns of the companies whose accruals are reported to be minimum and maximum.
Limo (2014) studied relationship between quality of accruals and information content of share price in Mumbai Stock Exchange. This study used the second-hand information collected from prowess database like the previous studies by Ansari and Khan 2012 and Doll et al. 2012. This study used a sample of 91 companies registered in BSE 100 in 2007 to 2011. We used Brush-Pegan lagragne multiplier to select panel regression model and also omit outlier points with decile ranking of accruals quality like the previous studies (Johnstone , 2009 and Jing 2007). We applied random effect of panel regression model for studying relationship between quality of accruals and information content of share price. Results show that quality of accruals has positive relationship with information content of share price. The existing findings are similar to findings and results of Jing (2007) and Johnstone (2009) who found significant positive relationship between quality of accruals and information content of the share price in USA. Results confirm that accruals are important in special information registration process of company.
five usual measures of earning quality continuity, predictability, smoothing, wonderful financial reports and accruals quality can be used (Penman and Jang ,2002; Francis et al., 2004; Abdolghani 2005, Dechow et al., 2010) generally found that there was no full consistency among measures of the earning quality. Evidence of this study shows that analysts, investors and actors of market should not use a measure of earning quality because a measure of earning quality cannot complement other measures of earning quality . On the contrary, when more than one measure of earning quality is used, more analysis is inevitable.
3. Methodology
Spatial domain of the research includes all companies accepted in Mumbai Stock Exchange. Time domain of this research is a 5-year period from 2009 to 2013 for the companies accepted in Mumbai Stock Exchange. Information of the past three periods of the base year is required to calculate discretionary and non discretionary accruals according to the provided model. This research seeks to study relationship between earning quality and abnormal stock return of the companies accepted in Mumbai Stock Exchange.
The selected sample of this research includes the companies accepted in group A of Mumbai Stock Exchange which are selected as the sample after the following limitations:
1) It includes cement, pharmaceutical, chemical, oil, automotive industries and basic metals. 2) It should not be part of investment companies,
banks and financial mediator.
3) They should be present in Mumbai Stock Exchange between 2009 and 2013.
4) Due to comparable increase, their financial period ends to March for Indian companies and its financial year has not changed in 2009 to 2013.
5) Company has continual activity between 2009 and 2013.
6) Company is profitable between 2009 and 2013. To determine the sample size, systematic review method is used. It means that all companies of group A of Mumbai Stock Exchange have been specified in industries of chemicals and pharmaceutics, automobile and construction of parts, oil products, cement and base metals and then the above limitations are applied
on them. The remaining companies (35 companies) are used as sample.
In this research, accruals have been considered as important index for evaluation of earning quality in determination of share value. These accruals which are difference between accounting earning and cash flows affect earning quality due to the presence of principles of realization and matching, trading schedule and selection of accounting procedures . Earning quality can be defined as closeness of company’s earning to cash flows; therefore, the main hypothesis is as follows:
Main hypothesis: there is significant relationship between accruals and abnormal stock return of the companies accepted in Mumbai Stock Exchange.
Accruals are divided into discretionary accruals and non discretionary accruals and their effect has been separately tested with abnormal stock return. This research has two subsidiary hypotheses:
First subsidiary hypotheses: there is significant relationship between discretionary accruals and abnormal stock return of the companies accepted in Mumbai Stock Exchange.
Second subsidiary hypotheses: there is
significant relationship between non discretionary accruals and abnormal stock return of the companies accepted in Mumbai Stock Exchange.
Data of this research was analyzed and its hypotheses were tested with Excel, Eviews and stata software. In this regard, the information provided by database has been first classified and sorted in Excel software and then transferred into Eviews and stata software to conduct statistical tests on them. In this research, to test hypotheses, multiple linear regression model based on panel data has been used with Estimated Generalized Least Square (EGLS) and t, F statistics and coefficient of determination (R2) are used to study total validity of regression and justifying power. We describe these methods and their characteristics in detail:
Operational definition of the research variables and their measurement
Each of the variables has been presented by separating and classifying their type with their measurement method:
Dependent variable is the variable which is affected by independent variable. Considering the above definition and review of literature, the dependent variable in this research is abnormal stock return of company which is defined and measured as follows:
Normal stock return:
Return means total ratio of earning (loss) obtained from investment in a definite period to the capital which has been spent to gain this earning at the
beginning of the spending period. Stock return is one of the important criteria for evaluation of companies’ performance which is considered by investors. Return on investment indicates benefits obtained from investment and investors seek to find investment opportunities which increase their capital return. In this research, the following action is performed to measure normal stock return(Ghaemi et al., 2008).
To calculate each of the items, we have:
( ) ( ) ( )
Approved dividend=cash dividend×
Capital increase percent from cash contribution and credits ×(first of period capital-end of period capital)= Capital increase from cash contribution and credits
Cash dividend: this dividend means cash dividend approved in general assembly of shareholders of the companies accepted in Mumbai Stock Exchange. Capital increase: company with capital increase is the company which has increased capital in 2009-2013. Capital increase from cash contribution and credits has been considered in calculation of stock return.
Abnormal stock return:
To calculate this variable, companies of each period are independently classified into 5 classes based on natural logarithm of assets at the end of the financial year (corporate size) and price-to-book ratio. Result of difference of these 10 groups is 25 states. For each group with the obtained portfolio, mean corresponding return was obtained. The reason for this classification is control of effect of systematic risk with corporate size variable because the presence of significant relationship between corporate size and systematic risk has been shown (Namazi and Khajavi, 2004). Anyway, abnormal return is equal to difference
of return of each company and mean portfolio return of the company in that class.
Natural logarithm of assets at the end of the financial year =corporate size
Market value of the company at the end of the period /company’s capital at the end of the period – price-to-book ratio
Research independent variables
Independent variable is a feature of physical or social environment which accepts some values after selection, interference or alteration by the researcher to observe its effect on another variable. Considering the main research question and based on the conducted studies, independent variables of the research and their measurement method are as follows:
Accruals:
difference is result of accounting constraints to see when income and cost should be identified (principle of realization and matching). One of the important roles of accruals, transfer or modification is identification of cash flows over time. so, the modified numbers (earning ) better evaluates performance of company.
Cash flow from operation –operating earning =accruals
This value is in terms of assets of sample companies at the end of the standard financial year.
A- Operating profit: loss or profit from ordinary and continual activities of the commercial unit. This value is also obtained in terms of mean of total assets from division of profit obtained from ordinary and continual activities by assets of the sample companies at the end of financial year. This price is extracted from loss and profit statement provided in financial statements of the companies.
B- Cash flow from operation: it is obtained in terms of mean of assets of company which is obtained by dividing cash flow from continuing operation by assets of the sample companies at the end of the financial year. This value is extracted from cash flow statement. In this definition, payable cash fund for income tax and return on investments and payable profit for financing are not considered (the reason is observance of accounting standards). This price is extracted from cash flow statement provided in financial statements of companies.
Discretionary and non discretionary accruals:
Discretionary and non discretionary accruals mean to what extent the managers have freedom of action in preparing and reporting them. Discretionary accruals are part of the accruals which reflect application of power by manager in economic setting of the company. Non discretionary accruals mean the accruals which cannot be controlled and refer to the accruals which reflect fundamental performance of company.
To calculate discretionary and non discretionary accruals, accruals of every year should be predicted with mean of sale and accruals of the past three years such that:
( ) ∑∑
( ) = prediction of accruals of company i in
period t:
= corporate sales and k is 3-year time period before the desired current year.
To calculate numerator of accruals, we calculate three years before the desired year and put mean of these three numbers in numerator of the fraction. To calculate numerator of the fraction, we consider sales of the past three years. Finally, we multiply the number obtained from the desired fraction by the current year sales and the resulting figure shows prediction of accruals in the current period.
Discretionary accruals:
( )
To calculate the discretionary accruals, we deduce the predicted accruals which were calculated as above from total accruals of the current year.
Nondiscretionary accruals:
( )
= shows the first of period accruals.
To calculate non discretionary accruals, we deduce accruals of the year before the current year from the predicted price of accruals. Due to limitation of the time period, the considered mean for prediction of accruals is three periods and these figures are standardized based on mean of assets of each company in the desired period.
Research control variables:
In a research, effect of all variables on each other cannot be studied concurrently; therefore, the researcher controls effect of some of these variables and neutralizes them which have been selected in this research as follows considering the previous studies:
Corporate size:
the financial year so that the results obtained from the research can be reliable.
Systematic risk:
In this research, companies were classified into 2 independent groups based on natural logarithm of assets at the end of the financial year (corporate size) and price-to-book ratio (B/P) to calculate abnormal stock return and mean of the correspondent return was calculated for each group with the obtained portfolio. The reason for this classification is to control systematic risk with variable of corporate size.
4. Results
To better recognize nature of the population which has been studied in the research and to identify variables of the research, these data should be described before analysis of statistical data. Statistical description of data is a step for recognition of model governing them and a base for explaining relations among the variables which are applied in the research. Table 1 shows information of descriptive statistics of the research variables in the companies accepted in Mumbai Stock Exchange. This Table shows that mean
of normal return of Mumbai companies is 1.14 and abnormal return in Mumbai Stock Exchange is 0.24.
The above Table for Jarque-Bera statistical probability shows that the research variables have significance level of below 0.05% which indicates non-normality of the data of the variables but the data of more than 30 numbers tend to be normal based on central limit theorem.
In this stage, the researcher tests the research hypotheses and analyzes them after determining and calculating independent and dependent variables and describing them through descriptive statistics such as mean, median, mode, standard deviation etc. the research hypotheses are tested as follows.
To test the research hypotheses, panel data regression test will be used. Generally, estimation of the model with panel data includes the following stages:
1) Reliability recognition test on data 2) Model estimation test as panel data
3) Fixed effects or random effects determination test
4) Estimation of parameters
5) Reliability recognition test on data
Table 1- Descriptive statistics of the research variables
Accrual s Discretionary
accruals Nondiscretionary
accruals Abnormal
return Normal
return
Mean 7330
-906 1130
0.241219 1.149282
Mode 3090
36.99 617
-0.126675 0.154945
Maximum number 94800
59200 67500
17.45794 20.23904
Minimum number -25500
-120000 -26400
-4.309117 -0.907925
Standard deviation 14800
15300 8590
2.861063 3.265785
skewness 2.38612
7 -2.828562
2.516209 4.320302
4.659102
Kurtosis
12.0706 3 26.25023
24.53285 24.81660
26.13779
Jarque-Bera statistic 765.995
4 4175.035
3565.543 4014.968
4536.773
Jarque-Bera statistic probability 0.00000
0 0.000000
0.000000 0.000000
0.000000
To study reliability of variables in this research, Dicky Fuller (ADF) test which is one of the most important unit root tests has been used and considering Dicky Fuller statistic probability which is below 5% for all variables, all variables but variables of accruals and discretionary accruals which have statistical
Table 2- Dicky Fuller (ADF) test to study reliability of research variables - Mumbai Stock Exchange
Variable
Statistic Statistic
probability
Accruals 90.2098
0.0524
Discretionary accruals 90.3393
0.0514
Nondiscretionary accruals 335.844
0.0000
Abnormal return 149.236
0.0000
Table 3- Dicky Fuller (ADF) with a referencing stage - Mumbai Stock Exchange
Variable Statistic
Statistic probability
Accruals 417.301
00000
Discretionary accruals 4120025
00000
Model estimation test as panel data and fixed effects or random effects determination test
In panel data, F-Limer test is used to choose among panel data methods and pooled data methods. If probability of F-Limer test is smaller than 5%, panel data will be used; otherwise, pooled data will be used. Considering that P-Value obtained from F-Limer test
in Table 4 is above 5%, null hypothesis is confirmed and the panel data model is confirmed, therefore, there is no need for Hausman test. To estimate this model in all three hypotheses, pooled data method was used.
Studying the absence of autocorrelation in the research models
To discover autocorrelation, one of the existing tests is Wooldridge test. This test has been presented by Wooldridge and its advantage over Durbin Watson test is that other types of autocorrelation are recognized in addition to the first order autocorrelation and when data are pooled, this test can be used. Considering that P-Value inserted in Table 5 is below significance level of 5% in all three hypotheses for Mumbai Stock Exchange, the model in these hypotheses has autocorrelation. To solve this problem, In the final estimation models first order autoregression model (AR(1)) was used.
Table 5- Results of Wooldridge test of the research models -Mumbai Stock Exchange
Table 4- F-Limer test for selection of the variable or fixed intercept model - Mumbai Stock Exchange
Research hypotheses Test type
Statistic rate Statistic
probability Result
Main hypothesis
F-Limertest 0.786841
0.7900 Null hypothesis is confirmed and the panel
data model is not confirmed. 0.6251 30.803916 Chi square tests
First subsidiary hypothesis
F Test 0.797600
0.7760 Null hypothesis is confirmed and the panel
data model is not confirmed. 0.6061 31.189698 Chi square test tests
Second subsidiary hypothesis
F Test 0.831107
0.7303 Null hypothesis is confirmed and the panel
data model is not confirmed. 0.5468 32.385759 Chi square test
Hypotheses Wooldridge Test
Statistic Statistic probability
Result
Main
F=35/971 0/0000
Autocorrelation
First subsidiary
F=29/470 0/0000
Autocorrelation
Second subsidiary
F=30/14 0/0000
Autocorrelation
Studying Heteroskedasticity test in research models Table 6 shows results of heteroskedasticity test for testing the models of hypotheses with Breusch–Pagan test. In case P-Value is below significance level of 5%, null hypothesis of homoscedasticity is not accepted and the model has heteroskedasticity. Considering that P-Value inserted in Table 6 is below significance level
Table 6- Results of heteroskedasticity test of the research models - Mumbai Stock Exchange
Hypotheses Xttest Statistic Statistic probability Result Main 2 =496/26ᵪ 0/000 heteroskedasticity First subsidiary
2 =-466/24ᵪ
0/000 heteroskedasticity
Second subsidiary
2 =358/94ᵪ
0/000 heteroskedasticity
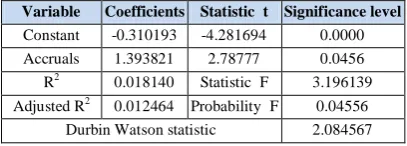
Testing main hypothesis:
Main hypothesis states that there is significant relationship between accruals and abnormal stock return of companies accepted in Mumbai Stock Exchange and this hypothesis is converted into statistical hypotheses i.e.
H0 (accepting the claim) and H1 (rejecting the claim).
Table 7- Results of testing the main hypothesis
Significance level Statistic t
Coefficients Variable 0.0000 -4.281694 -0.310193 Constant 0.0456 2.78777 1.393821 Accruals 3.196139 Statistic F
0.018140 R2
0.04556 Probability F
0.012464 Adjusted R2
2.084567 Durbin Watson statistic
Durbin Watson statistic shows the absence of autocorrelation because value of this statistic is equal to 2.08 which is between 1.5 and 2.5. Therefore, there is no barrier for use of regression. F statistic probability in Table 7 relating to results of testing the research hypothesis shows that there is significant linear relationship between the research variables because probability of 0.04 is below 0.05. T statistic of the variable coefficient of accruals which is below 0.05 indicates significance of the variable coefficient so that there is significant direct relationship between accruals and abnormal return.
Testing first subsidiary hypothesis:
The first subsidiary hypothesis is that there is significant relationship between accruals Discretionary and abnormal stock return in Mumbai Stock Exchange.
Table 8- Results of testing the first subsidiary hypothesis
Significance level Statistic t
Coefficients Variable 0.0003 -3.665808 -0.220620 Constant 0.0052 2.827326 1.860879 Accruals Discretionary 7.993771 Statistic F
0.044166 R2
0.005247 Probability F
0.038641 Adjusted R2
2.097893 Durbin Watson statistic
According to Table 8, for the first subsidiary hypothesis, Durbin Watson statistic shows the absence of autocorrelation because value of this statistic is equal to 2.09 which is between 1.5 and 2.5. Therefore, there is no barrier for use of regression. F statistic probability in Table 8 relating to results of testing the third research hypothesis shows that there is significant linear relationship between the research variables. Variable coefficient of discretionary accruals is equal to 1.86 with significance level of 0.005 which indicates the presence of a positive and significant relationship between discretionary accruals and abnormal return.
Testing the second subsidiary hypothesis:
The second subsidiary hypothesis mentions that there is significant relationship between non discretionary accruals and abnormal stock return in Mumbai Stock Exchange.
Table 9- Results of testing the second subsidiary hypothesis
Significance level Statistic t
Coefficients Variable 0.0000 -4.304838 -0.269608 Constant 0.0165 2.421891 3.309463 discretionary accruals 5.865554 Statistic F
0.032793 R2
0.016473 Probability F
0.027202 Adjusted R2
2.055810 Durbin Watson statistic
variables of the model. Considering that coefficient of non discretionary accruals is equal to 3.30 and significance level of its t statistic is equal to 0.016 and below 0.05, there is direct significant relationship between these two variables.
5. Conclusion and Discussion
Results show that there is direct significant relationship between non discretionary accruals and abnormal return. Results of testing main hypothesis and its hypotheses show that abnormal return has direct significant relationship with accruals and their components in Mumbai Stock Exchange. Results show that accruals and their components have been known for investors in Mumbai Stock Exchange so that it has negative effect on their reaction to report of these accruals.
Result of the present research is in line with results of research by Ghaemi et al.(2008). Results of the research by Chan et al. (2006) which showed that there was negative relationship between accruals and stock return in New York Stock Exchange are in line with results of Indian stock exchange in the present research.
Considering that there is significant direct relationship between discretionary accruals and abnormal stock return in Mumbai Stock Exchange, earning management probability increases and earning quality decreases with increasing discretionary accruals, therefore, abnormal return increases because discretionary accruals can be altered and affected by manager’s decisions. Therefore, the investors are suggested to invest in the companies which have lower discretionary accruals because increase in discretionary accruals increases abnormal return of the company.
Considering that non discretionary accruals have significant and direct relationship with abnormal stock return in Mumbai Stock Exchange, the investors should pay more attention to non discretionary accruals because when non discretionary accruals increase, quality of accruals increases and earning quality increases leading to reduction of abnormal return. In other words, if shareholders seek for more stock return, they should seek for the companies which have higher non discretionary accruals.
Shareholders of Mumbai Stock Exchange are familiar with nature of accruals and show suitable relation, therefore, they should consider companies
with low accruals and higher non discretionary accruals for investment decisions and increase of investment return.
References
1) Saghafi, Ali and Kordestani, Gholamreza(2004). Studying and explaining relationship between earning quality and reaction of market to changes of cash earning. Accounting and auditing studies. No. 37. P.51-72.
2) Khajavi, Shokrollah, Nazemi, Amin(2005). Studying relationship between earning quality and stock return with emphasis on role of accruals in Tehran Stock Exchange. Accounting and auditing studies. No. 40. P.37-60.
3) Deh Bozorgi, Sajad(2007). Studying relationship between earning quality and stock return in the companies accepted in Tehran Stock Exchange . M.A. thesis of Islamic Azad University. Mashhad Branch.
4) Ghaemi ,Mohammad Hossein, Jamal Livani, Ali, Deh Bozorgi, Sajjad(2008). Earning quality and stock return of companies. Accounting and Auditing Studies Journal. No. 2008. P. 71-88. 5) Namazi, Mohammad and Khajavi,
Shokrollah(2004). Usefulness of accounting variables in predicting systematic risk of companies accepted in Tehran Stock Exchange. Accounting and Auditing Studies Journal. No. 38. P. 109.
6) AJIT, SARAT MALIK, VIMAL KUMAR VERMA (2013), “EARNINGS MANAGEMENT IN INDIA “,SEBI DRG STUDY.
7) Bellovary, J., Giacomino, D. and Akers, M. (2006). A review of Bankruptcy Prediction Studies: 1930 to present. Retrieved from: http://www. ebsco.com.
8) Beneish, M. Vargus, M. (2002). "Insider trading, earning quality, and accrual mispricing”, the accounting review, Vol.77, No.4, pp.755-791. 9) Chan, L-C Ann; Lee, Edward; Lin, Stephen
(2009), The impact of accounting information quality on the mispricing of accruals: The case of FRS3 in the UK, Journal of Account. Public Policy 28, 189–206.
11) esmaeilzadeh mqry, ali, ebrahimi, mehrnoosh and mohseni dehkalani, narges (2014) ،“THE IMPACT OF EARNINGS MANAGEMENT ON EARNINGS QUALITY”،Indian Journal of Scientific Research، 4 (6): 846-854,
12) Francis, J., Lafond, R., Olsson, P, and schipper, K. (2005), » The Market pricing of Accruals Quality«, Journal of accounting and Economics, Vol.39, pp.295-327.
13) Hermans, s. (2006). Financial Information and Earning Quality: A literature. Working Paper, Retrieved from: http://www.papers.Ssrn.com/sol3/papers. cfm? abstract_id=8977220.
14) Jing. Z, (2007), “ Earnings quality,analysts, institutional, investors and stock price “, synchronicity, the school of Accounting and finance.
15) Li, K. (2008). Earning Quality & Future Capital Investment. Working paper, Retrieved from: http://www. ssrn.com.
16) Lougee, B. & Marquardt, C. (2004). Earning Informativeness and Strategic Disclousure and Empirical Analysis of Proforma Earning. The Accounting Review, (79): 769-795.
17) Lyimo, Gregory D, (2014), “Accrual Quality and Stock Price Informativeness: Evidence from India”, Research Journal of Finance and Accounting, Vol.5, No.12.
18) Lyimo, Gregory D, (2014), “ASSESSING THE MEASURES OF QUALITY OF EARNINGS: EVIDENCE FROM INDIA”, European Journal of Accounting Auditing and Finance Research Vol.2, No.6, pp.17-28.
19) Penman, S. Zhang, X. (2002)." accounting conservatism, the quality earnings, and stock returns”, the accounting review, Vol.77, No.2, pp.237-264
20) Perotti, Pietro and Wagenhofer, Alfred (2011), “Earnings Quality Measures and Excess Returns”, December 2011, Center for Accounting Research University of Graz Universitaetsstrasse 15, A-8010 Graz,