242 J Adv Environ Health Res, Vol. 2, No. 4, Autumn 2014
Assessment of health impacts attributed to PM
10exposure during 2011 in
Kermanshah City, Iran
Elahe Zallaghi Elahe Zallaghi Elahe Zallaghi Elahe Zallaghi1111
, Mohammad Shirmardi , Mohammad Shirmardi , Mohammad Shirmardi , Mohammad Shirmardi2222
, Zahra Soleimani , Zahra Soleimani , Zahra Soleimani , Zahra Soleimani3333
,,,, Gholamreza GoudarziGholamreza GoudarziGholamreza GoudarziGholamreza Goudarzi4444 , , , , Mohammad
Mohammad Mohammad
Mohammad HeidariHeidariHeidariHeidari - - - -FarsaniFarsaniFarsaniFarsani5555, Ghassem Al, Ghassem Al, Ghassem Al, Ghassem Al----KKhamisKKhamishamishamis6666,,,, Ali SameriAli SameriAli SameriAli Sameri7777
1 Applied Science Training Center, Ahvaz Municipality, Ahvaz, Iran
2 Department of Environmental Health Engineering, School of Public Health AND Student Research Committee, Ahvaz Jundishapur University of Medical Sciences, Ahvaz, Iran
3 Department of Environmental Health Engineering, School of Public Health and Paramedical, Semnan University of Medical Sciences, Semnan, Iran
4 Environmental Technologies Research Center (ETRC), Ahvaz Jundishapur University of Medical Sciences, Ahvaz, Iran 5 Department of Environmental Health Engineering, School of Public Health AND Students Research Committee, Ahvaz Jundishapur University of Medical Sciences, Ahvaz, AND Specialist in Waste Management, Imam Khomeini Hospital, Abadan, Iran
6 Department of Environmental Health Engineering, School of Public Health, Ahvaz Jundishapur University of Medical Sciences, Ahvaz, Iran
7 Department of Parasitology and Mycology, School of Medicine, Ahvaz Jundishapur University of Medical Sciences, Arvand Branch, Abadan, Iran
Abstract Abstract Abstract Abstract
The main aim of this study was to evaluate cardiovascular and respiratory outcomes attributed to PM10 in Kermanshah,
Iran. In order to gather data, an Environmental Dust Monitor instrument was used at 3 stations throughout the city at a height of at least 3 m above the ground. We obtained an input file for the model from crude data and quantified PM10
using the AirQ model. Our estimation showed that 80% of cardiovascular deaths occurred on days with PM10
concentrations of less than 170 µgm-3. The number of respiratory deaths due to PM10 was estimated to be 46 people in
2011, showing a 48% reduction in such deaths compared to 2010. The number of patients with respiratory problems attributed to PM10 exposure comprised 5.61% of the total number of patients admitted to hospitals due to respiratory
diseases. This lower percentage of morbidity and mortality attributed to suspended particles in Kermanshah in 2011, in comparison with 2010, was due to the higher exposure days with PM10 concentration of 200-250 µgm-3 in 2010. Every
10 µgm-3 increase in the concentration of suspended particles led to a 0.8 and 1.2% rise in the mortality rate due to
cardiovascular and respiratory diseases, respectively. Additionally, the rates of heart and respiratory problems increased by 0.9 and 0.8%, respectively.
KEYWORDS: KEYWORDS: KEYWORDS:
KEYWORDS: Assessment, Health Impacts, Mortality, Cardiovascular Diseases, Particulate Matter
Date of Date of Date of
Date of submission:submission:submission:submission: 30 May 2014, Date of acceptance:Date of acceptance: Date of acceptance:Date of acceptance:22 Jul 2014
Citation: Zallaghi E, Shirmardi M, Soleimani Z, Goudarzi Gh, Heidari-Farsani M, Al-khamis G, Sameri A.
Assessment of health impacts attributed to PM10 exposure during 2011 in Kermanshah City, Iran. J Adv
Environ Health Res 2014; 2(4): 242-50.
Introduction
1
Corresponding Author Corresponding AuthorCorresponding Author Corresponding Author::::
Mohammad Heidari-Farsani Email: heidarimfar@gmail.com
In the standpoint of human beings and their health, health impact assessment of air quality is of paramount importance. Many studies have been conducted to illustrate mortality and
morbidity resulting from air pollutants in Iran.1`-4
PM10 are particulate matter with aerodynamic
diameter of 10 µm or less, which can be an appropriate parameter in terms of health impact assessment. Short-term and long-term epidemiological studies have investigated the relation between suspended particles and adverse effects on health, excess mortality, and the outbreak of cardiovascular and respiratory diseases. There are clear signs indicating that the health effects of particles are mainly attributed to PM10 and PM0.1.5 Air-polluting suspended
particles, regardless of chemical properties, are presented in figure 1 in terms of size.
High concentrations of suspended particulate matter (SPM) adversely affect human life in a number of ways, including the provocation of a wide range of respiratory and cardiovascular diseases, carcinogenic effects, profound impacts on defensive mechanism, and corrosion and loss of property.7-10 Important particles in air
pollution studies have a size between 0.01 to 100 µm.8 The average concentration of PM10 in the
world is about 10-80 µgm-3. In the most polluted
cities in Latin America such as Mexico City, the average concentration of PM10 could reach 100
µgm-3 or even higher. The concentration of
suspended particles in developing countries is commonly and traditionally much higher than
developed countries.7 In a report carried out by
the World Health Organization (WHO) on urban air pollution in megacities of the world (1994), in which the air quality of 20 cities were compared, it was revealed that most of the cities engaged were among the developing countries.11
According to this report, suspended particle concentrations in 17 of the total 20 studied cities were about two times higher than the WHO standards. This issue became even more intense with higher concentrations of SO2. The annual
mean range of SPM was 200-600 µgm-3. The
maximum concentration was reported to be 1000
µgm-3.11 The suspended particles enter the human
body exclusively through the respiratory tract and immediately disrupt the function of this part of the body. High concentrations of suspended particles are detrimental to human health, especially for those suffering from chronic respiratory diseases. Previous studies have shown that increased level of suspended particles in combination with sulfur oxides is the main cause of the increased number of patients admitted to the hospitals and clinics. The most common health problems caused by suspended particles include the upper respiratory tract infections, cardiac disorders, bronchitis, asthma, pneumonia, lung inflammation, carcinogenic effects, chest discomfort, and adverse effects on defensive mechanisms.8,12
Figure 1. The trimodal size distribution, showing general relationships between the
244 J Adv Environ Health Res, Vol. 2, No. 4, Autumn 2014 The capability of the human respiratory tract defense system against inhaled suspended particles depends highly on the size of the particles. The diameter of most suspended particles is in the range of 0.1-10 µm. The smaller particles undergo vibrational and Brownian motions, while the larger particles (> 10µm) precipitate rapidly. Due to the heightened level of dust particles in some regions of Iran in recent years, especially Kermanshah City, it is vital to evaluate the relationship between such particles and the increased number of cardiovascular and respiratory tract diseases.
Kermanshah City, with a population of approximately 843117 people, is located in the Southwest of Iran and currently considered as an industrial center of Iran as well as a source of dust events. As a result, the city is among the most polluted cities in Iran. The main objective of this study was to estimate the health effects of particulate matter (PM10) on mortality due to
respiratory and cardiovascular diseases in 2011 and compare the statistical results with those obtained for 2010.
Materials and Methods
Kermanshah, the capital of Kermanshah Province, is located in the Central-West Region of Iran. The geographical location of Kermanshah is 34° 19' N, 47° 7' E and it is 1322 m above sea level. According to the Damartn classification, which is based on average precipitation and average temperature, Kermanshah is placed in the category of cold and semi-arid climate with the annual average precipitation and temperature of 444.7 mm and 14.3°C, respectively. The vegetation cover is steppe with few trees in the ranges. The temperature may drop to 10°C in the winter; however, it rises to 44°C in the summer.13
The aim of the present study was the estimation of health endpoints attributed to PM10 pollutant using epidemiological indices.
The AirQ model that was introduced by the WHO in 2004 provides a valid and reliable tool
for estimating the short-term impacts of air pollutants.
The first step: sampling of PM10 pollutant: For
sampling of PM10 particles, 3 sampling stations
were selected in the city. A high-volume air samplers (model: Anderson) was used to sample and measure the concentrations of the suspended particles. Sampling, analysis, and selection of the stations were performed according to the EPA 3051A guideline.14,15 The
temperature and pressure parameters were recorded hourly by the weather channel software (www.msn.com).
The second step: data processing and model implementation: The measured PM10
concentration data was processed to provide daily average, minimum, maximum, and some statistical parameters. The processed data was entered into the AirQ model to estimate the number of cases of cardiovascular and respiratory morbidity and mortality.
Results and Discussion
Air pollution of Kermanshah attributed to
PM10 in 2011
The results presented in table 1 show that in all 3 studied stations, the average concentrations of PM10 in the summer were higher than the
winter, with the observed maximum concentration of 1810.5 µgm-3 in the summer.
The highest and lowest concentrations were observed in Ziba Park and Ostandari stations, respectively. According to table 1, the annual average concentration of PM10 in Kermanshah in
2011 was equal to 89.54 µgm-3, and
was117.91µgm-3 for the summer, which was
Table 1. The required indices of the model for PM10 (µgm -3
) in 3 studied stations in Kermanshah in 2011
Parameter Station
Ziba Park Shahrdari Ostandari Overall mean
The annual average 90.03 89.34 89.26 89.54
The summer average 118.34 117.76 117.62 117.91
The winter average 60.60 59.80 59.78 60.06
98th annual percentile 330.95 328.36 329.12 329.48
Annual maximum 1810.50 1809.00 1804.00 1807.83
Summer maximum 1810.50 1809.00 1804.00 1807.83
Winter maximum 283.00 283.00 278.00 281.33
Table 2. The estimation of relative risk indices, attributable proportion, and number of cases of cardiovascular disease mortality (Baseline incidence (BI) = 497) in Kermanshah in 2011
Estimation Epidemiological indices
Relative risk (average) Attributable proportion (%) Number of cases
Lower 1.005 3.5839 151.6
Average 1.008 5.6135 237.8
Upper 1.018 11.8023 499.2
Table 3. The estimation of relative risk indices, attributable proportion, and number of cases of respiratory tract disease mortality (BI = 66) in Kermanshah in 2011
Estimation Epidemiological indices
Relative risk (average) Attributable proportion (%) Number of cases
Lower 1.008 5.6135 31.5
Average 1.012 8.1904 46.0
Upper 1.037 21.5728 121.2
Quantification of the health effects due to PM10
exposure
By using results yielded by data processing and registered data from the measurement stations for suspended particles throughout the city, and estimating the population in 2011, we obtained various indices that will be described in the following sections.
According to table 2, by considering the central relative risk, attributable proportion of cardiovascular disease mortality was 5.61% in 2011, which showed a 6.27% reduction in contrast with 2010.16
Attributable proportions, in the conditions of the estimation with the lower and upper relative risks, were 3.58 and 11.80%, respectively. By considering a baseline incidence equal to 497 per 100,000 people for cardiovascular diseases, the accumulative number of mortality due to such
diseases was 237 people, showing a reduction of 261 people in contrast with 2010.16 The
maximum number of exposure to PM10 and
mortality due to cardiovascular diseases were observed in the concentration range of 50-60 µgm-3. The corresponding values estimated for
mortality due to respiratory tract diseases are presented in table 3. The relative risk indices, attributable proportion, and number of cases of outpatient treatment due to both cardiovascular and respiratory tract diseases were also estimated (Tables 4 and 5).
Indices of mortality due to cardiovascular and
respiratory tract diseases attributed to PM10 in
Kermanshah in 2011
Considering an annual average PM10
concentration of 89.54 µgm-3 and a population of
246 J Adv Environ Health Res, Vol. 2, No. 4, Autumn 2014 respiratory tract diseases attributed to PM10
exposure, we obtained the health impacts based on the number of deaths in every 100,000 people by the following equation:
(M /P ) × 100000
where Mt is mortality due to cardiovascular
and respiratory tract diseases attributed to PM10
exposure, Pt is the total population, and the unit
is mortality per 100,000 people.
For cardiovascular disease: 237/851405 = 27.83 deaths in every 100,000 people
The results obtained from the model show that the number of cardiovascular mortality and outpatient cases attributed to PM10 in the air of
Kermanshah for central or average relative risk were 237 and 233, respectively, in 2011.For respiratory tract disease: 46/851405 = 5.40 deaths in every 100,000 people
The values obtained from the model show that the number of respiratory tract diseases mortality and outpatient cases with respiratory problems attributed to PM10 in the air of
Kermanshah for central relative risk were 46 and 602, respectively, in 2011.Figure 2 illustrates a steady increase in the mortality rate due to cardiovascular diseases associated with a PM10
concentration of 50-100 µgm-3, whereas it shows
a steep increase in the concentrations of higher than 350 µgm-3. Indeed, figure 2 shows that 80%
of the deaths due to cardiovascular diseases occurred on days with concentrations of less than 170 µgm-3. With every 10 µgm-3 increment
in the concentration of suspended particles, the risk of deaths due to cardiovascular diseases increased by 0.8%.
According to table 3, and based on the calculated relative risk and the results from figure 3, the accumulative number of deaths due to respiratory tract problems attributed to PM10 was
estimated to be 46 individuals. This rate, in comparison with 2010, shows a decrease in mortality rate of 48 individuals.16 Moreover, 80% of
such deaths occurred on the days with PM10
concentrations of less than 170 µgm-3. The steep
phase of the curve in figure 3, corresponding with RR = 1.022, represents the maximum mortality rate (6 people) in the range of 50-60 µgm-3. As can be
seen, the slope of the upper and lower curves in the figure is steep in this range. The slight slope in the concentration range of 10-20 µgm-3 represents the
minimum number of deaths due to respiratory tract problems. Every 10 µgm-3 increase in the
concentration of suspended particles led to a 1.2% increase in the risk of death due to respiratory tract problems. Figure 3 illustrates a steady increase in mortality due to respiratory tract problems associated with a PM10 concentration of 50-100 µgm -3, but it shows a steep increase in the concentrations
of higher than 350 µgm-3.
Table 4. The estimation of relative risk indices, attributable proportion, and number of cases of cardiovascular diseases attributed to PM10 (outpatient treatment) (BI = 436) in Kermanshah in 2011
Estimation Relative risk (high) Attributable proportion (%) Epidemiological indices Number of cases
Lower 1.006 4.2701 158.4
Average 1.009 6.2712 232.7
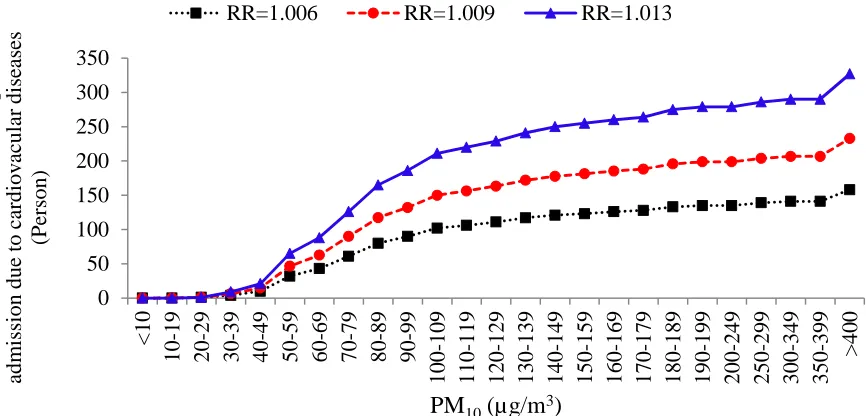
Upper 1.013 8.8128 327.0
Table 5. The estimation of relative risk indices, attributable proportion, and number of cases of respiratory tract diseases attributed to PM10 (outpatient treatment) (BI = 1260) in Kermanshah in 2011
Estimation Epidemiological indices
Relative risk (high) Attributable proportion (%) Number of cases
Lower 1.0048 3.4455 369.4
Central 1.008 5.6135 601.9
Figure 2. Accumulative mortality due to cardiovascular diseases attributed to PM10
based on PM10 concentration in Kermanshah in 2011
Figure 3. Accumulative mortality due to respiratory tract diseases attributed to PM10 based on PM10 concentration in Kermanshah in 2011
Some studies have utilized the AirQ model to estimate the health effects of particulate matter. For example, Tominz et al. used the AirQ model to estimate the health impacts of PM10 in Trieste,
Italy, in 2005.17 The authors reported that 1.8% of
natural deaths, 2.2% of cardiovascular deaths, and 2.5% of respiratory deaths were attributable to PM10 concentrations of higher than 20 µgm-3.
In 2009, Goudarzi used the AirQ model to estimate the health impacts of PM10 in Tehran,
Iran.18 The results of the study showed that
about 4% of the total number of cardiovascular and respiratory tract diseases was attributed to a
PM10 concentration of higher than 20 µgm-3. In
another study, Yavari et al. demonstrated that about 13% of the total number of cardiovascular and respiratory tract diseases was attributed to a PM10 concentration of higher than 20 µgm-3.19
Ostro et al. analyzed the relationship between PM10 and daily mortality rate between 1989 and
1991, and reported a strong association between mortality from either respiratory disease or cardiovascular disease and PM10.20 Based on a
regression model of examining the air pollution in 10 cities of the United States, Schwartz has calculated that the relative risk for adults older 0 100 200 300 400 500 < 10 10-19 20-29 30-39 40-49 50-59 60-69 70-79 80-89 90-99 100-109 110-119 120-129 130-139 140-149 150-159 160-169 170-179 180-189 190-199 200-249 250-299 300-349 350-399 > 40 0 A cc um ul at iv e m or ta li ty f or ca rdi ov as cul ar di se as es (P er son)
PM10(µg/m3)
RR=1.005 RR=1.008 RR=1.018
0 20 40 60 80 100 120 140 < 10 10-19 20-29 30-39 40-49 50-59 60-69 70-79 80-89 90-99 100-109 110-119 120-129 130-139 140-149 150-159 160-169 170-179 180-189 190-199 200-249 250-299 300-349 350-399 > 40 0 A cc u m u la ti v e m or ta li ty fo r re sp ir at o ry t ra ct d is ea se s (P er so n )
PM10(µg/m3)
248 J Adv Environ Health Res, Vol. 2, No. 4, Autumn 2014 than 65 years would be 2% for each 10 µgm3
increase in PM10.21
Indices of cardiovascular and respiratory tract diseases mortalities for outpatient treatment
d u e t o P M1 0 i n K e r m a n s h a h i n 2 0 1 1
According to the results of table 4 and figure 4, accumulative number of cardiovascular disease cases was 233, based on the estimated average relative risk (RR = 1.009) and baseline incidence rate of 436 in 105 people. This showed a
reduction of 251 people in comparison with 2010. Approximately, 80% of the cases occurred on the days when PM10 concentration was
higher than 170 µgm-3. The accumulative
numbers of such health impacts in the lower (RR = 1.006) and upper (RR = 1.013) relative risks were 158 and 327 individuals, respectively. Every 10 µgm-3 increment in the concentration of
suspended particles resulted in a 0.9% increase in the risk of cardiovascular diseases.
According to the results of table 5 and figure 5, the accumulative number of respiratory tract disease cases due to PM10
exposure, based on the estimated average relative risk (RR = 1.008) and baseline incidence of 1260 in 105 people, was 602. This
showed a reduction of 660 people in comparison with 2010.16 Approximately, 80%
of the cases occurred on the days when PM10
concentration was higher than 170 µgm-3.
Thus, the number of referrals to the hospitals due to respiratory tract diseases attributed to exposure to PM10 comprised 5.61% of the total
referrals. The accumulative numbers of such health impacts in the estimated lower (RR = 1.0048) and upper relative risk (RR = 1.0112) were 369 and 824 individuals, respectively. Every 10 µgm-3 increment in the concentration
of the suspended particles resulted in a 0.8% increase in the risk of respiratory tract diseases. Figures 4 and 5, respectively, illustrate steady increases in the number of outpatients due to cardiovascular and respiratory tract diseases associated with PM10
concentrations of 50-100 µgm-3, but showed
steep increases in the concentrations of higher than 350 µgm-3.
Figure 4. Accumulative number of hospital admission due to cardiovascular diseases attributed to PM10 based on PM10 concentration in Kermanshah in 2011
0 50 100 150 200 250 300 350
<
10
10-19
20-29
30-39
40-49
50-59
60-69
70-79
80-89
90-99
100-109
110-119
120-129
130-139
140-149
150-159
160-169
170-179
180-189
190-199
200-249
250-299
300-349
350-399
>
40
0
A
cc
um
ul
at
iv
e
num
be
r of
hos
pi
ta
l
adm
is
si
on
due
t
o
ca
rdi
ov
ac
ul
ar
di
se
as
es
(P
er
son)
PM10(µg/m3)
Figure 5. Accumulative number of hospital admission due to respiratory tract diseases attributed to PM10 based on PM10 concentration in Kermanshah in 2011
Conclusion
The average concentration of PM10 during the
study period was 89.54 µgm-3, with the
maximum concentration of 1809 µgm-3 in the
summer. The maximum and minimum concentrations were observed for Ziba Park and Ostadnari stations, respectively. The low number of morbidity and mortality cases due to suspended particles in Kermanshah in 2011, in comparison with 2010, was due to the lower average concentration of PM10 or more days
with lower concentration in the air. This means that individuals were exposed to a PM10
concentration of 200-250 µgm-3 for a longer time
in terms of days, compared with 2010. Moreover, the concentration of PM10 did not
reach lower than 30 µgm-3 on any day. However,
the individuals were exposure to a PM10
concentration of 50-60 µgm-3 for a longer time,
compared with 2010.
Conflict of Interests
Authors have no conflict of interests.Acknowledgements
The authors are grateful to Ahvaz Jundishapur University of Medical Sciences, and Science Research Branch of Khuzestan, Islamic Azad University for their cooperation in the study.
References
1. Goudarzi Gh, Zallaghi E, Neissi A, Ahmadi Ankali K, Saki A, Babaei AA, et al. Cardiopulmonary mortalities and chronic obstructive pulmonary disease attributed to ozone air pollution. Arch Hyg Sci 2013; 2(2): 62-72.
2. Goudarzi Gh, Mohammadi MJ, Angali K, Neisi AK, Babaei AA, Mohammadi B, et al. Estimation of health effects attributed to no2 exposure using airq model. Arch Hyg Sci 2012; 1(2): 59-66.
3. Naddafi K, Hassanvand MS, Yunesian M, Momeniha F, Nabizadeh R, Faridi S, et al. Health impact assessment of air pollution in megacity of Tehran, Iran. Iran J Environ Health Sci Eng 2012; 9(1): 28.
4. Zolghi A, Godarzi Gh, Gravandi S, Mohamadi M, Vosoghi Nayeri M, Visi E, et al. Estimate of cardiovascular and respiratory diseases related to particle matter pollutant in Tabriz air, northwest of Iran, 2011. J Ilam Univ Med Sci 2014; 22(1): 84-91. [In Persian].
0 100 200 300 400 500 600 700 800 900
<
10
10-19
20-29
30-39
40-49
50-59
60-69
70-79
80-89
90-99
100-109
110-119
120-129
130-139
140-149
150-159
160-169
170-179
180-189
190-199
200-249
250-299
300-349
350-399
>
40
0
A
cc
um
ul
at
iv
e
num
be
r of
hos
pi
ta
l
adm
is
si
on
due
t
o
re
spi
ra
tor
y
t
ra
ct
di
se
as
es
(P
er
son)
PM10 (µg/m3)
250 J Adv Environ Health Res, Vol. 2, No. 4, Autumn 2014 5. Chow JC. Measurement methods to determine compliance with ambient air quality standards for suspended particles. J Air Waste Manag Assoc 1995; 45(5): 320-82.
6. Colls J, Tiwary A. Air Pollution: Measurement, Modelling and Mitigation. 3rd ed. New York, NY: CRC Press; 2009.
7. Janssen NA, Schwartz J, Zanobetti A, Suh HH. Air conditioning and source-specific particles as modifiers of the effect of PM(10) on hospital admissions for heart and lung disease. Environ Health Perspect 2002; 110(1): 43-9.
8. Fanger PO. Thermal comfort: Analysis and applications in environmental engineering. New York, NY: McGraw-Hill; 1970.
9. World Health Organization. Air Quality Guidelines: Global Update 2005: Particulate Matter, Ozone, Nitrogen Dioxide, and Sulfur Dioxide. Geneva, Switzerland: World Health Organization; 2006.
10.Lippmann M. Environmental Toxicants: Human Exposures and Their Health Effects. New Jersey, NJ: John Wiley & Sons, 2000.
11.Mage D, Ozolins G, Peterson P, Webster A, Orthofer R, Vandeweerd V, et al. Urban air pollution in megacities of the world. Atmospheric Environment 1996; 30(5): 681-6.
12.Panyacosit L. A Review of Particulate Matter and Health: Focus on Developing Countries [Online]. [cited 2000]; Available from: URL:
http://www.iiasa.ac.at/publication/more_IR-00-005.php 13.Kermanshah Department of Environment. Goegrafical location of Kermanshah Province [Online]. [cited 2014]; Available from: URL:
http://kermanshah.doe.ir/Portal/home/?138133
14.Viana M, Kuhlbusch TAJ, Querol X, Alastuey A, Harrison RM, Hopke PK, et al. Source apportionment of particulate matter in Europe: A review of methods and results. Journal of Aerosol Science 2008; 39(10): 827-49.
15.Lodge JP. Methods of Air Sampling and Analysis. New York, NY: CRC Press; 1988.
16.Zallaghi A. Quantification and health effects comparison of criteria air pollutants in southwest of Iran (Ahvaz-Kermanshah-Bushehr) by using of AIR Q Model [MSc Thesis]. Ahvaz, Iran: Islamic Azad University, Science and Research Branch; 2010. [In Persian].
17.Tominz R, Mazzoleni B, Daris F. Estimate of potential health benefits of the reduction of air pollution with PM10 in Trieste, Italy. Epidemiol Prev 2005; 29(3-4): 149-55.
18.Goudarzi G. Quantifying the health effects of air pollution in Tehran and determines the third axis of the comprehensive plan to reduce air pollution in Tehran [PhD Thesis]. Tehran, Iran: Tehran University of Medical Sciences; 2009. [In Persian].
19.Yavari AR, Sotoudeh A, Parivar P. Urban Environmental Quality and Landscape Structure in Arid Mountain Environment. International Journal of Environmental Research 2007; 1(4): 325-40.
20.Ostro B, Sanchez JM, Aranda C, Eskeland GS. Air pollution and mortality: results from a study of Santiago, Chile. J Expo Anal Environ Epidemiol 1996; 6(1): 97-114.