FINANCIAL INCLUSION AND INCLUSIVE GROWTH:
A CROSS-PROVINCE ANALYSIS IN INDONESIA
1I Made Sanjaya2
Nursechafia
This paper computes and analyzes the degree of financial inclusion and the inclusive growth in Indonesia. Using provincial data, we calculate the Index of Financial Inclusion (IFI) based on the accessibility, the availability, and the usage of the financial services. On the other hand, the Index of Inclusive Growth (IIG) is developed through the method of social opportunity function by increasing the average level and equity index of opportunities. The result shows that the financial inclusion in Indonesia is largely determined by the accessibility, while the availability and the usage play only small portion. This leads to a conclusion that the group of the poor is limited on using the financial services. Furthermore, we use social opportunity function to measure the inclusive growth, and find a positive correlation with the financial inclusion. These findings call the attention from regulators to push the financial sector to extend their services further beyond their existing market target.
Abstract
Keywords: Financial Inclusion, Inclusive Growth, Poverty JEL Classification: G21, I14, I32
1 Earlier draft of this paper was presented at The 9th International Conferences of Bulletin of Monetary Economics and Banking 2015, “Balancing High Sustainability Growth with Macroeconomic Stability”. Central Bank of Indonesia, Jakarta, August 6th, 2015. 2 I Made Sanjaya is researcher at International Center for Applied Finance and Economics (InterCAFE), Bogor Agricultural University
I. INTRODUCTION
As the deadline for achieving the Millennium Development Goals, the year of 2015 becomes an important milestone to highlight the achievement from each region. The goals emphasize the elimination of extreme poverty by enabling all segments of the population to benefit from such growth (United Nations, 2015). In this regard, economic growth in Indonesia continuous to perform well over the past decade which GDP annual growth rate reaches 5.03 percent in 2014. Moreover, there is a decline trend of the percentage of poor people from 2002 to 2014 (Statistics Indonesia, 2015).
Despite the success achieved in terms of economic growth and poverty level, large divergences exist in poverty rates between rural and urban areas, with extreme poverty in urban areas is usually higher than in rural areas. In addition, gaps in development achievements have widened across provinces. Poverty in eastern provinces shows far higher numbers than in the more developed western-located islands. The top five of Indonesian provinces on poverty are Papua, West Papua, East Nusa Tenggara, Maluku, and Gorontalo. As a consequence, the Gini coefficient of income has increased considerably since the 1990s (Statistics Indonesia, 2015).
This has heightened the need for government to create a broader concept of economic growth that enabling all segments of the population to benefit for such growth. The inclusiveness in economic growth thus becomes one of the crucial policies to alleviate poverty. To achieve this objective, many developing countries including Indonesia concern to improve financial sector as the core of development agenda (Bank Indonesia, 2014). Without removing financial barriers to financial services, poor people may find themselves in the poverty trap (Demirgüç-Kunt et al., 2008). In short, the concept of inclusive financial system emerges as not only for pro-growth, but also pro-jobs for the poor.
While the importance of inclusiveness either for financial sector and economic growth is widely recognized in the policy circle in recent years, scarcity of literature focusing on measurements and determinants of financial inclusion for inclusive growth of Indonesia leads to void. Consequently, a more nuanced understanding in assessing its dynamics has risen to be a substantial agenda. To bridge the gap, this study endeavors to examine status in inclusiveness of finance and growth across provinces.
To the best of our knowledge, this is the first unified study in measuring and determining growth and financial inclusiveness applied in an Indonesian cross-province context. A unified index further provides a prior province-specific measurement to design financial and economic policies that are firmly based on empirical evidence.
II. THEORY
A number of recent papers have convinced many developing economists and policy makers about the positive impact of financial inclusion on economic growth and poverty alleviation. However, there is still no a global definition to represent financial inclusion. At the beginning, the early study is initially contributed from Leyshon and Thrift (1995) who define financial inclusion as antithesis of financial exclusion. The processes of financial exclusion prevent poor and disadvantaged social groups from gaining access to the financial system because of lack accessibility, collateral, credit histories and connections.
Based on the above problems, it is crucial to improve pro-poor financial sector policy by eliminating financial barriers through an absence of price and non-price barriers (Demirgüç-Kunt et al., 2008; Chandran and Manju, 2010). The concept of financial inclusion thus emerges as a multidimensional phenomenon. According to Amidzic (2014), there are at least three main dimensions on financial inclusion, namely the outreach, usage and quality of financial services. The outreach dimensions refers to the likelihood that the recipients are easily able to reach a point of service. The usage dimensions measures the use of financial services reflected by the number of Automatic Teller Machines (ATMs), banks’ branches household depositors and borrowers, while the quality assess the level of financial products in fulfilling the people’s needs.
Since the early 2000s, financial inclusion has been widely used as a policy concern for many governments and central banks in developing nations. In India, financial inclusion emphasizes the process of ensuring access to financial services and adequate credit for the poor at an affordable cost (Rangrajan Committee, 2013). In Peru, Reyes (2010) highlights the importance of a broad access for majority of the population to a portfolio of financial products and services, such as loans, deposits, insurance, pensions, payment systems, as well as financial education and consumer protection mechanisms.
In Indonesia, financial inclusion becomes a national strategy to boost economic growth through equal income distribution, poverty reduction and financial system stability (Hadad, 2010). The right of every individual is ensured to access a full range of quality financial services at an affordable cost. The target of the policy concerns to low-income poor, productive poor, migrant workers and people living in remote areas (Bank Indonesia, 2014).
The call for inclusive growth in Asia has emerged when recent growth in Asia is accompanied by falling poverty and rising disparities (Klassen, 2010). Growth with continued inequalities within a country may create social and political unrest and criminal activities from people who are persistently deprived (ADB, 2011). These episodes emphasize that the mere growth is not sufficient to enable all segments of the population to benefit from such growth. The concept of inclusiveness has thus emerged as the main policy to be considered especially for incorporating the needs of the extremely poor and vulnerable.
However, there exists no clear indicator to define the progress of inclusive growth. Some international organizations define inclusive growth in ways that are at odds one another. For instance, World Bank (2008) mainly concerns on labor-intensive industry policies, rather than on income distribution. Building the climate for employment growth and productivity growth presumably generates new jobs and income for labor as the most important asset of the poor. On the other hand, the Organization for Economic Co-Operation and Development (OECD) proposes pro-poor growth that allows the impact of non-income (health, education, etc.) on the well-being of the poor.
Likewise, the United nation Development Program (UNDP) emphasizes the inclusive growth is about more than income by putting other indicators of improved wellbeing (human development) first. The brief definition also given by Asian Development Bank (ADB) through its Strategy 2020 that identifies inclusive growth as two strategic focuses, namely high sustainable income growth and opportunities for all societies. To do this, ADB (2011) proposes the three policy pillars that supported by good governance and strong institutions – expansion of economic opportunity, social inclusion to promote equal access to opportunities, and social safety nets (Klassen, 2010).
Recent studies also show different approach in defining inclusive growth. Ali and Son (2007) entirely concern into an approach that examines the patterns of non-income dimensions of wellbeing such as education and health. Meanwhile, the Ali and Zhuang (2007) definition is closely related to Zhuang and Ali (2011) that reinforces: (i) high and sustainable growth for productive employment opportunities; and (ii) social inclusion for equal access to opportunities. Klassen (2010) uses two elements of inclusive growth: (i) participation of all members, particularly the poor and disadvantaged; and (ii) non-income dimensions of wellbeing (education, health, nutrition, and social integration.
To do this, Anand, Mishra and Peiris (2013) highlight the income growth and income distribution as the main factors of inclusive growth. The inequality can decline if and only if the incomes of poor people grow faster than those of the population as a whole (relative definition). However, the goal of reducing inequality is not to sacrifice the rich at the expense of the poor. Anand, Tulin and Kumar (2014) further explore a new measure of inclusive growth that initially
developed by Anand, et al. (2013). Besides social expenditures, spending on education, and
To be concluded, the international organizations and researchers have the same approach to produce related concepts of inclusive growth, which is pro-poor growth and equal opportunity. Pro-poor growth can be achieved through equality of opportunity so that everyone can benefit from the growth process. Hence, this study attempts to define inclusive growth by integrating two strands of the literatures (pro-poor growth and opportunity issues). Pro-poor growth requires a broader focus of attention than access for income growth; improving access of non-income dimensions (health, education, and social) for all levels particularly the extreme poor can have a strongly favorable indirect effect for inclusive growth.
Empirical evidence shows a strong positive link between the development of the financial system and long-run economic growth (Levine, 2005). In cross country regression, Beck, Demirgüç-Kunt and Levine (2004) assess the impact of financial intermediary development on the poor and income inequality. The results indicate that better-developed financial sector give positive impact on (i) the falling of income inequality (Gini coefficient), (ii) the higher income of the poorest people and (iii) the fall of percentage of population living in poverty. Indeed, Beck, Demirgüç-Kunt, and Honohan (2008) show that economies with pro-poor financial access undergo faster drops in income inequality and faster reductions in poverty levels.
Existing work suggests that it is not enough to merely concern on the development of finance and growth. Thus, the broad concept of inclusiveness of finance and growth recently emerges to provide easy access on portfolio financial products for an equal opportunity on growth (Demirgüç-Kunt, et al., 2008; Chandran and Manju, 2010). Most studies discuss separately on two different topics of financial inclusion and inclusive growth.
For financial inclusion, some literatures tries to measure the extent of financial inclusion across economies, such as Demirgüç-Kunt and Klapper (2012), Sarma (2012) and Amidizic, Massara and Mialou (2014). At the beginning, the first analysis of the Global Financial Inclusion (Global Findex) Database had been conducted in 148 economies by Demirgüç-Kunt and Klapper (2012). They measure adult’s use (micro level) of financial products across economies in 2011. The results of survey-based information show that 50 percent of adults worldwide use formal financial services, while more than 2.5 billion adults do not have a formal account. However, partial and incomplete information from micro level analysis may lead to a misinterpretation of the extent of financial inclusion in the macro perspective.
For inclusive growth, empirical research has expanded the study to examine the indicators
of inclusive growth, such as Ali and Son (2007), Zhuang and Ali, (2011), Anand, et al., (2013)
and Anand, et al. (2014). To start, Ali and Son (2007) discuss the measurement of inclusive
growth from two factors of social opportunities function: (i) average opportunities available to the population; and (ii) how opportunities are distributes in the population. The study develops dynamic analysis of inclusive growth through the shift of opportunity curves. If the curve shifts upward, the growth is inclusive. By taking the case of Philippines, the study focuses on public service in health and education.
Following Ali and Son (2007), the measurement of inclusive growth is also developed
by Anand, et al. (2013). They apply the microeconomic concept of a social mobility function
by adding macroeconomic dimensions of growth and income distribution. They found that macroeconomic stability, human capital, and structural changes are indicated as foundation
of inclusive growth. Further, Anand, et al.’s (2013) results aligns closely to the study of Anand,
et al. (2014). Here, Anand, et al. (2014) determines whether macroeconomic and financial conditions have empirical significance in growth inclusiveness.
According to the above explanation, a deep understanding of finance and growth are substantively advance by the further measurement of the interaction between the inclusiveness of the financial system and economic growth. Recently, empirical research has adequately discussed the study of the long-run growth effects of financial development to the economic growth. However, the empirical evidence on whether inclusion in finance implies inclusive growth is rather limited.
For instance, a research that explains in theoretical foundation of growth and finance inclusiveness is shown by Chandran and Manju (2010). The study presents a descriptive analysis in enhancing financial inclusion that is usually linked to poverty alleviation and at the end create inclusive growth. They argued that the financial inclusion will serve a stronger and inclusive growth by empowering individuals and families to cultivate economic opportunities.
In terms of empirical analysis, Anand, et al. (2014) examined the determinants of growth
inclusiveness. To formulate state-level panel model, an index of inclusive growth which is
proposed by Anand, et al. (2013), are used as dependent variable, while the set of independent
III. METHODOLOGY 3.1. Data
This study analyzes Indonesian data from 2008 to 2014 which is obtained from various source. Besides from Bank Indonesia and World Bank, a specific data from National Social Economic Survey Data (SUSENAS) are predominantly used because it relatively provides a consistent data on yearly basis in 33 provinces. The survey which is developed by Statistics Indonesia has two sets of data which are core data (baseline survey) and module data (specific data). SUSENAS provides data for a specific measure of consumption, household welfare, and current household income from a sample size of 237,641 individuals across Indonesia (Furuta, 2014). To analyze these data, this study utilizes statistical software of Stata and Excel. Figure 1 summarizes the provision of data from various indicators.
Figure 1. Indicator Conceptual Map
Financial Inclusion
Accessibility
¾ Number of working poor adult ¾ Number of poor
adult
Availability
¾ Number of banks offices ¾ Number of
adult
Usage
¾ Number of poor household receiving credit
¾ Number of poor household
Inclusive
Growth Income per capita Change of income per capita
3.2. Measurement Analysis
This study focuses to assess index measurement of two main sectors. Firstly, the index measurement of financial inclusion is adopted from the method of Sarma (2012). The method of Sarma (2012) is applied because it provides a robust comprehensive measurement and comparable across province. Secondly, the inclusiveness in growth is analyzed by using the
method of Ali and Son (2007) and Anand, et al. (2013). In detail, the steps of method are
3.2.1. Index of Financial Inclusion (IFI)
We use three dimensions to measure the Index of Financial Inclusion (IFI); they are accessibility (d1), availability (d2), and usage (d3). The indicator of accessibility reflects a penetration of formal financial institutions, while the availability is indicated by banking branches. Lastly, usage dimension includes the volume of credit per total household sector. These data is used after considering the availability of data from various sources, in particular SUSENAS. The three
dimensions (di) is formulated from:
where: Wi = weight attached to the dimension i
Ai = actual value of dimension i
mi = lower limit on the value of dimension i
Mi = upper limit on the value of dimension i
After accomplishing the three dimensions, a single value of dimension will be placed
between 0 and wi. In this study, the weight attached to each dimension is the same (wi = 1).
Following the method of Sarma (2012), this research assumes that all dimensions have the
same importance, so that the weighted value wi = 1 for all i. The dimension value closes to wi
shows the area with the highest achievement in all dimensions.
Sarma (2012) empirically observed minimum for the lower limit and maximum for the upper limit. Unlike the human development dimensions, it is difficult to assess the upper and lower limit of financial inclusion. However, since there is no outlier result in Indonesian case,
the point of Mi represents the maximum value from the available data which is formed as the
upper limit for each dimension, while mi represents the lower limit.
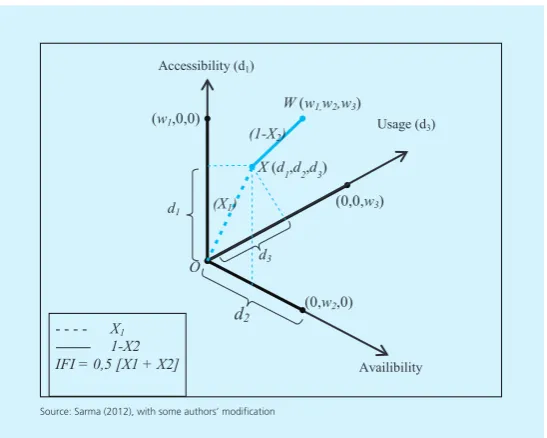
Further, X1 gives the normalized Euclidean distance of X from the worst point 0, while
X2 is normalized Euclidean distance of X from the ideal point w. IFI will be proceeded through
Figure 2. Graphic of a 3-dimensional IFI
The below IFI formula is simple average of X1 and X2
As mentioned earlier, the index value of each dimension lies between 0 and wi. The
higher value of di indicates the more ideal point on dimension at i. The point X = (d1, d2, d3) shows the achievement of financial inclusion at a province. In dimensional space, the point O = (0,0,0) represents the worst situation, while the point W = (w1, w2, w3) – where w1, w2,
and w3 are the weight attached to each dimension – represents the most ideal situation for all
dimensions (Figure 2).
Accessibility (d1)
Usage (d3)
Availibility
(w1,0,0)
(0,0,w3)
(0,w2,0)
d3
d2
d1
X (d1,d2,d3) W (w1,w2,w3)
(1-X2)
(X1)
- - - - X1
--- 1-X2 IFI = 0,5 [X1 + X2]
O
Source: Sarma (2012), with some authors’ modification
With the point W = (1,1,1), the final formula of IFI is:
The IFI formula is obtained by averaging the value of X1 dan X2 which represents the
Figure 3. Social Mobility Curve
3.2.2. Index of Inclusive Growth (IIG)
For the index measurement, there will be a variation status in inclusiveness of finance and
growth across provinces in Indonesia. The Index of Inclusive Growth (IIG) is initially developed
by Ali and Son (2007) by focusing on the social opportunity function. Following Ali and Son (2007), the social opportunity in this study is defined as the opportunity of the society to access the educational and health services. The opportunity to access health services is measured on how sick people seek treatment in available health facilities or hospitals, while the access of education is measured through average access to education by school-age children. For this purpose, this study used the National Social Economic Survey Data (SUSENAS) that provides these indicators at the province level.
As in Ali and Son (2007), the average opportunity ( y ) for the population (n) who enjoys
a given opportunity defined as:
Graphically, Figure 3 shows the social mobility curve.
������������������������������������������������������������������������������ �
� �
�
�
�
������������������� �����
���������������������������������� ������
����������������������������� �������
The greater the y, the greater the average level of opportunity. Ali and Son (2007) propose an income equity index as:
An equitable society is shown by y > y. According to Ali and Son (2007), the value w
> 1 shows the more equal opportunity, while w < 1 shows the more unequal opportunity.
Rearranging,
Some conditions could achieve inclusive growth by increasing the average level of
opportunities (y), increasing equity index of opportunities (w) or combining both terms. Growth
is more inclusive if the degree of inclusive growth (d y)> 0. It is formulated as:
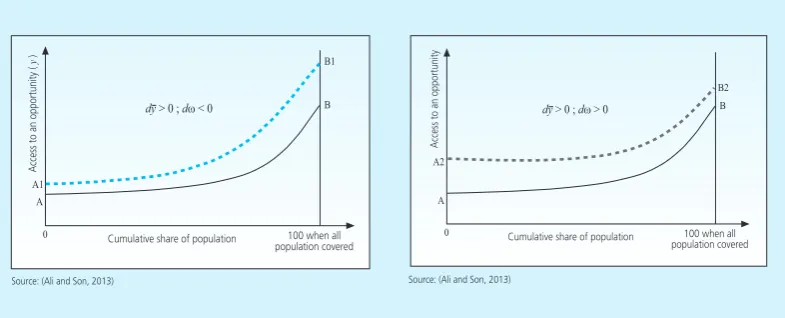
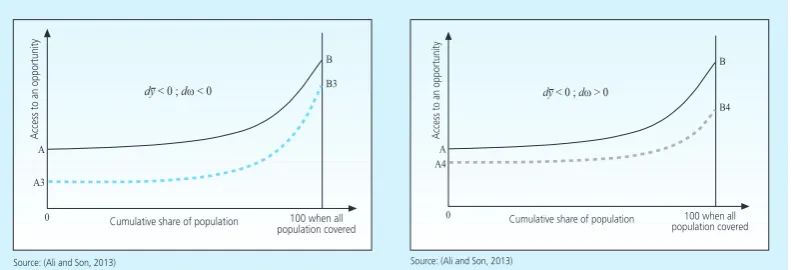
Figure 4 depicts graphically all possible combination of the shift from the two terms
(average opportunity and distribution of opportunity). A trade-off could exist between y and
w, where if y increases, w may decrease, vice versa.
���������������������������
������������������������������
���������������������������
��
�
�� �
�
��
�
������������ ������������������
���������������
���������������������������
������������������������������
������������������������
��
�
�
�� �
������������ ������������������
When > 0 and < 0, the shift (AB to A1B1) shows higher social opportunity
with the reduction in distribution opportunities. In the contrary, when < 0 and > 0,
the shift (AB to A4B4) shows higher social opportunity with the contraction in average level of opportunities. The unambiguous inclusive of growth (AB to A2B2) could be happen if both
terms show positive results ( > 0 and > 0). Similarly, the growth is unambiguously
non-inclusive (AB to A3B3), when both terms are negative ( < 0 and < 0).
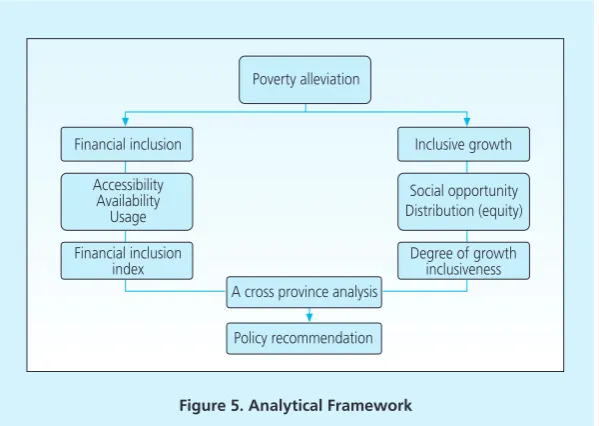
3.3. Analytical Framework
Figure 5 presents the analytical framework of this study. The final target is to alleviate poverty by using the sustainability and inclusiveness in two main sectors – finance and economy. To implement these concepts, computing of Financial Inclusion (IFI) and Index of Inclusive Growth (IIG) is implemented across 33 provinces comparison.
In the index presented in the paper, IFI is built from dimensions of accessibility, availability of the banking service and usage of banking system. Further, a measure of IFI that is based on the proportion of adults or households with a bank account ignore the important segment of population excluded from financial sector. To distinguish from others, these dimensions are largely focused on quantifying the extent of financial inclusion that can be accessed by the poor. Meanwhile, IIG assesses income per capita and change of income per capita. If a province becomes more inclusive, it is not only improve the growth but also the social opportunity (access to health and education) for the poor is higher than the non-poor.
These measurement together build an inclusive system in finance and economy. As finance become the major form in the Indonesian economic system, financial system is often used as the gateway to sustain the economic growth. Similarly, this study consider financial inclusion as being analogous to inclusive growth. By making it possible to assess the extent of IFI and IIG as
���������������������������
������������������������������
������������������������
�� �
�
�� �
������������ ������������������
���������������
���������������������������
������������������������������
������������������������
�� �
�
�� �
������������ ������������������
���������������
Indonesian provinces database, the data can help policy makers prioritize reforms accordingly to promote the design of policies firmly based on empirical evidence.
Figure 5. Analytical Framework
���������������� ������������� �������������������
�����
�������������������
������������������� ����������������
������������� ������������
�����
������������������ ���������������������
�������������������������
���������������������
IV. RESULT AND ANALYSIS 4.1. Financial Inclusion
There is transition program to empower the poor which is from microcredit to microfinance. In process, the inclusiveness in finance offers a broader set of financial services including credit, savings, money transfers and insurance plan (Robinson, 2001; Armendariz and Morduch, 2010). With the target to involve the poor for a better quality life, the concept of financial inclusion becomes crucial to implement.
Financial inclusion needs to be supported by the empirical analysis on how to measure financial inclusion in aggregate economic indicators. Furthermore, it would increase the participation of poor people in economic growth and finally create inclusive growth. To do this, the Indonesian database on financial inclusion can help build local statistical capacity. Besides, the comparability of financial inclusion indicators can be increased across economies and over time.
From the proportion of 3 dimensions of IFI, the accessibility dimension has the highest value, followed by availability and usage. This results indicate that financial inclusion in Indonesia is dominantly determined by the dimension of accessibility and other dimensions (availability and usage) only have small proportion. In many provinces, the proportion of poor adults could have high accessibility to the financial system, but they do not use them enough due to remoteness of bank branches or other physical or psychological barriers. Literatures have emphasized that those services is not utilized adequately, even the people have access to financial services (Sarma, 2012).
Figure 6 presents the IFI values from 33 provinces in Indonesia at the end of period. In brief, levels of provinces are divided into three categories as measured by IFI: (i) low IFI provinces for those having IFI values less than 0.3; (ii) medium IFI provinces for those having IFI values between 0.3 and 0.6; and (iii) high IFI provinces for those having IFI values between 0.6 and 1 (Sarma, 2012).
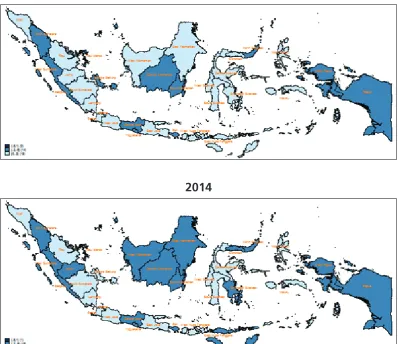
Figure 6. IFI Values across Provinces in Indonesia
� �� �� �� �� �� �� �� ��
���������������������������������
������� ���� ���������� ��������������� ���������� ������������ �������� ��������������� �������������� ����� ������������ ��������� ������������� ������������������ ������������������ ���������������� �������������� ������������������ ����� ���� ���������������� ������������ ������ ��������������� ��������� �������������� �������������� ���� ������������� ������� ������������������ ������ ���������
The result shows that Jakarta have been categorized as the high IFI province by 0.704 in 2014. During the period, Jakarta have placed the first rank with the high IFI value (above 0.6), except in the year 2008 (0.544). The medium IFI provinces are represented by Bali, Yogyakarta and East Kalimantan. On the contrary, the lowest rank of IFI have been placed by West Java, Maluku, West Nusa Tenggara, Lampung and West Sulawesi.
As indicated in the averaged IFI values of Indonesia (0317), the country has been placed in the medium category during the period. As shown in Figure 7, majority of provinces in Indonesia is categorized as medium IFI provinces in 2014. Those who consistently having medium IFI values in 2008 and 2014 are Yogyakarta, Central Java, North Sumatera, West Sumatera, Bengkulu, South Kalimantan, Bali, West Papua and Papua. A second set of group reflects the provinces with the unchanged low IFI in 2008 and 2014 which represented by eastern provinces – Southeast Sulawesi, West Nusa Tenggara and Maluku.
While there is broad agreement on the basic policies that are important for inclusiveness and poverty alleviation, the recent literature has identified the relationship between financial inclusion and development (Sarma, 2008). Some of key determinants of development proposed in the literature have been related with better financial sector. As the most widely
2008
2014
used development index, the Human Development Index (HDI) represents the best indicator of development to be associated with the level of financial inclusion. The scatter plot between IFI and HDI provides a tool to analyze the relationship of inclusiveness in finance to development (Figure 8).
Figure 8. Scatter Plot of IFI and HDI
.7
.6
.5
.4
Papua
.3
.2
65 70 75 80
Index of Financial Inclusion
Human Development Index
West Nusa Tenggara North Maluku Southeast Sulawesi East Nusa Tenggara
West Papua West Kalimantan
Bali
Central Java
West SumateraRiau Islands East Kalimantan Yogyakarta
North Sumatera Bengkulu
North Sulawesi Riau Jambi
Bangka Belitung South Sumatera
Central Kalimantan
West Java East Java Aceh Lampung
Central Sulawesi Gorontalo
Sout Kalimantan Banten Maluku
West Sulawesi South Sulawesi
Jakarta
4.2. Inclusive Growth
The mere growth is not sufficient to ensure that the poor as marginalized groups are involved in. Hence, an approach to reducing inequality has generated the term in inclusive growth. To measure inclusive growth, the study uses the proposed method of Ali and Son
(2007), then combine with Anand, et al. (2013).
Following Ali and Son (2007), the social opportunity function focuses on assessing access to educational and health services. The growth can be inclusive if it increases average
opportunities available to the population (y) and the distribution of opportunities (w). By taking
the Indonesian case, there are four possible scenarios on inclusiveness matrix while plotting the extent of inclusive growth (Table 2).
Table 2. Inclusiveness Matrix
Quadrant Condition The Extent of Inclusiveness
I d y > 0 and dw > 0 Unambiguously Inclusive
II d y > 0 and dw < 0 Higher average opportunities available to the
population at the expense of opportunities distribution (dy>dw) III d y < 0 and dw < 0 Unambiguously non-inclusive
IV d y < 0 and dw > 0 The equity distribution of opportunities is achieved at the cost of average opportunities contraction
Figure 9 shows distribution map of the inclusiveness level for 33 provinces in 2014. The
result shows a downward trend, meaning that there could be a trade-off between dy and dw.
If the first term is positive, the second term may negative and vice versa. There are 11 provinces has placed the second quadrant such as South Kalimantan, Aceh, Banten, Riau, and Bali. These regions presents the higher changes of available social opportunity occur with the expense of
its distribution. The sign of dw < 0 means that the opportunities has been utilized increasingly
A similar results is shown in Figure 10 that concludes the inclusiveness level ( ) for the
changes on the two elements ( y and w). The yellow bars represent the growth of opportunities,
while the green bars represents the growth of opportunity distribution. The inclusive growth
occurs if the degree of inclusiveness ( ) is positive.
In here, some provinces that successfully achieve inclusive growth are Central Java, West Sumatera, Maluku, South Kalimantan, West Java, Bali, Banten and Central Kalimantan. In Maluku, inclusive growth is determined by a higher contribution from distribution of opportunity. The increased opportunities for the poor could also fully enhance inclusive growth in Riau, Banten, Southeast Sulawesi, Bali and South Kalimantan. For other provinces, the equity objective could be achieved at the cost of foregone average opportunity, such as Jakarta, Bangka Belitung, North Sumatera, North Maluku, West Papua, and Papua
Figure 9. Distribution of Indonesian Provinces on Inclusiveness Matrix
.04
.02
0
-.02
-.04
Change of average level of opportunity
Change of equity index of opportunity -.06
-1.50 -1.00
Riau Islands
-1.50 0.00 0.50 1.00
Jambi
Gorontalo East Kalimantan
West Sulawesi Aceh South Kalimantan
Bali Riau
South Sulawesi West Java Cebtral Java West Sumatera
East Nusa Tenggara
Papua North Maluku
Bengkulu
Bangka Belitung
Jakarta North Sumatera
West Papua Maluku West Nusa Tenggara Central Sulawesi
East Java West Kalimantan Banten
Central Kalimantan North Sulawesi
Southeast Sulawesi Lampung
Figure 10. Decomposition of Inclusive Growth
While the Ali and Son (2007) does not arise the pattern of income growth, we attempts to involve the indicator of income in here. To complement this shortcoming, the study also
develops the indifference curves proposed by Anand, et al. (2013). The slope of indifference
curve may be helpful in examining the extent to which growth are distributed equitably or not.
Economic growth shifted the indifference curve upward (Anand. et al., 2013)
Figure 11. Indifference Curves for Selected Provinces 8000 6000 4000 2000 0
0 10 20 30 40 2008
2014
50 60 70 80 90 100
Income percapita (IDR 000)
Jakarta
Population share (%)
2008 2014 5000 4000 3000 2000 1000 0
0 10 20 30 40 50 60 70 80 90 100
Income percapita (IDR 000)
Bali
Population share (%)
2008 2014 2500 2000 1500 1000 500 0
0 10 20 30 40 50 60 70 80 90 100
Income percapita (IDR 000)
Aceh
Population share (%)
2008 2014 2500 2000 1500 1000 500 0
0 10 20 30 40 50 60 70 80 90 100
Income percapita (IDR 000)
Maluku
Population share (%)
2008 2014 4000 3000 1000 2000 0
0 10 20 30 40 50 60 70 80 90 100
Income percapita (IDR 000)
West Papua
Population share (%)
2008 2014 5000 4000 1000 2000 3000 0
0 10 20 30 40 50 60 70 80 90 100
Income percapita (IDR 000)
East Kalimantan
To see the relationship of financial inclusion and inclusive growth, the study presents a plotted data of IFI and IIG across economies and over time (Figure 12). Since the degree of inclusive growth needs a previous analytical year, the year of 2008 is excluded. The result shows a positive slope for IFI and IIG. It is presumed that there is a positive correlation between IFI and IIG. The improvement in financial inclusiveness could positively encourage a sustained and inclusive growth. At the end, the objective of poverty alleviation could be achieved.
3 We leave this for the future research.
Figure 12. Relationship between IFI and HDI
The above calculations may contribute on providing clear description about the financial inclusion and the inclusive growth across provinces in Indonesia. However, this paper does not
attempt to explain what determines these conditions3. We believe the fundamental characteristic
V. CONCLUSION
This study is a humble attempt to serve an important tool for benchmarking and for motivating policy makers to embrace the inclusiveness in finance and economy. To implement these concepts, computing of Financial Inclusion (IFI) and Index of Inclusive Growth (IIG) is needed across 33 provinces comparison. Firstly, IFI is built from dimensions of accessibility, availability of the banking service and usage of banking system. To better address the further measurement of financial inclusion, this study tries to quantify and focus on the poor as the main objective of financial inclusiveness.
The result shows that the country has been placed in the medium category during the period. In general, financial inclusion in Indonesia is dominantly determined by the dimension of accessibility and other dimensions (availability and usage) only have small proportion, meaning that the group of poor people is not fully optimized to use formal financial services, in particular, as primary sources of credit. Thus, the policy makers need to improve the availability and usage of financial services at affordable price in particular for the poor.
Secondly, the inclusive growth is measured following the social opportunity function. Through an access to educational and health services, each province has their own characteristics in building the extent of inclusiveness. There is a preliminary result that there is a positive correlation between IFI and IIG. The study emphasizes the important role for the stakeholders to help build a gate linking financial inclusion to inclusive growth by making it possible to involve the population excluded from financial and economic sectors.
REFERENCES
Ali, I. (2007). Pro-Poor to Inclusive Growth: Asian Prescriptions. ERD Policy Brief, No.48.
Ali, I. and J. Zhuang. (2007). Inclusive Growth toward a Prosperous Asia: Policy Implications.
ERD Working Paper Series, No.97.
Ali, I. and H. H. Son. 2007. Measuring Inclusive Growth. Asian Development Review, Vol. 24, No.1, p.11–31.
Armendariz, B. and J. Morduch. (2010). The Economics of Microfinance. 2nd Edition. London:
The MIT Press.
Asian Development Bank (ADB). (2011). Key Indicators for Asia and the Pasific 2011: Framework
for Inclusive Growth Indicators, Special Supplement. Manila: ADB.
Bank Indonesia. (2014). Booklet Financial Inclusion. Jakarta: Bank Indonesia.
Demirgüç-Kunt, A., T. Beck and P. Honohan. (2008). Finance for All? Policies and Pitfalls in Expanding Access. Washington D.C.: A World Bank Policy Research Report.
Demirgüç-Kunt, A. and L. Klapper. (2012). Measuring Financial Inclusion: The Global Findex
Database. Policy Research Working Paper, 6025.
Ferreira, F. and J. Gignoux. 2008. The measurement of inequality of opportunity. World Bank
Policy Research Working Paper, 4659.
Kelkar, V. (2010). Financial Inclusion for Inclusive Growth. 39(1): 55–68.
Klasen, S. (2010). Measuring and Monitoring Inclusive Growth: Multiple Definitions, Open
Questions, and Some Constructive Proposals. ADB Sustainable Development Working
Paper Series, No.12.
Kraay, A. (2004). When is Growth Pro-Poor: Cross Country Evidence. IMF Working Paper.
Krislock, N., & Wolkowicz, H. (2010). Euclidean Distance Matrices and Applications. EDM dan
SDP/CORR.
Leyshon, A., & Thrift, N. (1995). Geographies of Financial Exclusion: Financial Abandonment in
Britain and the United States. JSTOR, New Series, Vol. 20, No. 3 , 312-241.
Rangarajan Committee. (2008). Report of the Committee on Financial Inclusion, Government of India.
Ravallion, M., & Chen, S. (2002). Measuring pro-poor growth. Elsevier, 93-99.
Rosengard, J. K., & Prasetyantoko, A. (2011). Regulatory Constraints to Financial Inclusion in
Reyes, G. P. (2010). Financial Inclusion Indicators for Developing Countries: The Peruvian Case. Peru: Superintendency of Banking.
Robinson, M.S. (2001). The Microfinance Revolution: Sustainable Finance for the Poor.
Washington: The World Bank.
Sarma, M. (2008). Index of Financial Inclusion. ICRIER Working Paper, 215.
Sarma, M., and J. Pais. (2008). Financial Inclusion and Development: A Cross Country Analysis.
Paper. Presented at the Conference on Equality, Inclusion and Human Development organized by HDCA and IHD, New Delhi.
Sarma, M. (2012). Index of Financial Inclusion – A measure of financial sector inclusiveness.
Berlin Working Papers on Money, Finance, Trade and Development, No.7, p.1-34.
Sinclair, S. (2001). Financial Exclusion: An Introductory Survey. Edinburgh: CRSIS/Heriot-Watt University.
The Institute of Statistical Mathematics (ISM) and Statistical Information Institute for Consulting
and Analysis (SINFONICA). Edited by H. Furuta. (2014). SUSENAS – Overall and Survey
Process. Jakarta.
United Nations (UN). (2015). Economic and Social Survey of Asia and The Pacific 2015:
Making Growth More Inclusive for Sustainable Development. Bangkok: United Nations Publication.
Zhuang, J. and I. Ali. (2011). Poverty, Inequality, and Inclusive Growth in Asia. London: Anthem