*Corresponding author: A.Etemadi, Faculty of Engineering, The University of Guilan- Guilan, Iran. Email: arminetemadi @msc.guilan.ac.ir;
1.
Introduction
Today, concerns of the environmental and energy crisis, which are due to the rising energy demands, especially in developing countries, result in more attention to the alternative energy conversion methods, e.g. the wind turbines,
geothermal energy, photovoltaic, fuel cells and etc. the Fuel cells, as a promising technology to produce the clean power based on renewable energy resources, have attracted researchers to explore the various aspects of its technology in order to develop it as a feasible and reliable power generation method. The Fuel cells are
The Numerical analysis of an anode-supported high temperature
DIR-PSOFC operating conditions with considering the maximum allowable
temperature difference
Armin Etemadi
*1, Saba Ghorbani
1, Mehdi Masoumpour
1, Mostafa Dadkhah
1, Kazem
Atashkari
11Faculty of Engineering, The University of Guilan- Guilan, Iran
Journal of Heat and Mass Transfer Research
Journal homepage: http://jhmtr.journals.semnan.ac.ir
A B S T R A C T
In the present study, the operating conditions of an anode-supported high temperature direct internal reforming (DIR) planar solid oxide fuel cell (SOFC) are numerically analyzed. SOFCs are the energy conversion devices that produce electricity and heat directly from a gaseous fuel by the electrochemical combination of that fuel with an oxidant. A planar SOFC consists of an interconnect structure and a three-layer region often referred to as the PEN (Positive electrode/Electrolyte/Negative electrode) composed of two ceramic electrodes, anode and cathode, separated by a dense ceramic electrolyte. A 1D mathematical model based on the species and the energy balances is conducted to investigate the concentration of the gas components in the channels and the cell temperature distribution in both solid structures and gas channels. In addition, the electrochemical model of the cell is applied to determine its performance parameters. A synthesis gas with 10% pre-reformed methane as fuel stream is fed to the cell and the water-gas shift, the methane-steam reforming and the electrochemical reactions are considered as mass and heat sources/sinks. The effects of the air ratio and the fuel utilization factor on the temperature field and the performance of the cell are examined through parametric analysis to determine the optimum operating conditions of the cell. The investigations are performed to ensure no cracking will occur due to cell crucial temperature difference. The results indicate that increasing the fuel utilization factor from 0.45 to 0.85 leads to increase the value of the maximum temperature difference across the PEN layer from 101K to 145K while it decreases from 177K to 124K by increasing the air ratio from 6.5 to 12.5. In order to achieve the maximum power density by considering the maximum allowable temperature difference across the cell, the value of the fuel utilization factor and the air ratio are obtained 0.85 and 9, respectively.
© 2015 Published by Semnan University Press. All rights reserved. PAPER INFO
History:
Received 8 February 2014 Received in revised form 24 April 2014
Accepted 27 September 2015
Keywords: Numerical Analysis Fuel cell
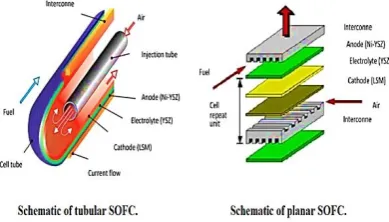
electrochemical devices that produce electricity via electrochemical reactions between fuel and air flows without occurring any combustion and related exergy destructions. Among different types of fuel cells, Solid Oxide Fuel Cell, due to its high operating temperature and capability to work with a wide variety of fuels, appears to be the most appropriate one for power generation purposes, whether using in distributed power generation systems or combining with conventional power plant cycles to improve their efficiencies. From the geometric viewpoint, there are two main types of SOFCs: tubular and planar which are presented in Fig.1. It is necessary to do theoretical investigations where sealing problems and cracking of the solid structure which are due to the high temperature gradients and consequent thermal stresses particularly in power demand fluctuations are probable. Thus, detailed numerical simulations are necessary in order to illuminate the effect of the physical or chemical phenomena that occurring in the gas channels of the Planar SOFCs (PSOFC).
Figure 1. Schematic of tubular and planar SOFCs.
In 1994, Achenbach [1] proposed a three dimensional dynamic modeling of a planar SOFC stack with taking into account the radiation heat transfer mechanism. Moreover, anode gas recycling has also been considered and results indicated the higher plant efficiency and more uniform current density distribution. Ferguson et al [2] investigated the effect of gas channels flow configuration on the planar SOFC performance through a three dimensional modeling. A quasi-two and three dimensional simulation was done by Iwata et al [3] on the mass, the heat and charge transfer in a planar SOFC. Results show an increasing the cell temperature which is due to the fact that increasing the cell power can be controlled by increasing of the operating pressure. Yakabe et al [4] made a computational analysis on momentum and heat transfer of a planar SOFC unit by using syngas as fuel in two cases of external and internal reforming of methane. Their results demonstrated that the internal reforming reaction causes a drop in
In the current study, the gaseous components and the temperature distribution of one cell of a
planar anode supported high temperature SOFC is
Table .1. Reactions considered in the mass and energy balances and rate of them
Reactions Rate of reactions
Steam reforming reaction CH4H O2 CO3H2 . 4.exp( ) r
R r CH
kj PEN
E
r z P
R T
Water-gas shift reaction COH O2 CO2H2
2 2 2
,
( . ) / ( . )
(1 CO H CO H O )
CO S
ref eq s
P P P P
P r
P K
Hydrogen oxidation reaction H2 O2 H O2 2e
Oxygen reduction reaction 2
2
1 2
2O e O
Overall cell reaction 2 2 2
1 2
H O H O
2 elec j r F
numerically investigated. The governing equations including mass fractions for the fuel and air flow in gas channels and also energy balances in the domain are solved numerically along with the appropriate boundary conditions by using a numerical procedure through a code using MATLAB in order to determine the mass fractions and the temperature distribution in the gas channels and solid structures. The main advantage of the present work is that the thermal conductivity of the fuel and air components are function of their temperature in gas channels and are not considered to be constant. In order to prevent the emergence of severe thermal gradient and to find out optimal operating condition, the effects of the SOFC operating conditions on the temperature field during the cell are investigated.
2.
Mathematical model
In this study, 1D steady-state solid oxide fuel cell has been developed. A complete solid oxide fuel cell is not only consisting of a single cell, but also the several cells, which are connected both in series and/or in parallel. The developed model includes the mass, thermal and electrochemical analysis, as well as the kinetic models of hydrocarbon reactions. Also the pressure drop along the cell channel is assumed to be zero [6].
For the purpose of modeling, it is considered that the SOFC is composed of the fuel and air channels and of the electrochemical region represented by anode, electrolyte, and cathode. The air which has been comprised of
O
2andN
2 is considered as cathode channel reactant and 10% pre-reformed methane with steam to carbon 2 is considered as fuel for anode channel. Two types of chemical reactions (methane reforming and water - gas shift reaction) occur at the anode while the cells are supplied with the natural gas because the cell operating temperature was sufficiently high [12].Table 1 presents the cell reactions and the rate of them.
2.1.Mass balance
Both air and fuel flows are assumed to be steady and laminar. The Molar fluxes in the gas channels are considered to be convective in flow direction and the gas flow in the same direction. Mass balances are derived in plug-flow form along the longitudinal direction, because of high Peclet numbers [6]. By Applying the Faraday’s law, the rates of the electrochemical reactions are related to the electric current [1] which can be expressed by:
2 elec j r F (1)
Steam reforming and water-gas shift reactions occur on the anode surface. The reaction rates for steam reforming and water-gas shift reactions are calculated from Achenbach [1] and Aguiar [6]
4
( ).exp( r )
R r CH
kj PEN E r z P
R T
(2)
2 2 2
,
( . ) / ( . )
( CO ).(1 CO H CO H O )
S
ref eq s
P P P P
P
r P
K
(3)
where Zr 4 2 7 4
2
/ ( . . )
mol bar m s, 4
8 . 2 1 0
r
E kj/k molandKeq s, is the equilibrium constant for shift reaction which is expressed by
2 2 2
0 0 0 0
, exp( )
H CO CO H O
eq s
kj PEN
g g g g
K
R T
(4)
The mass balance equation for air channel can be written as
2 . 2
O e l e c O
a c a c r M V x h (5)
And for the fuel channel can be written as ,
( i k k). i i fc fc r M V x h
4 2 2 2
{ , , , , }
i CH H O CO H CO
,
{
,
, }
k
elec R S
Where i k, is the stoichiometry coefficient of
component i in reaction k. And the boundary conditions are
2
4 2 2 2
0 O in , { , , , , }
i in
x i CH H O CO H CO
(7)
2.2.Energy balance
In a fuel cell, the current and temperature distributions are strongly coupled. Therefore, knowledge of the predominant heat transfer processes is required. Heat transfer processes include heat release from electrochemical reactions, electrical resistances, convective heat transfer between cell components and fuel and air gas streams, heat conduction through cell components and radiation between solid parts.
Energy balance has to be established for the fuel and air flows and the solid structure separately. It is assumed that all reaction enthalpies are released at the electrode/electrolyte interfaces or at three phase boundaries (TPB). Therefore, the reaction enthalpies appear in the source terms of the solid structure balances.
The energy balances for the gas flows include the convective heat transfer from channel walls to the gas and heat capacity of the gases with respect to their composition. Thermal flux in the PEN and interconnector structures is conductive. And due to the high temperatures, radiation heat transfer between PEN and interconnect structures is taken into account. It is assumed that the cell is in the center of a stack, so there is no heat transfer through the external walls. Thus the energy balances are calculated through Eqs. (8)–(11). Air channel
, ,int int
1 1
( ) ( )
a
ac a a a PEN PEN a a a
ac ac
T
V Cp h T T h T T
x h h
(8)
Fuel channel
,
, int int
1
( )
1 1 1
( )
R S
f
fc f f f PEN PEN f fc
R S
fc fc fc
f f
T
V Cp h T T
x h
h T T r H r H
h h h
(9) PEN structure (10) 2 , , 2
4 4 4 4
, int int , int int
1 1 ( ) ( ) 1 1 ( ) ( ) 1 ( ) PEN
PEN f PEN PEN f a PEN PEN a
PEN PEN
ct ct PEN an an PEN
PEN PEN
avg elec elec PEN
T
K h T T h T T
x t t
F T T F T T
t t
j E r H
t Interconnector 2 int
int 2 , int int , int int
int int
4 4
, int int
int
4 4
, int int
int 1 1 ( ) ( ) 1 ( ) 1 ( )
f f a a
ct ct PEN
an an PEN T
K h T T h T T
x t t
F T T
t
F T T
t (11)
And the boundary conditions are written as
0 a in
f in T T x T T (12) int 0 0, 0 PEN T x
x x L
T x (13)
Heat transfer coefficients between gas channels and solid structures were calculated by using a constant Nusselt number of 3.09 [6] and the channel hydraulic diameter. Therefore, these coefficients are expressed by
, , int
,
air ac PEN ac
H ac K
h h Nu
D
,
2 a c
H a c
a c W h D W h (14) ,
2 f c
H f c
fc W h D W h , ,int , fuel
fc PEN fc
H fc
K
h h Nu
D
(15)
Where
K
air andK
fuelare the thermal2.3.Electrochemical model
The reversible output voltage of the SOFC is expressed by the Nernst equation [1] as a function of the Gibbs free energy change during electrochemical reaction. This is called open circuit voltage of the cell:
2 2
2
1 2
0 .
Δ
2 2
H O OC P
H O
P P
G RT
E ln
F F P
(16)
where
ΔG
0 is the Gibbs free energy change from reactants to products (J mol
.
1), F=96485.3 is the Faraday constant (C mol
.
1), R=8.314 is the universal gas contact (J mol
.
1.
K
1), T is the electrochemical reaction temperature (K
) and2 H
P
,2 O
P
and2 H O
P
are the reacting gas pressures (atm
) of hydrogen, oxygen and vapor, respectively.ΔG
0Is expressed by:2 2 2
0 0 0 1 0
Δ ( )
2
H O H O
G G G G (17)
0 0 0
.
specie pecie pecie
G H T S
(18)
Where 2 0
H O
G
,2 0
H
G
and2 0
O
G
are the Gibbs freeenergy (
J mol
.
1) of vapor, hydrogen and oxygen respectively.H
0pecieis the corresponding enthalpy (1
.
J mol
) andS
0pecie is the corresponding entropy (J mol
.
1.
K
1). The gas enthalpy and entropy is calculated by referring to the JANAF Table [13]. Reversible voltage is the maximum potential that can be produced by a cell under specific operating conditions. Actually, the output voltage of the cell, due to over potentials, is lower than the reversible voltage and can be calculated from Eq. (19):
, ,
, ,
(
)
O C P
o h m
c o n c a n o d e c o n c c a t h o d e a c t a n o d e a c t c a t h o d e
E E
(19)
Where
ohmis ohmic loss and
conc anode, ,,
conc cathode
,
act anode, and
act cathode, are the anode and cathode concentration and activation overpotential losses, respectively.2.4.Overpotentials
Ohmic, concentration and activation overpotentials are the three types of losses that occur during the operation of the cell. Definitely, the ohmic loss is defined as the resistance of the cell solid structures against the conduction of ions and electrons which is expressed by:
ohm
jR
ohm
(20)Where j is the current density and
R
ohm is the internal resistance of the cell, which contains electronic and ionic resistances.R
ohmis written asa n o d e c a t h o d e o h m
a n o d e c a t h o d e e l e c t r o l y t e
e l e c t r o l y t e
R
(21)
Where
anode,
cathode and
electrolyte are thickness of anode, cathode and electrolyte, respectively. Also
anodeand
cathode are electronic conductivities of the anode and cathode, and
electrolyteis ionic conductivity of the electrolyte [6].Concentration overpotential is the other loss in the cell performance, which is produced due to the difference between species partial pressures in the channel flow and three phase boundary (TPB). In order to occurring electrochemical reaction that occurs on the TPB, the gaseous species must diffuse through porous electrodes which called Knudsen diffusion. In addition, each species should diffuse through the other species via bulk diffusion. Due to these facts, the values of the local concentration species on the TPB differ with their values in the bulk fuel flow and, consequently, the species partial pressures in the Nernst Equation should be rewritten for TPB which expressed in Eq. (22).
0 2
1 2
2 2
, 2
, . ,
2 O C P
T P B H
H O
H O T P B
T P B T P B
E E
P P
R T l n
F P
(22)
2 2 2 2 2 2 , , , , , , . . 2 4 fuelchannel TPB airchannel TPB H O TPB H conc
H O fuelchannel H O
O
P P
RT ln
F P P
P RT ln F P (23)
Where, the first and the second terms on the right hand side are anodic and cathodic concentration overpotentials, respectively.
Partial pressure of water, hydrogen and oxygen at the three- phase boundary can be calculated by
2, 2,
,
2
H T P B H f u e l c h a n n e l
a n o d e
e f f a n o d e
P P R T j F D (24)
2 , 2 ,
,
2
H O T P B H O f u e l c h a n n e l
a n o d e
e f f a n o d e
P P R T j F D (25)
2, 2,
,
( )
e x p ( )
2
O T P B O a i r c h a n n e l
c a t h o d e
e f f c a t h o d e
P P P P
R T
j
F D P
(26)
Where
D
eff anode, andD
eff cathode, are average effective diffusivity coefficients at anode and cathode, respectively andD
eff is written as2 2 2 2
, ,
i {H , H , O , N }
p
eff i molecular i tortuosity
O
D D
(27)
p
is the material porosity and
tortuosity istortuosity factor.
D
molecular i, is expressed by2 2 2 2
, , ,
i {H , H , O , N }
1 1 1
=
molecular i bulk i knudsen i
O
D D D
(28)
Bulk diffusivity,
D
bulk i, is caused by fluid–fluid intermolecular collisions as considered by the kinetic theory of gases. Knudsen diffusivity,
knudsen i
D
is the result of fluid-wall collisions, when the pore size is so small that it is less than the mean path of the fluid.Activation overpotential is extra potential necessary to defeat the energy barrier and transfer an electron between electronic the ionic conductors. This overpotential reflects the kinetics involved with the electrochemical reactions.
The activation overpotential is expressed by the Butler-Volmer equation 0, , , { , } [exp( ) (1 ) exp( )]
electrode act electrode
act electrode
electrode anode cathode nF j j RT nF RT (29)
Where
is the transfer coefficient (usually
=0.5) [9], n is the number of electrons participating in electrochemical reaction and
j
0,electrode is the exchange current density, expressed as0 ,
{ , }
e x p ( e l e c t r o d e )
e l e c t r o d e e l e c t r o d e
e l e c t r o d e a n o d e c a t h o d e E R T R T j k n F (30)
Where kelectrode and Eelectrode values are presented in the Table 2.
3. Result and discussion
The anode supported design is the most favorable one for SOFC [14], therefore this study is carried out on an anode support solid oxide fuel cell with internal reformer. In order to verify the results, the obtained results are compared with the data from Aguiar[6] which is represented in table 4. Gas composition and temperature profile of each layer show s an acceptable agreement with Aguiar’s results. The comparison between Aguiar’s results and the present work with constant thermal conductivity is presented in Fig.2. Range of parameters involved in this modeling and default values of geometry and operating condition of fuel cell are given in table 3.
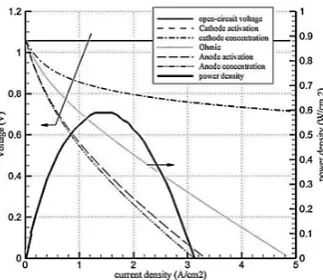
The simulated results of current-voltage characteristic are shown in Fig.3. As it can be seen, the cathode activation overpotential has a significant magnitude in comparison with other overpotentials. Anode activation overpotential and ohmic loss are the next reasons causing the voltage drop.
Also, these results show that the amount of over potential decreases by increasing the work temperature. At 973K, overpotential contribution will be increased to 9.3%.
Table2. Data for exchange current density equation
k E
Cathode 11 1 2
2.35 10 m
137
KJ mol
1Anode 11 1 2
6.54 10
m
140
KJ mol
1Figure 2. Comparison of Aguiar’s result and present work for (a) Mole fraction of fuel components and (b)
PEN temperature
Figure 3. Cell voltage and power density as a function of current density at1023K for a totally reformed fuel
mixture
Table3. the operating and geometrical parameters used in the mathematical model
Geometrical
parameter Value
Operating
parameter Value
Cell length (m) 0.4 Air and fuel input
temperature (˚K) 1024
Cell width (m) 0.1 Air and fuel input
pressure (bar) 1
Fuel and air
channel height
(mm)
1 Average current
density (A/cm2) 0.5
Anode thickness
(µm) 500 air ratio 8.5
cathode thickness
(µm) 50 Fuel utilization 75%
electrolyte
thickness (µm) 50 steam / carbon 2.
interconnect
thickness (µm) 500 pre reforming rate 10%
3.1. Gas composition and temperature
distribution
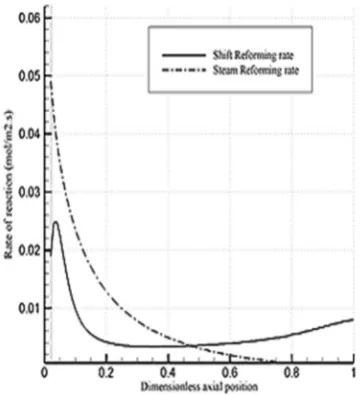
Fig.5 illustrates temperature curves of each layer along fuel cell length. The Cell temperature falls steadily in the initial part of a fuel cell as a result of the sharply endothermic reforming reaction, as expected. In Fig.6, distributions of reforming and shift reaction rates are shown. It can be seen that by reducing the influence of reforming reaction, the temperature will raise over the cell.
concentration near the outlet reduces and the concentration of water will be increased.
3.2. Effect of air ratio
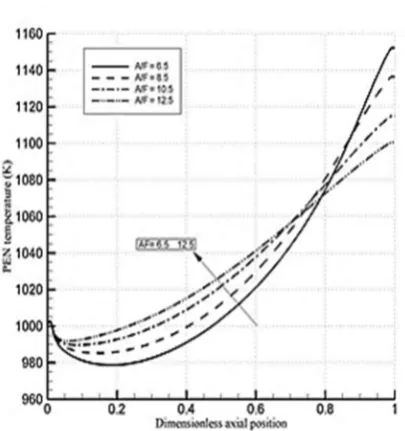
The Air ratio is one of the most effective parameters for controlling the cell temperature and preventing the occurrence of a temperature gradient. The Inlet air flow rate is adjusted to keep maximum temperature difference across the fuel cell lower than 150K [15]. Values of the maximum PEN temperature difference in the air ratio between 6.5 and 12.5 are presented in Table 5
.
Figs. 8 and 9 show the effect of this parameter on the temperature and local current density distribution across the cell. Increasing of the air ratio will decrease the temperature difference throughout the channel and current density distribution becomes more uniform. But it should be considered that at high pressure, increase in the work of the compressor and the cycle efficiency will eventually come down. Hence it is necessary to choose it carefully.
Figure 4. The Magnitude of overpotential in the fuel cell at three operating temperatures: 973, 1023 and 1073
Table4. The comparison results obtained with Aguiar [6]
Parameter Aguiar [2] Present
Output voltage (V) 0.66 0.65
PEN temperature (˚K) min
max
980 1134
985 1138 Fuel Channel temperature
(˚K) min max
970 1127
981 1135 Interconnect temperature
(˚K) min max
976 1120
983 1131 Local current density
(A/m2) min max
2385 9385
2751 8517
Table 5. PEN temperature difference for SOFC model of Figs 2 and 3
Air ratio
temperature
difference(˚K)
6.5
177.8
8.5
154.1
10.5
127.2
12.5
110.1
Figure 5. Fuel and air channels, PEN structure, and interconnect temperature along the cell length for the
conditions in Table 2
Figure 8. The Effect of air ratio on the PEN temperature curves
Figure 9. The Effect of air ratio on the local current density
3.3. Effect of fuel utilization factor
Figs 10 and 11 illustrate the effect of changing fuel utilization. Fuel utilization factor is the ratio of fuel consumed to produce electricity to the total amount of inlet fuel. Fig 8 presents the PEN temperature profile along the cell. It indicates that temperature will rise gradually with increase of the utilization factor. As a result of increasing temperature, the activation loss (that causes major losses in the fuel cell) will be reduced. Thus, the
operating voltage and subsequently power density will be increased.
In general, by increasing this parameter power density will be increased, but the excessive increase of fuel utilization factor causes reduction in the amount of hydrogen in the terminal of cell and consequently the concentration over potential will be increased. Also in high fuel utilization, the temperature difference is higher due to unbalanced current density distribution in the cell.
4. Conclusions
In this study, an anode-supported high-temperature DIR-SOFC fed by 10% pre-reformed methane is studied. This model considers the mass transport and heat transfer, over potentials and ohmic loss which the heat transfer process is based on the exothermic and endothermic reactions occurring in fuel channel. The model can effectively predict the distribution of each layer temperature curve, current density and gas molar fraction along the channels.
A parametric analysis was performed to investigate the effects of some operational parameters on temperature difference across the cell. The investigations indicate that the temperature difference grows from 101K to 145K by increasing the fuel utilization factor from 0.45 to 0.85 and deduces from 177K to 124K by increasing the air ratio from 6.5 to 12.5. Because of the fact that the cell power density can dwindled by increasing the anode activation loss which itselfis temperature dependent, the maximum power density by considering the maximum allowable cell temperature difference is considered as objective and the values of the fuel utilization factor and air ratio are obtained 0.85 and 9, respectively.
PEN temperature curves
Figure 11. The Effect of fuel utilization factor on the operating voltage and open-circuit potential
Nomenclature
C p specific heat capacity (kJ kg
−1 K−1)
H
D hydraulic diameter of a rectangular cross section gas channel
(m)
bulk
D bulk diffusivity coefficient (m2 s-1) eff
D effective diffusivity coefficient (m2 s-1)
knudsen
D molecular diffusivity coefficient (m2 s-1) molecular
D Knudsen diffusivity coefficient (m2 s-1)
E Potential (V)
OCP
E open-circuit potential (V)
electrode
E activation energy of the exchange current density (kJ mol−1)
F Faraday’s constant (C mol−1)
ac
h
air channel height (m)fc
h
fuel channel height (m)ct
h heat transfer coefficient for cathode (kJmK−1) −2 s−1
an
h heat transfer coefficient for anode (kJm −2 s−1 K−1)
j local current density (Am−2)
avg
j average current density (Am−2)
0,electrode
j exchange current density (Am−2)
K thermal conductivity (kJm
−1 s−1 K−1)
electrode
k
pre-exponential factor of the exchange current density (Am−2)n
number of electrons participating in the electrochemical reactionNu Nusselt number
P pressure (Pa)
i
P partial pressure of component i (Pa)
,
i TPB
P partial pressure of component i at
three phase boundary (Pa)
i
r
rate of reaction i (molm
−2 s−1) kj
R gas constant (kJ mol
−1 K−1)
ohm
R total cell resistance, including both ionic and electronic resistances
(Ωm2)
T temperature (K)
ac
V
air velocity (ms−1)fc
V
fuel velocity (ms−1)W system width (m)
transfer coefficientelec
H
enthalpy change of the electrochemical reaction (kJ mol−1) p
electrode porosity
Stefan–Boltzmann constant (Wm−2K−4) anode
electronic conductivity of the anode (Ω−1 m−1)cathode
electronic conductivity of the cathode (Ω−1 m−1)electrolyte
ionic conductivity of theelectrolyte (Ω
−1 m−1)
Density (kgm−3)
thickness (m)tortuosity
TortuosityReferences
[1] Achenbach, E., Three-dimensional and
time-dependent simulation of a planar solid oxide fuelcell stack. J Power Sources, 49 (1994) 333–48.
[2] Ferguson, J.R., Fiard, J.M., Herbin, R.,
Three-dimensional numerical simulation for
variousgeometries of solid oxide fuel cells. J Power Sources 58 (1996) 109–22.
[3] Iwata, M., Hikosaka, T., Morita, M., Iwanari, T., Ito, K., Onda, K., et al., Performance analysis of planar-type unit SOFC considering current and temperature distributions, Solid State Ionics, 132 (2000) 297-308.
[4] Yakabe, H., Ogiwara, T., Hishinuma, M., Yasuda, I., 3-D model calculation for planar SOFC. J Power Sources, 102 (2001) 144–54.
[5] Aguiar, P., Chadwick, D., Kershenbaum, L.,
Modeling of an indirect internal reforming solid oxide fuel cell, Chem. Eng. Sci. 57 (2002)1665– 1677.
[6] Aguiar, P., Adjiman, C.S., Brandon, N.P., Anode-supported high temperature direct internal reforming solid oxide fuel cell. I: modelbased steady-state performance. J Power Sources, 138 (2004) 120–36.
[7] Aguiar, P., Adjiman, C.S., Brandon, N.P., Anode-supported high temperature direct internal reforming solid oxide fuel cell: II. Modelbased dynamic performance and control. JPower Sources, 147 (2005) 136–47.
[8] Colpan, C.O., Dincer, I., Hamdullahpur, F.,
Thermodynamic modeling of direct
[9] Meng, N.i., Dennis, Y.C., Leung, M., Leung, K.H., Modeling of methane fed solid oxide fuel cells: Comparison between proton conducting electrolyte and oxygen ion conducting electrolyte J Power Sources 183 (2008) 133–142.
[10] Dong HyupJeon A comprehensive CFD model of
anode-supported solid oxide fuel cells.
Electrochimica Acta, 54 (2009) 2727–2736.
[11] Iwai, H., Yamamoto, Y., Saito, M., Yoshida, H., Numerical simulation of hightemperaturedirect-internal-reforming planar solid oxide fuel cell. Energy, (2011) 1–10.
[12] Singhal, S.C., Kendall, K., High temperature solid oxide fuel cells: fundamentals, design and applications. Oxford: Elsevier; (2003) 12–7.
[13] Chase, M.W., NIST-JANAF thermochemical
tables, fourth edition, J. Phys. Chem. Ref. Data, Monograph, 9 (1998) 1–1951.
[14] Meng, Ni., YC Leung, D., KH Leung, M.,
Electrochemical modeling and parametric study of methane fed solid oxide fuel cells. J Energy Conversion and Management, 50 (2009) 268- 278.