W. Zhang , C. Jansson , P. A. Miller , B. Smith , and P. Samuelsson
1Department of Physical Geography and Ecosystem Science, Lund University, 223 62 Lund, Sweden 2Rossby Centre, Swedish Meteorological and Hydrological Institute, 601 76, Norrköping, Sweden
Correspondence to: W. Zhang (zhang_wenxin2005@hotmail.com)
Received: 2 April 2014 – Published in Biogeosciences Discuss.: 12 May 2014 Revised: 25 August 2014 – Accepted: 2 September 2014 – Published: 8 October 2014
Abstract. Continued warming of the Arctic will likely ac-celerate terrestrial carbon (C) cycling by increasing both up-take and release of C. Yet, there are still large uncertain-ties in modelling Arctic terrestrial ecosystems as a source or sink of C. Most modelling studies assessing or project-ing the future fate of C exchange with the atmosphere are based on either stand-alone process-based models or cou-pled climate–C cycle general circulation models, and often disregard biogeophysical feedbacks of land-surface changes to the atmosphere. To understand how biogeophysical feed-backs might impact on both climate and the C budget in Arc-tic terrestrial ecosystems, we apply the regional Earth sys-tem model RCA-GUESS over the CORDEX-Arctic domain. The model is forced with lateral boundary conditions from an EC-Earth CMIP5 climate projection under the representa-tive concentration pathway (RCP) 8.5 scenario. We perform two simulations, with or without interactive vegetation dy-namics respectively, to assess the impacts of biogeophysical feedbacks. Both simulations indicate that Arctic terrestrial ecosystems will continue to sequester C with an increased uptake rate until the 2060–2070s, after which the C budget will return to a weak C sink as increased soil respiration and biomass burning outpaces increased net primary productiv-ity. The additional C sinks arising from biogeophysical feed-backs are approximately 8.5 Gt C, accounting for 22 % of the total C sinks, of which 83.5 % are located in areas of extant Arctic tundra. Two opposing feedback mechanisms, medi-ated by albedo and evapotranspiration changes respectively, contribute to this response. The albedo feedback dominates in the winter and spring seasons, amplifying the near-surface warming by up to 1.35◦C in spring, while the evapotranspi-ration feedback dominates in the summer months, and leads
to a cooling of up to 0.81◦C. Such feedbacks stimulate veg-etation growth due to an earlier onset of the growing season, leading to compositional changes in woody plants and vege-tation redistribution.
1 Introduction
process-based models or coupled climate-Carbon cycle gen-eral circulation models (GCMs), also known as Earth system models (ESMs) (Sitch, 2008; Qian et al., 2010; McGuire et al., 2012). In general, these studies disregard biogeophysical feedbacks likely to modify initial climate forcing substan-tially at the local or regional scale under high GHG emission scenarios and consequently affect biogeochemical cycling. In this regard, it is critical to understand the role of biogeo-physical feedbacks for both Arctic climate change and ter-restrial ecosystems’ C balance, especially if their impact on near-surface temperatures is, as some estimates indicate, of a similar order of magnitude as biogeochemical mechanisms (Betts, 2000; Bathiany et al., 2010).
1.1 Filling gaps in biogeophysical feedback loops by employing a regional Earth system model
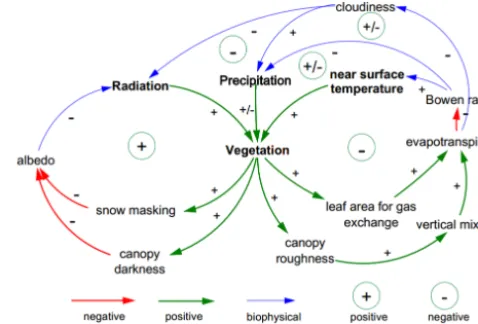
Traditionally, C stores and fluxes simulated by dynamic veg-etation models (DVMs) reflect passive responses of terres-trial ecosystems to spatial and temporal variations in cli-mate, since such climate is generated by climate models which often represent vegetation as either a static or an asyn-chronous dynamic component in the climate system (Quil-let et al., 2010). To fill gaps in the biogeophysical feedback loops relies on climate models being tightly coupled with DVMs, which can often trigger cascading impacts to am-plify or dampen climate change (Fig. 1). When it comes to Arctic tundra or the NHLs, enhanced solar radiation absorp-tion and near-surface warming are expected to directly stim-ulate plants’ photosynthesis, leading to increased leaf area index (LAI) in the growing season (Piao et al., 2006), and eventually to change vegetation composition and distribu-tion, such as occurs, for example, with a northward inva-sion of trees and tall shrubs into extant tundra areas (Tape et al., 2006; Miller and Smith, 2012). Ecosystems comprised of taller plants with bigger leaves have higher vegetation rough-ness, and can accentuate vertical mixing of eddy fluxes, re-sulting in more efficient transport of momentum, heat and moisture from the canopy to the atmosphere. Accordingly, a negative feedback loop is signified by increased latent heat fluxes, cooling the surface by reducing sensible heating or by weakening atmospheric heating due to a greater abundance of low clouds. On the other hand, invading vegetation or increased LAI may darken the surface, particularly through shading of snow in late winter and spring, and reduce surface albedo, leading to a positive feedback to near-surface tem-perature. Previous studies of vegetation feedbacks to precipi-tation have been inconclusive, with indications of positive, negative and minimal feedbacks (Seneviratne et al., 2010; Keuper et al., 2012), but they are likely associated with fac-tors such as wetness of ecosystems, enhanced evapotranspi-ration and soil moisture, convective characteristics of climate and land-surface heterogeneities.
[image:2.612.308.547.68.230.2]Recently, ESMs have started to include interactive vege-tation dynamics in their land-surface components in order
Figure 1. Diagram of climate–vegetation interaction feedback loops
that comprise positive responses (green), negative responses (red) arising from vegetation change and consequent biogeophysical feedbacks to climate (blue).
CO2 flux measurements indicate that warm winters tend to switch old boreal stands from a sink to a source of C by increasing annual respiration (Valentini et al., 2000; Mon-son et al., 2006). Similarly, studies using remote sensing ap-proaches have identified a trend of decreasing boreal forest productivity in parts of the Arctic in recent years (Beck and Goetz, 2011). By contrast, results of GCM simulations from the Coupled Carbon Cycle Climate Model Intercomparison Project (C4MIP) indicate that the NHLs will be a C sink of 0.3±0.3 Pg C yr−1by 2100 (Qian et al., 2010). Forest inven-tory data and long-term ecosystem C studies estimate that boreal forests were a sink for atmospheric CO2on the order of 0.5±0.08 Pg C yr−1in both the 1990s and 2000s (Pan et al., 2011). Most of this surplus C was stored in dead wood, litter, and soil C pools in European Russia. More recently, a compilation of flux observations and inversion model es-timates for Arctic tundra indicate that large uncertainties in the annual exchange of CO2between Arctic tundra and the atmosphere cannot distinguish the Arctic terrestrial C budget from neutral balance (McGuire et al., 2012).
Biogeophysical feedbacks involving plant-mediated changes in albedo, evapotranspiration, surface roughness and energy flux partitioning affect the efficiency of the terrestrial biosphere as a sink for CO2from the atmosphere. The ESMs studies generally agree that biogeophysical feedbacks to climate warming are positive for the NHLs and are likely give rise to an amplified warming in the future (Falloon et al., 2012). However, the amplified warming is also likely to have positive and counteracting effects on both vegetation net primary productivity (NPP) and soil heterotrophic respiration (HR). These responses increase uncertainties in determining whether Arctic terrestrial ecosystems will be a sink or source of C under future climate change.
In this study, we highlight the importance of includ-ing interactive vegetation dynamics in simulations of the future Arctic climate. To this end, we employ a re-gional ESM (RCA-GUESS) that couples a rere-gional climate model (RCA4) with an individual-based dynamic vegetation-ecosystem model (LPJ-GUESS) to study the coupled evolu-tion of climate, vegetaevolu-tion and ecosystem C balance across the pan-Arctic. By comparing simulations with and without
climate?
3. What aspects of vegetation change are particularly as-sociated with changes in terrestrial C balance?
2 Methods
2.1 RCA-GUESS, a regional Earth system model RCA-GUESS (Smith et al., 2011) is a regional ESM, in which the Land Surface Scheme (LSS) of the regional climate model RCA4 is coupled with dynamic vegetation and ecosystem biogeochemistry simulated by the individual-based vegetation-ecosystem model LPJ-GUESS.
RCA refers to the Rossby Centre Atmosphere regional cli-mate model that has been modified and updated mostly with respect to the parameterization of physical land-surface pro-cesses dealing with physiography and cold climate condi-tions in mid- and high-latitudes (Samuelsson et al., 2011). The LSS in RCA uses separate tiles for forest and open land. The forest tile is further subdivided into fractions for canopy and forest floor and the proportion of broad-leaved versus needle-leaved (coniferous) forest. The open land tile has separate fractions for vegetation and bare soil. When snow is present, both tiles have a fraction of snow covering the ground. All fractions have their own surface energy bal-ance which are weighted together to provide grid-averaged radiative and turbulent fluxes as surface boundary conditions required by the atmospheric numerical model (Samuelsson et al., 2006).
explicit representations of growth and competition among cohort-averaged woody plant individuals and a herbaceous understory co-occurring within patches differing in age since last disturbance. Woody plants and herbaceous vegetation are parameterized by plant functional types (PFTs), which are parameter sets governing plant traits with regard to morphol-ogy, phenolmorphol-ogy, shade and drought tolerance, fire resistance and bioclimatic limits. LPJ-GUESS has been successfully applied to model dynamic changes of potential natural veg-etation (PNV) across biomes of the world, including Europe (e.g. Hickler et al., 2012), and Arctic and Subarctic regions (e.g. Zhang et al., 2013). The performance and behaviour of the model in simulating ecosystem carbon cycle variations and responses to drivers has been highlighted, for example, by Ahlström et al. (2012a, b), Piao et al. (2013) and Smith et al. (2014).
In RCA-GUESS, the vegetation dynamics affects the LSS of RCA by dynamically adjusting the LAI and the relative cover of needle-leaved and broad-leaved forests in the forest tile and herbaceous vegetation in the open land tile. In this study, the six global PFTs used in LPJ-GUESS consist of bo-real needle-leaved evergreen trees (e.g. Picea obovata, Picea
abies), boreal shade-intolerant needle-leaved evergreen trees
(e.g. Pinus sylvestris), boreal needle-leaved deciduous trees (e.g. Larix sibirica), temperate broad-leaved deciduous trees (e.g. Tilia cordata), boreal shaintolerant broad-leaved de-ciduous trees (e.g. Betula pubescens) and C3 grass (e.g.
Gramineae). The parameter sets for characteristic traits of
PFTs are given in Table S1 in the Supplement. The simu-lated daily LAI and phenology state of the needle-leaved and broad-leaved PFTs in LPJ-GUESS are aggregated to the cor-responding forest types in the forest tile of RCA (Eq. 1.1 in Table S2 in the Supplement). The relative cover fractions of forests and herbaceous vegetation within the forest and open land tile are estimated as the foliar projective cover computed from the simulated LAI using Lambert Beer’s law (Eq. 1.2– 1.4 in Table S2 in the Supplement). The returned LAI alters the surface and aerodynamic resistances which are further used by RCA for the calculation of the sensible and latent heat fluxes (Eq. 1.5–1.9 in Table S2 in the Supplement). The fractional size of the forest tile is allowed to vary only if the simulated maximum growing-season LAI summed across forest PFTs is lower than 1, signifying marginal or stunted woody plant growth. The relative covers for forests and open land affect the weighted averaged albedo for each grid cell (Eq. 2.0 in Table S2). The configuration and behaviour of RCA-GUESS is described in detail by Smith et al. (2011).
2.2 Model domain, driving data and simulation protocols
The simulations were applied across the Arctic domain of the Coordinated Regional Climate Downscaling Experiment (CORDEX-Arctic). The domain encompasses 150×156 grid points with a uniform resolution of 0.44×0.44◦
(approxi-mately 50 km) by rotating the pole system over an equato-rial domain. The boundary conditions were taken from the CMIP5 (Coupled Model Intercomparison Project phase 5) simulations of the EC-Earth GCM (Hazelegger et al., 2010, 2012) for the RCP8.5 scenario (Moss et al., 2010).
RCA-GUESS was initialized by a spin-up phase to achieve an equilibrium state for vegetation structure and composi-tion, C pool and climate conditions appropriate to the period 1961–1990. Compared to the relatively short spin-up neces-sary for RCA (only a few months), LPJ-GUESS requires a much longer spin-up composed of two stages. In the first stage, LPJ-GUESS is run in an un-coupled mode, forced by climate variables (precipitation, sunshine, temperature) from the CRU TS3.0 (1991–2006) (Climate Research Unit Time Series) observation-based climate data set (Mitchell and Jones, 2005). The first-stage spin-up encompasses 360 years, repeatedly cycling de-trended CRU climate from the period 1901–1930 and the 1901 atmospheric CO2 concentra-tion of 296 ppm until 1900, and thereafter observed climate and CO2 until 1960. After 1960, the simulation continues for a further 30 years but in a coupled mode, with RCA-generated climate fields forcing GUESS, while LPJ-GUESS returns vegetation properties to RCA. In the second-stage spin-up, a new 360 year spin-up is performed, using a de-trended version of the climate forcing generated by RCA for the period 1961–1990 in the first stage. This two-stage procedure to spin up the vegetation model aims to produce a smooth transition of the climate forcing from the uncou-pled spin-up to the couuncou-pled (RCA-forced) phase of the final simulation, avoiding a step change in the forcing that may initiate drift in the soil and vegetation carbon pool sizes, dis-rupting the baseline for the subsequent coupled phase of the simulation. After the spin-up phase, RCA-GUESS was run in the coupled mode for the period 1961–1990. Two simula-tions were then performed for the period 1991–2100 in cou-pled and un-coucou-pled modes respectively (hereafter referred to as the feedback run and the non-feedback run). In the non-feedback run, RCA was forced by daily mean vegeta-tion properties averaged from the LPJ-GUESS outputs for the period 1961–1990.
Figure 2. The mean seasonal 2m temperature anomalies (◦C) relative to the CRU and WILLMOT data sets for the period 1961–1990. (a, e) Winter, December to February (DJF). (b, f) Spring, March to May (MAM). (c, g) Summer, June to August (JJA). (d, h) Autumn, September to November (SON).
based on the same aggregated vegetation classes (see Ta-ble S3 in the Supplement). The Kaplan PNV data set sup-plements the ISLSCP II PNV cover data set with additional details of low and tall shrubs across Arctic tundra. The dom-inant PNV in the model was derived from the PFTs with the largest LAI in each grid cell. The latitudinal percentage difference for each aggregated vegetation type between the composed map and the simulated map is quantified by the number of grid cells in which the simulation over- or under-estimates each vegetation type divided by the total number of grid cells in each latitude band. The simulated NPP flux was evaluated using data from both Arctic tundra and boreal forest data sets: the Ecosystem Model-Data Intercomparison (EMDI) (Olson et al., 2013a), the Biological Productivity of Ecosystems of Northern Eurasia (BAZ) (Denissenko et al., 2013), the Global Primary Production Data Initiative Prod-uct, R2 (GPPDI_1) (Olson et al., 2013b), the Global Primary Production Data Initiative Product, R3 (GPPDI_2) (Zheng et al., 2013) and the NPP Boreal Forest (BOREAL) (Gower et al., 2012). To evaluate net ecosystem exchange (NEE), the residual difference among the fluxes of NPP, HR and fire disturbance, we compared inter-annual variability of NEE anomalies and mean C budget for an Arctic tundra domain (McGuire et al., 2012; Fig. S1 in the Supplement) to the estimates of process-based models (LPJ-GUESS WHyMe (Wania et al., 2009a, b, 2010; Zhang et al., 2013). Terres-trial Carbon Flux (TCF) model (Kimball et al., 2009), OR-CHIDEE (Koven et al., 2009, 2011), Terrestrial Ecosystem Model (TEM; version 6.03) (McGuire et al., 2010; Hayes et al., 2011) and inversion models (Peylin et al., 2013) for the period 1990–2006; for details also see the Appendix in McGuire et al. (2012).
2.4 Analysis of impacts of biogeophysical feedbacks to climate, the terrestrial C budget and vegetation change
The impacts of biogeophysical land-atmosphere feedbacks on Arctic climate were quantified as mean seasonal and monthly anomalies of 2 m temperature and total precipitation averaged over the period 2071–2100 in the feedback run rel-ative to the non-feedback run. Anomalies of surface albedo and latent heat flux were calculated to discriminate albedo-from evapotranspiration-mediated feedbacks in their effects on temperature and precipitation.
For the future Arctic terrestrial C budget, we calcu-lated mean C stores and fluxes for Arctic tundra and the CORDEX-Arctic domain respectively, and examined the rel-ative contribution of C sinks from Arctic tundra. We also ex-plored how biogeophysical feedbacks affect C exchange by evaluating the magnitude and year of the peak C-uptake rate for both Arctic tundra and boreal forests.
Climate-induced vegetation shifts were analysed using the percentage of change for a normalized phenology index and a normalized physiognomy index (Wramneby et al., 2010; see Eqs. (2.1)–(2.2) in Table S2 in the Supplement) based on LAI changes of the simulated PFTs averaged over the period 2071–2100 relative to 1961–1990. Biogeophysical feedback-induced vegetation shifts were characterized as the percent-age of change for the aforementioned indices for the period 2071–2100 based on the feedback-run relative to the non-feedback run.
3 Results
Figure 3. The total seasonal precipitation anomalies (mm) relative to the CRU and WILLMOT data sets for the period 1961–1990. (a, e)
Win-ter, December to February (DJF). (b, f) Spring, March to May (MAM). (c, g) Summer, June to August (JJA). (d, h) Autumn, September to November (SON).
Figure 4. The dominant potential natural vegetation (PNV) distribution comparison for the recent period. (a) The tile-weighted PNV
sim-ulated by RCA-GUESS for the period 1961–1990. (b) The validation map derived from the ISLSCP II Potential Natural Vegetation Cover data set (Ramankutty and Foley, 2010) and the Kaplan PNV map (Kaplan et al., 2003). (c) Percentage difference (simulated minus validation map) between the number of grid cells each aggregated vegetation class occupies in each latitude band, from 52–80◦N.
in both spring and summer across the entire domain except northern Canada (Fig. 2b, c, f and g). A warm bias on the order of 2◦C occurs over winter in Scandinavia, in autumn in eastern Siberia and for all seasons in northern Canada (Fig. 2a, d, e and h). The most pronounced bias in seasonal temperature is found in eastern Siberia. Greenland is an ex-ception because both the CRU and WILLMOTT data sets are expected to have a significant bias due to poor coverage
of measurement sites. The simulated total seasonal precipita-tion is 5–20 mm higher compared to the validaprecipita-tion data sets, with a relatively larger overestimation across the entire do-main in spring and autumn (Fig. 3).
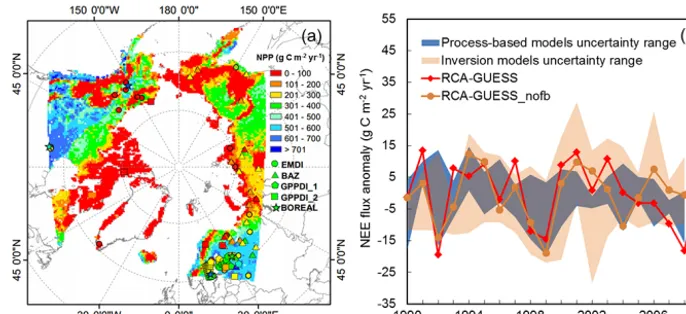
[image:6.612.129.470.275.543.2]Figure 5. (a) The spatial distribution of the simulated mean NPP flux for the period 1961–1990 and the NPP flux validation data sets; EMDI
(Olson et al., 2013a), BAZ (Denissenko et al., 2013), GPPDI_1 (Olson et al., 2013b), GPPDI_2 (Zheng et al., 2013), BOREAL (Gower et al., 2012). (b) The inter-annual variation of Arctic tundra NEE anomalies from the RCA-GUESS feedback and non-feedback runs, the uncertainty ranges of process-based models (LPJ-GUESS WHyMe, TEM6, TCF, Orchidee) and inversion models for the period 1990–2009.
of herbaceous vegetation across mountain ranges in Scandi-navia and eastern Siberia is well displayed in both the model-derived map and the validation map (Fig. 4a and b). The lat-itudinal percent difference by vegetation class is generally lower than 20 % (Fig. 4c). The overestimation of deciduous or evergreen forest fractions is offset by the underestimation of the mixed forests fraction. This inconsistency is partly at-tributed to different definitions of mixed forests in the model and validation map. In the model output, mixed forests is specified in grid cells with herbaceous fraction < 50 %, and where neither evergreen nor deciduous trees cover fraction is dominant (< 33.3 %). However, the validated mixed forests are classed as lands dominated by trees with a percent canopy cover > 60 % and height exceeding 2 metres, consisting of tree communities with interspersed mixtures or mosaics of deciduous and evergreen types, but none of which exceeds 60 % of the landscape (Loveland et al., 2000). Deciduous forests are overestimated for the herbaceous lands at the lat-itudes 69–73◦N, as a result of a simulated tree-line situated further north in northern Canada and eastern Siberia.
The simulated mean annual NPP for 1961–1990 across Arctic tundra areas (Russian Far East Siberia, Alaska, north-ern Canada, eastnorth-ern Siberia) is comparable to the validation data sets, and seldom exceeds 200 g C m−2yr−1 (Fig. 5a). Averaged over Arctic tundra, the simulated NPP for 1990– 2006 is 266 or 268 g C m−2yr−1(Table 1), which is broadly in line with previous estimates (243–252 g C m−2yr−1 for 1960s) by the LPJ-DGVM model reported by Sitch et al. (2007). For European forest, simulated NPP exceeds ob-servations by some 200–300 g C m−2yr−1 (Fig. S2 in the Supplement). This deviation indicates that nitrogen limita-tion and land use change are also important for predicting European forest NPP, although they were not included in this study. Similar European forest NPP estimations of ap-proximately 500–600 g C m−2yr−1are seen in simulation
re-sults with neither nitrogen limitation nor land use change from both coupled RCA-GUESS runs driven by lateral forc-ing fields from the reanalysis data set ERA-40 (Smith et al., 2011), and from LPJ-GUESS stand-alone simulations driven with CRU climate (Wolf et al., 2008). The simulated inter-annual variation of NEE anomalies for 1990–2006 from both RCA-GUESS runs fall within the uncertainty ranges of both process-based models and inversion models for Arctic tundra (Fig. 5b). The RCA-GUESS feedback run shows a down-ward trend similar to the estimates of process-based mod-els (LPJ-GUESS WHyMe, ORCHIDEE, TCF), indicating a slight trend towards increased carbon uptake (Table 1; Fig. S3 in the Supplement). In the non-feedback run, the trend is positive, similar to results from TEM and the ensemble mean of inversions estimates. Overall, the mean annual NPP flux exceeds the sum of respiration and wildfire C emissions, re-sulting in a net sink of C (negative NEE) into the biosphere. Biogeophysical feedbacks have a marginal impact on this net sink, reducing it by some 5 % (Table 1).
3.2 Impacts of biogeophysical feedbacks on Arctic climate
[image:7.612.126.469.67.224.2]Table 1. Mean carbon budget of Arctic tundra simulated by process-based models, inversion models and RCA-GUESS for the period 1990–
2006.
Model C flux (g C m
−2yr−1) The slope of the
NPP RH NEP FIRE NEE linear trend (−)
LPJ-GUESS WhyMe −130 106 −24 1 −23 −0.53
ORCHIDEE −361 330 −31 – −31 −0.63
TEM6 −107 97 −10 8 −2 0.25
TCF −181 183 −2 – −2 −0.62
The ensemble mean of inversion models
– – – – −13 0.2
RCA-GUESS −266 233 −33 15 −18 −0.35
RCA-GUESS nf.∗ −268 234 −34 15 −19 0.24
∗nf.: the non-feedback run.
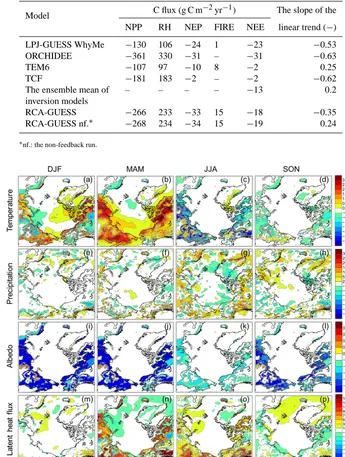
Figure 6. The effects of biogeophysical feedbacks on 2 m temperature (◦C) and total precipitation (mm), albedo (−) and latent heat flux (W m−2)on a seasonal basis, averaged from 2071–2100. (a, e, i, m) Winter, December to February (DJF). (b, f, j, n) Spring, March to May (MAM). (c, g, k, o) Summer, June to August (JJA). (d, h, l, p) Autumn, September to November (SON).
warming in winter and cooling in summer, which is in accor-dance with results reported by Wramneby et al. (2010). The impacts of biogeophysical feedbacks on precipitation are not as noticeable as for temperature. The greatest change in pre-cipitation occurs in summer with an increase of 3.57 mm over land areas (Figs. 6e–h and 7b). In contrast to the slight albedo decline of around 0.05 in summer, albedo in autumn, winter and spring is reduced significantly across the whole tundra area with the greatest reduction of around 0.2 occurring in
values (whiskers) for monthly climate variables.
Figure 8. The percentage of change for normalized phenology
in-dex(%)CNPI=(LAIeg−LAId)/(LAIeg+LAId)(Wramneby et al., 2010) quantified by the shift in the relative abundance between ever-green (eg) and deciduous (d) PFTs due to (a) climate change from the period 1961–1990 to the period 2071–2100; (b) the effects of biogeophysical feedbacks for the period 2071–2100. The percent-age of change for normalized physiognomy index (%) CNPMI= (LAIw−LAIh)/(LAIw+LAIh)quantified by the shift in the rela-tive abundance between woody (w) and herbaceous (h) PFTs due to
(c) climate change from the period 1961–1990 to the period 2071–
2100; (d) the effects of biogeophysical feedbacks for the period 2071–2100.
3.3 Impacts of biogeophysical feedbacks on future Arctic vegetation patterns and C budget
The phenological response to the simulated climate change effects on vegetation composition is not consistent across the entire CORDEX-Arctic domain. The Scandes Moun-tain range, northwestern Siberia, eastern Siberia coast and
in vegetation abundance, the effects of biogeophysical feed-backs on vegetation distribution are relatively smaller, typi-cally less than 30 % in terms of changes to the normalized phenology and physiognomy indices (Fig. 8b, d).
The inter-annual variation of the NEE flux for 1991–2100 in the RCA-GUESS non-feedback run indicates that the C-uptake rate could start to increase rapidly in the 2020s, reach the largest value in the 2060s, after which the C-uptake rate decreases until the 2090s (Fig. 9a). However, in the RCA-GUESS feedback run, the biogeophysical feedbacks further enhance C-uptake from the 2020s, and postpone the arrival of the largest C-uptake rate for 15 years. To examine where and how many grid cells might exhibit this behaviour, we sorted the grid cells into groups according to the extent of the in-crease or dein-crease of the NEE seen in each cell. Most grid cells with the enhanced C-uptake are found in Arctic tundra with an increase of NEE around 50–100 g C m−2yr−1, while boreal forests show more grid cells with the largest NEE flux decreased by 0–50 g C m−2yr−1(Fig. 9b). Meanwhile, Arc-tic tundra also includes more grid cells with the largest C-uptake rate postponed than boreal forests (Fig. 9c). In to-tal, by the end of 2100, the CORDEX-Arctic domain will gain 38.7 Gt C (Table 2), of which 35.6 Gt C is sequestered by Arctic tundra. This estimation is comparable to the esti-mates of C4MIP simulations of around 38±20 Gt C for the NHLs (Qian et al., 2012). Most of the C gains are allocated to vegetation biomass. Litter and soil C stores are increased by 0.5 and 1.2 Gt C respectively for Arctic tundra, but decreased by 1.8 and 6.4 Gt C respectively for the CORDEX-Arctic do-main. Biogeophysical feedbacks account for about 22 % of the increase in net C uptake, around 8.5 Gt C. The majority (83.5 %) of this extra C uptake comes from areas simulated as Arctic tundra in the modern climate.
4 Discussion
[image:9.612.49.286.237.477.2]Figure 9. (a) The inter-annual variation of NEE flux (Gt C yr−1) in both RCA-GUESS feedback and non-feedback runs from 1990 to 2100 for Arctic tundra. (nofb: the non-feedback run; negative value: carbon sink; the vertical dash and dash-dot lines denote the year with the largest NEE over the whole period). (b) Distribution of the number of grid cells (total: 9032) for the shift of the peak C-uptake rate (g C m−2yr−1) in both boreal forests and Arctic tundra (positive: increase; negative: decrease). (c) Distribution of the number of grid cells for the shift of the year (yr) with the peak C-uptake rate in both boreal forests and Arctic tundra (positive: delay; negative: advance).
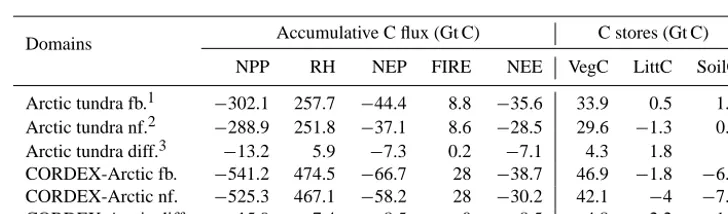
Table 2. Carbon budget of the Arctic tundra and CORDEX-Arctic domains simulated by RCA-GUESS for the period 1990–2100.
Domains Accumulative C flux (Gt C) C stores (Gt C)
NPP RH NEP FIRE NEE VegC LittC SoilC
Arctic tundra fb.1 −302.1 257.7 −44.4 8.8 −35.6 33.9 0.5 1.2 Arctic tundra nf.2 −288.9 251.8 −37.1 8.6 −28.5 29.6 −1.3 0.2 Arctic tundra diff.3 −13.2 5.9 −7.3 0.2 −7.1 4.3 1.8 1 CORDEX-Arctic fb. −541.2 474.5 −66.7 28 −38.7 46.9 −1.8 −6.4 CORDEX-Arctic nf. −525.3 467.1 −58.2 28 −30.2 42.1 −4 −7.9 CORDEX-Arctic diff. −15.9 7.4 −8.5 0 −8.5 4.8 2.2 1.5
1fb.: the feedback run;2nf.: the non-feedback run;3diff.: the feedback run minus the non-feedback run. Note: negative values in
C flux mean C uptake, but negative values in C stores mean absolute reductions of C stores.
forcing or shortcomings in the model’s structures, formula-tions and parameterizaformula-tions. For example, the warm bias over northern Canada in our simulations year-round during the pe-riod 1961–1990 is inherited from the GCM-simulated fields on the lateral boundaries of the simulated domain; the EC-Earth output shows a warm bias over this area of 1–4◦C for the 1980s, when compared to reanalysis data (Koenigk et al., 2013). For other areas of the Arctic, EC-Earth tends to show a cold bias, attributed to the overestimation of sea ice thick-ness and extent (Koenigk et al., 2013). This likely explains the cold bias in spring and summer found in our simulations across almost the entire domain. Berg et al. (2013) compared ERA-Interim reanalysis climate data to output from an RCA4 simulation across the Arctic forced by ERA-Interim data on the lateral boundaries, identifying a winter-time warm bias in eastern Siberia and a summer-time cold bias across the entire domain. Our simulations show similar patterns.
When similar patterns of bias recur in simulations us-ing different lateral forcus-ings, this may indicate the effects of inaccurate parameterizations in the model. Samuelsson et al. (2011) pointed out that RCA4 generally underestimates snow albedo in cold climate regions, resulting in higher air temperatures and less snow accumulation. This probably
ex-plains the most pronounced areas of warm bias which occur in eastern Siberia in our simulations.
Whereas the bias pattern for temperature is relatively sim-ilar between RCA-GUESS and EC-Earth, precipitation bias indicates more inconsistency. For instance, RCA-GUESS simulates less precipitation in the basins of Barents Sea and Bering Strait compared to EC-Earth. This may reflect the greater topographical variability arising from a finer grid res-olution in the regional model; in EC-Earth, smoother topog-raphy reduces orographic rainfall, potentially spreading the same total amount of precipitation over a larger area, causing overestimation over rain-shadow areas in the lee of the moun-tain ranges. By contrast, RCA4 is known to overestimate precipitation over mountain tops due to an overestimated cloud fraction (Samuelsson et al., 2011). In general, complex mountainous terrain poses a challenge for accurately sim-ulating vertical velocities in the resolved scale. Overall, in comparison to the EC-Earth outputs and observation-based data sets, RCA-GUESS generally demonstrates good skill in reproducing spatial patterns of the present day climate with respect to temperature and precipitation.
[image:10.612.115.479.293.400.2]2100, the C uptake started to increase more rapidly, but re-mained within the ensemble range (Fig. S4 in the Supple-ment). This suggests that our climate forcing set-up is repre-sentative for climate projections from a wide range of GCMs in terms of predicting the NEE flux.
4.2 Vegetation dynamics and ecosystem biogeochemistry in response to Arctic climate change
Distinct geographical patterns of vegetation distribution in the Arctic and NHLs are largely shaped by spatial patterns in temperature and precipitation, while other factors like soil properties, topographical barriers, land use change, and per-mafrost vulnerability are additional determinants (Morales et al., 2005; Koca et al., 2006; Jiang et al., 2012). Zhang et al. (2013) demonstrated that LPJ-GUESS shows a generally good performance in replicating vegetation patterns across the Arctic, in particular capturing forest–shrub–tundra tran-sitions observed in the Canadian Arctic, northern Alaska, the Taymyr Peninsula, and the Scandes Mountain range under the present-day climate. RCA-GUESS simulates vegetation shifts in broad agreement with previous studies: the com-bined effects of climatic warming and elevated CO2 allow the bioclimatic niche for boreal or temperate forests to move towards higher latitudes and elevations (Fig. 8c; Morales et al., 2007; Wolf et al., 2008; Zhang et al., 2013); the longer and warmer growing season favours broad-leaved decidu-ous (e.g. birch) forests in competition with evergreen forests dominated by species of spruce and pine, typical for the bo-real zone (Fig. 8a, c; Hickler et al., 2012; Miller and Smith; 2012; Jiang et al., 2012) and warmer winters and altered pre-cipitation patterns result in boreal deciduous (larch) trees in Siberia giving way to boreal evergreen and temperate decid-uous trees (Fig. 8a; Kaplan et al., 2003; Shuman et al., 2011; Zhang et al., 2013).
Numerous modelling studies have explored how climate-, CO2- and land use-driven variations in NPP, HR and distur-bance fluxes might influence the future fate of the present-day sink of atmospheric CO2within the terrestrial biosphere (e.g. Ahlström et al., 2012b; Brovkin et al., 2006; Poulter et al., 2011;). Our simulated mean NEE flux averaged from
WHyMe share the same fire process description, in which fires are determined by the amount of above-ground litter and a soil moisture threshold (Sitch et al., 2003). However, LPJ-GUESS WHyMe is forced by the observation-based, CRU climate data set and uses an extended set of Arctic-specific PFTs, which depicts the simulated tree-line boundary with more accuracy (Zhang et al., 2013). The rapid increase of C uptake from the 2020s in both RCA-GUESS runs can be at-tributed to substantial climate-induced vegetation shifts and a prolonged growing-season length. However, C gains eventu-ally decline as the increased HR flux in response to continu-ous climate warming outpaces the increased NPP flux. Previ-ous studies based on the stand-alone simulations with DVMs show similar effects (e.g. Cao and Woodard 1998; Cramer et al., 2001; Lucht et al., 2006; Zhang et al., 2013).
4.3 Impacts of biogeophysical feedbacks for future Arctic climate and C balance
The net impacts of biogeophysical feedbacks to future cli-mate result largely from the opposing effects of albedo- and evapotranspiration-feedback mechanisms. Firstly, the ampli-fied warming occurring in winter and spring is associated with positive feedbacks arising from substantial reductions of albedo (Fig 6a, b, i and j). Winter- and spring-time albedo reductions indicate that the underlying snow is masked and shaded by stems and leaves of woody vegetation, which in-creases both in areal extent and local density, resulting in an earlier onset of the growing season and a longer snow-free season in the future. Based on a non-linear relationship be-tween albedo and summer vegetation biomass, Euskirchen et al. (2009) predicted that the increase of regional summer heat absorption due to potential vegetation change under fu-ture climate scenarios (A2, B1 and B2) would be 0.34±
Supplement). However, it should be noted that the estimates of Euskirchen et al. (2009) are based on stand-alone, uncou-pled simulations and use a lower CO2concentration scenario. After accounting for the effects of climate–vegetation inter-action and stronger CO2fertilization, their estimates would be expected to increase. Secondly, attenuated warming in summer is associated with negative feedbacks arising from increased evapotranspiration that overtake positive feedbacks arising from a reduction in albedo. The evapotranspiration is enhanced by a higher overall LAI (leaf surface for evap-oration) as well as a denser forest cover, which increases surface roughness, promoting a more dynamic exchange of water vapour and energy with the atmosphere. Kasurinen et al. (2014) analysed latent heat measurement data gathered at 65 boreal and arctic eddy-covariance sites and found that from tundra to forests, latent heat flux in summer increases from∼75 to∼90 W m−2, which is also in line with our es-timates (Fig. 6o). On an annual basis, the net effect of these feedbacks on temperature averages a modest 0.0069◦C yr−1 over the period 1991–2100. As for their effects on the sea-sonal cycle of Arctic vegetation, however, the feedbacks re-sult in an earlier, longer and more uniform vegetation period, in terms of growing-season temperatures (Fig. 7a), promot-ing a substantial increase in vegetation productivity. Stud-ies with other global ESMs have reported comparable near-surface temperature increases due to vegetation-mediated feedbacks of around 0.0028◦C yr−1 from the 1870s to the 2080s for the NHLs as a whole (Falloon et al., 2012).
Using an iterative coupling approach, Matthes et al. (2011) investigated the sensitivity of projected regional climate change to vegetation shifts imposed on the land-surface conditions in a regional climate model (HIRHAM) applied across the Arctic. They found that woody vegetation expan-sion under an SRES A1B emisexpan-sion scenario led to a change in temperature by 3◦C in winter and −1.5◦C in summer. These temperature adjustments were larger than effects at-tributed to freezing/thawing of soil or insulation by top or-ganic soil horizons. Similarly, we also found the largest warming to occur in winter in areas experiencing gradual dy-namic shifts from tundra to forest tundra or forest tundra to forest.
The sensitivity of vegetation distribution to the effects of biogeophysical feedbacks seems relatively modest (Fig. 8b and d). The additional C sinks arising from biogeophysical feedbacks correspond, at around 8.5 Gt C, to global anthro-pogenic emissions for about one year under present condi-tions (Table 2), relatively modest compared to some esti-mates of the potential losses of C from thawing permafrost across the Arctic (Schuur et al., 2013). A prolonged growing season, denser forest cover and invasion of trees into tundra result in even greater enhancements to vegetation productiv-ity, which postpones the arrival of the peak C-uptake rate for Arctic terrestrial ecosystems. In our study, dramatic changes were found in the transition from herbaceous to woody veg-etation occurring in Arctic tundra (Fig. 8c). These changes
appear to primarily account for the simulated increased C storage in areas classified as Arctic tundra in the present cli-mate.
4.4 Perspectives to improve regional ESMs
Our results highlight the significance of implementing bio-geophysical mechanisms of climate–vegetation interactions in regional Earth system dynamics. Not only do biogeophys-ical feedbacks result in a more rapid warming on an annual average basis, but they also cause adjustments in the timing and character of the growing season that affect vegetation productivity and net C balance, with further implications for climate evolution. However, we do make some simplistic as-sumptions in this first trial of modelling regional Earth sys-tem dynamics over the Arctic, and there are some issues that warrant further investigation in order to improve our under-standing of impacts of biogeophysical feedbacks on Arctic terrestrial ecosystems and their C balance.
Biogeophysical feedback loops should be expanded to in-volve energy and water flux exchanged over Arctic sea sur-face. Swann et al. (2010) advanced a hypothesis in which a positive albedo feedback prompts the growth of vegetation, leading to an increased flux of water vapour to the atmo-sphere, thereby strengthening radiative forcing. After being mixed in the atmosphere, water vapour feeds back on cli-mate not only over land but also over the sea surface, trig-gering a subsequent positive sea ice feedback, which in turn warms the land surface. They found radiative forcing from water vapour changes to be of a similar magnitude as the di-rect short-wave forcing from albedo reductions. Therefore, further modelling studies on Arctic regional Earth system dynamics ought to include the ocean component to fully ad-dress biogeophysical feedbacks.
to forests and abandoned lands would impact the strength of the albedo- and evapotranspiration-mediated feedbacks over Europe. In mountainous areas, land-use change plays an even more important role in driving tree-line dynamics than cli-mate change (Hickler et al., 2012). For Arctic ecosystem dy-namics, terrestrial ecosystem models should be tailored to better capture a variety of Arctic and Subarctic landscapes, and include tall and low shrubs, graminoid forbs, lichen and moss. In this study, using C3 grass and trees instead of forbs and shrubs typical for Arctic tundra, we may underestimate the C-uptake strength arising from shrubs’ expansion despite our model’s ability to capture the grass-wood transition in a manner similar to the forests-shrubs-tundra transition seen in Zhang et al. (2013). Moreover, it is important to evaluate the algorithm to derive albedo change from simulated changes in vegetation relative cover fractions and LAI. Brovkin et al. (2013) present an approach to evaluate woody vegetation cover and land-surface albedo in ESMs that can be applied to regional studies as well.
The model version adopted for this study does not include nutrient feedbacks to vegetation growth, although N cycling is included in the current offline version of LPJ-GUESS (Smith et al., 2014). Nitrogen mineralization rates in the cold soils of boreal and Arctic ecosystems are known to limit the productivity of vegetation in these areas. Simulations with N-enabled global carbon cycle models generally suggest that C sequestration under a future high CO2climate will be lower globally when N-cycle feedbacks are accounted for (Zaehle and Dalmonech, 2011). However, increasing mineralization rates in warming soils will reduce N-limitation, allowing sub-stantial productivity increases as growing seasons become longer and warmer. In addition, trees colonising tundra ar-eas, which are rendered accessible by a milder climate con-stitute a temporary, new sink for carbon until stand-carrying capacity is reached and mortality matches biomass growth. As shown for the N-enabled version of LPJ-GUESS by Wår-lind et al. (2014), these effects will counteract any tendency for N availability to inhibit an increase in C storage by high-latitude ecosystems in a warming, high-CO2climate. Base-line (1961–1990) NPPs simulated by RCA-GUESS across the Arctic are within the range of variability of observations (Fig. 5a). Although the present study does not include N
lim-til the 2060s–2070s, after which C uptake declines as in-creased soil respiration and biomass burning outpaces fur-ther increases in vegetation net primary productivity. Biogeo-physical effects from climate–vegetation interactions, lead-ing to an earlier, longer growlead-ing season and milder peak tem-peratures in summer, enhance the initial increase in the C sink by accentuating NPP and postponing the peak C-uptake rate by some 15 years. Integrated over the 21st century, the additional C sinks arising from biogeophysical feedbacks are some 8.5 Gt C, or 22 % of the total C sink, of which 83.5 % is located in areas currently classified as Arctic tundra. The net effects of biogeophysical feedbacks to the regional climate result from two opposing feedback mechanisms, namely the albedo feedback and the evapotranspiration feedback. The former dominates in the winter and spring seasons, ampli-fying the near-surface warming by up to 1.35◦C in spring, while the latter dominates in summer, resulting in an evap-orative cooling of up to 0.81◦C. Such feedbacks stimulate vegetation growth with an earlier onset of the growing sea-son, leading to compositional changes in woody plants and vegetation redistribution.
The Supplement related to this article is available online at doi:10.5194/bg-11-5503-2014-supplement.
Acknowledgements. The model simulations were carried out at
the National Supercomputer Centre (NSC) in Linköping, Sweden. The study is funded by the Swedish Research Council FORMAS within the project Advanced Simulation of Arctic Climate and Impact on Northern Regions (ADSIMNOR). The authors would like to thank the Rossby Centre at the Swedish Meteorological and Hydrological Institute (SMHI) for coordinating this project, and thank A. David McGuire and Anders Ahlström for providing additional data to evaluate our results. The study is a contribution to the strategic research areas Modelling the Regional and Global Earth System (MERGE) and Biodiversity and Ecosystem Services in a Changing Climate (BECC), the Lund University Centre for the study of Climate and Carbon Cycle (LUCCI) and the Nordic Centre of Excellence DEFROST.
References
Ahlström, A., Miller, P. A., and Smith, B.: Too early to infer a global NPP decline since 2000. Geophys. Res. Lett., 39, L15403, doi:10.1029/2012GL052336, 2012a.
Ahlström, A., Schurgers, G., Arneth, A., and Smith, B.: Robust-ness and uncertainty in terrestrial ecosystem carbon response to CMIP5 climate change projections, Environ. Res. Lett., 7, 044008, doi:10.1088/1748-9326/7/4/044008, 2012b.
Bathiany, S., Claussen, M., Brovkin, V., Raddatz, T., and Gayler, V.: Combined biogeophysical and biogeochemical effects of large-scale forest cover changes in the MPI earth system model, Bio-geosciences, 7, 1383–1399, doi:10.5194/bg-7-1383-2010, 2010. Beck, P. S. A. and Goetz, S. J.: Satellite observations of high north-ern latitude vegetation productivity changes between 1982 and 2008: ecological variability and regional differences, Environ. Res. Lett., 6, 045501, doi:10.1088/1748-9326/6/4/045501, 2011. Berg, P., Döscher, R., and Koenigk, T.: Impacts of using spectral nudging on regional climate model RCA4 simulations of the Arc-tic, Geosci. Model Dev., 6, 849–859, doi:10.5194/gmd-6-849-2013, 2013.
Betts, R. A.: Offset of the potential carbon sink from boreal foresta-tion by decreases in surface albedo, Nature, 408, 187–190, doi:10.1038/35041545, 2000.
Blok, D., Heijmans, M. M. P. D., Schaepman-Strub, G., Kononov, A. V., Maximov, T. C., and Berendse, F.: Shrub expansion may reduce summer permafrost thaw in Siberian tundra, Glob. Change Biol., 16, 1296–1305, 2010.
Bonan, G. B.: Forests and Climate Change: Forcings, Feedbacks, and the Climate Benefits of Forests, Science, 320, 1444–1449, doi:10.1126/science.1155121, 2008.
Bonfils, C. J. W., Phillips, T. J., Lawrence, D. M., Cameron-Smith, P., Riley, W. J., and Subin, Z. M.: On the influence of shrub height and expansion on northern high latitude climate, Environ. Res. Lett., 7, 015503, doi:10.1088/1748-9326/7/1/015503, 2012. Brovkin, V., Claussen, M., Driesschaert, E., Fichefet, T.,
Kick-lighter, D., Loutre, M. F., Matthews, H. D., Ramankutty, N., Schaeffer, M., and Sokolov, A.: Biogeophysical effects of his-torical land cover changes simulated by six Earth system mod-els of intermediate complexity, Clim. Dynam., 26, 587–600, doi:10.1007/s00382-005-0092-6, 2006.
Brovkin, V., Boysen, L., Raddatz, T., Gayler, V., Loew, A., and Claussen, M.: Evaluation of vegetation cover and land-surface albedo in MPI-ESM CMIP5 simulations, J. Adv. Model. Earth Syst., 5, 48-57, doi:10.1029/2012MS000169, 2013.
Cao, M. and Woodward, F. I.: Net primary and ecosystem pro-duction and carbon stocks of terrestrial ecosystems and their responses to climate change, Glob. Change Biol., 4, 185–198, doi:10.1046/j.1365-2486.1998.00125.x, 1998.
Chapin, F. S., Sturm, M., Serreze, M. C., McFadden, J. P., Key, J. R., Lloyd, A. H., McGuire, A. D., Rupp, T. S., Lynch, A. H., Schimel, J. P., Beringer, J., Chapman, W. L., Epstein, H. E., Eu-skirchen, E. S., Hinzman, L. D., Jia, G., Ping, C.-L., Tape, K. D., Thompson, C. D. C., Walker, D. A., and Welker, J. M.: Role of Land-Surface Changes in Arctic Summer Warming, Science, 310, 657–660, doi:10.1126/science.1117368, 2005.
Cox, P. M., Betts, R. A., Jones, C. D., Spall, S. A., and Totter-dell, I. J.: Acceleration of global warming due to carbon-cycle feedbacks in a coupled climate model, Nature, 408, 184–187, doi:10.1038/35041539, 2000.
Cramer, W., Kicklighter, D. W., Bondeau, A., Moore lii, B., Churkina, G., Nemry, B., Ruimy, A. and Schloss, A. L.: Com-paring global models of terrestrial net primary productivity (NPP): overview and key results, Glob. Change Biol., 5, 1–15, doi:10.1046/j.1365-2486.1999.00009.x, 1999.
Denissenko, E. A., Brovkin, V., and Cramer, W.: NPP Multi-Biome: PIK Data for Northern Eurasia, 1940-1988 (Based on Bazile-vich), Data set, available at: http://daac.ornl.gov, from Oak Ridge National Laboratory Distributed Active Archive Center, Oak Ridge, Tennessee, USA, doi:10.3334/ORNLDAAC/575, 2013. Elmendorf, S. C., Henry, G. H. R., Hollister, R. D., Bjork, R. G.,
Boulanger-Lapointe, N., Cooper, E. J., Cornelissen, J. H. C., Day, T. A., Dorrepaal, E., Elumeeva, T. G., Gill, M., Gould, W. A., Harte, J., Hik, D. S., Hofgaard, A., Johnson, D. R., Johnstone, J. F., Jonsdottir, I. S., Jorgenson, J. C., Klanderud, K., Klein, J. A., Koh, S., Kudo, G., Lara, M., Levesque, E., Magnusson, B., May, J. L., Mercado-Diaz, J. A., Michelsen, A., Molau, U., Myers-Smith, I. H., Oberbauer, S. F., Onipchenko, V. G., Rixen, C., Martin Schmidt, N., Shaver, G. R., Spasojevic, M. J., orhalls-dottir, o. E., Tolvanen, A., Troxler, T., Tweedie, C. E., Villareal, S., Wahren, C.-H., Walker, X., Webber, P. J., Welker, J. M., and Wipf, S.: Plot-scale evidence of tundra vegetation change and links to recent summer warming, Nat. Clim. Change, 2, 453–457, doi:10.1038/nclimate1465, 2012.
Euskirchen, E. S., McGuire, A. D., Rupp, T. S., Chapin III, F. S., and Walsh J. E.: Projected changes in atmospheric heat-ing due to changes in fire disturbance and the snow season in the western Arctic, 2003–2100, J. Geophys. Res., 114, G04022, doi:10.1029/2009JG001095, 2009.
Falloon, P. D., Dankers, R., Betts, R. A., Jones, C. D., Booth, B. B. B., and Lambert, F. H.: Role of vegetation change in future climate under the A1B scenario and a climate stabilisation sce-nario, using the HadCM3C Earth system model, Biogeosciences, 9, 4739–4756, doi:10.5194/bg-9-4739-2012, 2012.
Gerten, D., Schaphoff, S., Haberlandt, U., Lucht, W., Sitch, S.: Ter-restrial vegetation and water balance – hydrological evaluation of a dynamic global vegetation model, J. Hydrol., 286, 249–270, doi:10.1016/j.jhydrol.2003.09.029, 2004.
Gower, S.T., Krankina, O., Olson, R. J., Apps, M., Linder, S., and Wang, C.: NPP Boreal Forest: Consistent Worldwide Site Estimates, 1965–1995, R1. Data set, available at: http: //daac.ornl.gov from the Oak Ridge National Laboratory Dis-tributed Active Archive Center, Oak Ridge, Tennessee, USA, doi:10.3334/ORNLDAAC/61, 2012.
Hayes, D. J., McGuire, A. D., Kicklighter, D. W., Gurney, K. R., Burnside, T. J., and Melillo, J. M.: Is the northern high-latitude land-based CO2 sink weakening? Global Biogeochem. Cy., 25, GB3018, doi:10.1029/2010GB003813, 2011.
Hayes, D. J., Turner, D. P., Stinson, G., McGuire, A. D., Wei, Y., West, T. O., Heath, L. S., de Jong, B., McConkey, B. G., Birdsey, R. A., Kurz, W. A., Jacobson, A. R., Huntzinger, D. N., Pan, Y., Post, W. M., and Cook, R. B.: Reconciling estimates of the con-temporary North American carbon balance among terrestrial bio-sphere models, atmospheric inversions, and a new approach for estimating net ecosystem exchange from inventory-based data, Global Change Biol., 18, 1282–1299, 2012.
I., and Sykes, M. T.: Projecting the future distribution of Eu-ropean potential natural vegetation zones with a generalized, tree species-based dynamic vegetation model, Global Ecol. Bio-geogr., 21, 50–63, doi:10.1111/j.1466-8238.2010.00613.x, 2012. Jiang, Y., Zhuang, Q., Schaphoff, S., Sitch, S., Sokolov, A., Kick-lighter, D., and Melillo, J.: Uncertainty analysis of vegetation distribution in the northern high latitudes during the 21st cen-tury with a dynamic vegetation model, Ecology and Evolution, 2, 593–614, doi:10.1002/ece3.85, 2012.
Kaplan, J. O., Bigelow, N. H., Prentice, I. C., Harrison, S. P., Bartlein, P. J., Christensen, T. R., Cramer, W., Matveyeva, N. V., McGuire, A. D., Murray, D. F., Razzhivin, V. Y., Smith, B., Walker, D. A., Anderson, P. M., Andreev, A. A., Brubaker, L. B., Edwards, M. E., and Lozhkin, A. V.: Climate change and Arctic ecosystems II: Modeling, paleodata-model com-parisons and future projections, J. Geophys. Res., 108, 8171, doi:10.1029/2002JD002559, 2003.
Kasurinen, V., Alfredsen, K., Kolari, P., Mammarella, I., Aleks-eychik, P., Rinne, J., Vesala, T., Bernier, P., Boike, J., Langer, M., Belelli Marchesini, L., van Huissteden, K., Dolman, H., Sachs, T., Ohta, T., Varlagin, A., Rocha, A., Arain, A., Oechel, W., Lund, M., Grelle, A., Lindroth, A., Black, A., Aurela, M., Laurila, T., Lohila, A., and Berninger, F.: Latent heat ex-change in the boreal and arctic biomes, Glob. Change Biol., doi:10.1111/gcb.12640, online first, 2014.
Keuper, F., Parmentier, F. J., Blok, D., Bodegom, P., Dorrepaal, E., Hal, J., Logtestijn, R. P., and Aerts, R.: Tundra in the rain: dif-ferential vegetation responses to three years of experimentally doubled summer precipitation in siberian shrub and swedish bog tundra, Ambio, 41, 269–280, doi:10.1007/s13280-012-0305-2, 2012.
Kimball, J. S., Jones, L. A., Zhang, K., Heinsch, F. A., McDonald, K. C., and Oechel, W. C.: A satellite approach to estimate land-atmosphere CO2 exchange for Boreal and Arctic biomes using MODIS and AMSR-E, IEEE T. Geosci. Remote, 47, 569–587, doi:10.1109/TGRS.2008.2003248, 2009.
Koenigk, T., Brodeau, L., Graversen, R., Karlsson, J., Svensson, G., Tjernström, M., Willén, U., and Wyser, K.: Arctic climate change in 21st century CMIP5 simulations with EC-Earth, Clim. Dynam., 40, 2719–2743, doi:10.1007/s00382-012-1505-y, 2013. Koca, D., Smith, B., and Sykes M. T.: Modelling Regional Climate Change Effects On Potential Natural Ecosystems in Sweden, Climatic Change, 78, 381–406, doi:10.1007/s10584-005-9030-1, 2006.
creasing Arctic shrub abundance depends on the relative influ-ence of shrubs on local soil cooling versus large-scale climate warming, Environ. Res. Lett., 6, 045504, doi:10.1088/1748-9326/6/4/045504, 2011.
Loranty, M. M., Berner, L. T., Goetz, S. J., Jin, Y., and Rander-son, J. T.: Vegetation controls on northern high latitude snow-albedo feedback: observations and CMIP5 model predictions, Glob. Change Biol., 20, 594–606, doi:10.1111/gcb.12391, 2014. Loveland, T. R., Reed B. C., Brown J. F., Ohlen D. O., Zhu Z., Yang L., and Merchant J. W.: Development of a global land cover characteristics database and IGBP DISCover from 1 km AVHRR data, Int. J. Remote Sens., 21, 1303–1330, doi:10.1080/014311600210191, 2000.
Lucht W., Schaphoff S., Erbrecht T., Heyder U., and Cramer W.: Terrestrial vegetation redistribution and carbon balance under cli-mate change, Carbon Balance and Management, p. 7, 2006. MacDougall, A. H., Avis C. A., and Weaver A. J.: Significant
contri-bution to climate warming from the permafrost carbon feedback, Nat. Geosci., 5, 719–721, doi:10.1038/ngeo1573, 2012. Matthes, H., Rinke, A., Miller, P., Kuhry, P., Dethloff, K., and
Wolf, A.: Sensitivity of high-resolution Arctic regional climate model projections to different implementations of land surface processes, Climatic Change, 111, 197–214, doi:10.1007/s10584-011-0138-1, 2011.
McGuire, A. D., Hayes, D. J., Kicklighter, D. W., Manizza, M., Zhuang, Q., Chen, M., Follows, M. J., Gurney, K. R., McClel-land, J.W.,Melillo, J.M., Peterson, B. J., and Prinn, R.: An analy-sis of the carbon balance of the Arctic Basin from 1997 to 2006, Tellus B, 62, 455–474, doi:10.1111/j.1600-0889.2010.00497.x, 2010.
McGuire, A. D., Christensen, T. R., Hayes, D., Heroult, A., Eu-skirchen, E., Kimball, J. S., Koven, C., Lafleur, P., Miller, P. A., Oechel, W., Peylin, P., Williams, M., and Yi, Y.: An assessment of the carbon balance of Arctic tundra: comparisons among ob-servations, process models, and atmospheric inversions, Biogeo-sciences, 9, 3185–3204, doi:10.5194/bg-9-3185-2012, 2012. Miller, P. A. and Smith, B.: Modelling Tundra Vegetation
Re-sponse to Recent Arctic Warming, Ambio, 41, 281–291, doi:10.1007/s13280-012-0306-1, 2012.
Mitchell, T. D. and Jones, P. D.: An improved method of con-structing a database of monthly climate observations and as-sociated high-resolution grids, Int. J. Climatol., 25, 693–712, doi:10.1002/joc.1181, 2005.
respiration controlled by climate and microbial community com-position, Nature, 439, 711–714, doi:10.1038/nature04555, 2006. Morales, P., Sykes, M. T., Prentice, I. C., Smith, P., Smith, B., Bugmann, H., Zierl, B., Friedlingstein, P., Viovy, N., Sabaté, S., Sánchez, A., Pla, E., Gracia, C. A., Sitch, S., Arneth, A., and Ogee, J.: Comparing and evaluating process-based ecosys-tem model predictions of carbon and water fluxes in major European forest biomes, Glob. Change Biol., 11, 2211–2233, doi:10.1111/j.1365-2486.2005.01036.x, 2005.
Morales, P., Hickler, T., Rowell, D. P., Smith, B., and Sykes, M. T.: Changes in European ecosystem productivity and carbon balance driven by regional climate model output, Glob. Change Biol., 13, 108–122, doi:10.1111/j.1365-2486.2006.01289.x, 2007. Moss, R. H., Edmonds, J. A., Hibbard, K. A., Manning, M. R., Rose,
S. K., van Vuuren, D. P., Carter, T. R., Emori, S., Kainuma, M., Kram, T., Meehl, G. A., Mitchell, J. F. B., Nakicenovic, N., Ri-ahi, K., Smith, S. J., Stouffer, R. J., Thomson, A. M., Weyant, J. P., and Wilbanks, T. J.: The next generation of scenarios for climate change research and assessment, Nature, 463, 747–756, doi:10.1038/nature08823, 2010.
Olson, R. J., Scurlock, J. M. O., Prince, S. D., Zheng, D. L., and Johnson, K. R (Eds.): NPP Multi-Biome: NPP and Driver Data for Ecosystem Model Data Intercomparison, R2. Data set, avail-able at: http://daac.ornl.gov, from Oak Ridge National Labora-tory Distributed Active Archive Center, Oak Ridge, Tennessee, USA, doi:10.3334/ORNLDAAC/615, 2013a.
Olson, R. J., Scurlock, J. M. O., Prince, S. D., Zheng, D. L., and Johnson, K. R. (Eds.): NPP Multi-Biome: Global Primary Production Data Initiative Products, R2. Data set, available at: http://daac.ornl.gov, from the Oak Ridge National Laboratory Distributed Active Archive Center, Oak Ridge, Tennessee, USA, doi:10.3334/ORNLDAAC/617, 2013b.
Oechel, W. C., Hastings, S. J., Vourlrtis, G., Jenkins, M., Riechers, G., and Grulke, N.: Recent change of Arctic tundra ecosystems from a net carbon dioxide sink to a source, Nature, 361, 520–523, doi:10.1038/361520a0, 1993.
Pan, Y., Birdsey, R. A., Fang, J., Houghton, R., Kauppi, P. E., Kurz, W. A., Phillips, O. L., Shvidenko, A., Lewis, S. L., Canadell, J. G., Ciais, P., Jackson, R. B., Pacala, S. W., McGuire, A. D., Piao, S., Rautiainen, A., Sitch, S., and Hayes, D.: A Large and Persistent Carbon Sink in the World’s Forests, Science, 333, 988– 993, doi:10.1126/science.1201609, 2011.
Peylin, P., Law, R. M., Gurney, K. R., Chevallier, F., Jacobson, A. R., Maki, T., Niwa, Y., Patra, P. K., Peters, W., Rayner, P. J., Rödenbeck, C., van der Laan-Luijkx, I. T., and Zhang, X.: Global atmospheric carbon budget: results from an ensemble of atmospheric CO2 inversions, Biogeosciences, 10, 6699–6720, doi:10.5194/bg-10-6699-2013, 2013.
Piao, S., Fang, J., Zhou, L., Ciais, P., and Zhu, B.: Varia-tions in satellite-derived phenology in China’s temperate veg-etation, Glob. Change Biol., 12, 672–685, doi:10.1111/j.1365-2486.2006.01123.x, 2006.
Piao, S., Sitch, S., Ciais, P., Friedlingstein, P., Peylin, P., Wang, X., Ahlström, A., Anav, A., Canadell, J. G., Cong, N., Huntingford, C., Jung, M., Levis, S., Levy, P. E., Li, J., Lin, X., Lomas, M. R., Lu, M., Luo, Y., Ma, Y., Myneni, R. B., Poulter, B., Sun, Z., Wang, T., Viovy, N., Zaehle, S. and Zeng, N.: Evaluation of terrestrial carbon cycle models for their response to climate
vari-ability and to CO2trends, Glob. Change Biol., 19, 2117–2132, doi:10.1111/gcb.12187, 2013
Poulter, B., Frank, D. C., Hodson, E. L., and Zimmermann, N. E.: Impacts of land cover and climate data selection on un-derstanding terrestrial carbon dynamics and the CO2 airborne fraction, Biogeosciences, 8, 2027–2036, doi:10.5194/bg-8-2027-2011, 2011.
Qian, H., Joseph, R., and Zeng, N.: Enhanced terrestrial car-bon uptake in the Northern High Latitudes in the 21st century from the Coupled Carbon Cycle Climate Model Intercompari-son Project model projections, Glob. Change Biol., 16, 641–656, doi:10.1111/j.1365-2486.2009.01989.x, 2010.
Quillet, A., Peng, C., and Garneau, M.: Toward dynamic global vegetation models for simulating vegetation–climate interactions and feedbacks: recent developments, limitations, and future chal-lenges, Environ. Rev., 18, 333–353, doi:10.1139/A10-016, 2010. Ramankutty, N. and Foley, J. A.: ISLSCP II Potential Natural Vege-tation Cover, in: ISLSCP Initiative II Collection, Data set, edited by: Hall F. G., Collatz, G., Meeson, B., Los, S., Brown de Col-stoun, E., and Landis D., Oak Ridge National Laboratory Dis-tributed Active Archive Center, O ak Ridge, Tennessee, USA, doi:10.3334/ORNLDAAC/961, 2010.
Ruckstuhl, K. E., Johnson, E., and Miyanishi, K.: Introduction. The boreal forest and global change, Philos. T. Roy. Soc. Biol. Sci., 363, 2245–2249, doi:10.1098/rstb.2007.2196, 2008.
Rummukainen, M.: State-of-the-art with regional climate mod-els, Wiley Interdisciplinary Reviews, Climate Change, 1, 82–96, doi:10.1002/wcc.8, 2010.
Samuelsson, P., Gollvik, S., and Ullerstig, A.: The land-surface scheme of the Rossby Centre regional atmospheric climate model (RCA3), Reports Meteorol. Climatol., 12, p. 38, 2006. Samuelsson, P., Jones, C. G., WillÉN, U., Ullerstig, A., Gollvik,
S., Hansson, U. L. F., Jansson, C., KjellstrÖM, E., Nikulin, G., and Wyser, K.: The Rossby Centre Regional Climate model RCA3: model description and performance, Tellus A, 63, 4–23, doi:10.1111/j.1600-0870.2010.00478.x, 2011.
Seneviratne, S. I., Corti, T., Davin, E. L., Hirschi, M., Jaeger, E. B., Lehner, I., Orlowsky, B., and Teuling, A. J.: Investigating soil moisture–climate interactions in a changing climate: A review, Earth-Sci. Rev., 99, 125–161, doi:10.1016/j.earscirev.2010.02.004, 2010.
Schuur, E. A. G., Abbott, B. W., Bowden, W. B., Brovkin, V., Camill, P., Canadell, J. G., Chanton, J. P., Chapin III, F. S., Chris-tensen, T. R., Ciais, P., Crosby, B. T., Czimczik, C. I., Grosse, G., Harden, J., Hayes, D. J., Hugelius, G., Jastrow, J. D., Jones, J. B., Kleinen, T., Koven, C. D., Krinner, G., Kuhry, P., Lawrence, D. M., McGuire, A. D., Natali, S. M., O’Donnell, J. A., Ping, C. L., Riley, W. J., Rinke, A., Romanovsky, V. E., Sannel, A. B. K., Schädel, C., Schaefer, K., Sky, J., Subin, Z. M., Tarnocai, C., Turetsky, M. R., Waldrop, M. P., Walter Anthony, K. M., Wick-land, K. P., Wilson, C. J., and Zimov, S. A.: Expert assessment of vulnerability of permafrost carbon to climate change, Climatic Change, 119, 359–374, 2013.
Shuman, J. K., Shugart, H. H., and O’Halloran, T. L.: Sensitivity of Siberian larch forests to climate change, Glob. Change Biol., 17, 2370–2384, 2011.
dynam-2486.2008.01626.x, 2008.
Smith, B., Prentice, I. C., and Sykes, M. T.: Representation of vegetation dynamics in the modelling of terrestrial ecosystems: comparing two contrasting approaches within European climate space, Global Ecol. Biogeogr., 10, 621–637, doi:10.1046/j.1466-822X.2001.t01-1-00256.x, 2001.
Smith, B., Samuelsson, P., Wramneby, A., and Rummukainen, M.: A model of the coupled dynamics of climate, vegetation and terrestrial ecosystem biogeochemistry for regional applications, Tellus A, 63, 87–106, doi:10.1111/j.1600-0870.2010.00477.x, 2011.
Smith, B., Wårlind, D., Arneth, A., Hickler, T., Leadley, P., Silt-berg, J., and Zaehle, S.: Implications of incorporating N cy-cling and N limitations on primary production in an individual-based dynamic vegetation model, Biogeosciences, 11, 2027– 2054, doi:10.5194/bg-11-2027-2014, 2014.
Swann, A. L., Fung, I. Y., Levis, S., Bonan, G., and Doney, S.: Changes in Arctic vegetation induce high-latitude warming through the greenhouse effect, P. Natl. Acad. Sci. USA, 107, 1295–1300, doi:10.1073/pnas.0913846107, 2010.
Tape, K. E. N., Sturm, M., and Racine, C.: The evidence for shrub expansion in Northern Alaska and the Pan-Arctic, Glob. Change Biol., 12, 686–702, doi:10.1111/j.1365-2486.2006.01128.x, 2006.
Valentini, R., Matteucci, G., Dolman, A. J., Schulze, E. D., Reb-mann, C., Moors, E. J., Granier, A., Gross, P., Jensen, N. O., Pi-legaard, K., Lindroth, A., Grelle, A., Bernhofer, C., Grunwald, T., Aubinet, M., Ceulemans, R., Kowalski, A. S., Vesala, T., Rannik, U., Berbigier, P., Loustau, D., Gumundsson, J., Thorgeirsson, H., Ibrom, A., Morgenstern, K., Clement, R., Moncrieff, J., Montag-nani, L., Minerbi, S., and Jarvis, P. G.: Respiration as the main determinant of carbon balance in European forests, Nature, 404, 861–865, doi:10.1038/35009084, 2000.
backs increase future terrestrial ecosystem carbon uptake in an individual-based dynamic vegetation model, Biogeosciences Discuss., 11, 151–185, doi:10.5194/bgd-11-151-2014, 2014. Willmott, C. J. and Matsuura, K.: Smart interpolation of annually
averaged air temperature in the United States, J. Appl. Met., 34, 2577–2586, 1995.
Wolf, A., Callaghan, T., and Larson, K.: Future changes in vege-tation and ecosystem function of the Barents Region, Climatic Change, 87, 51–73, doi:10.1007/s10584-007-9342-4, 2008. Wramneby, A., Smith, B., and Samuelsson, P.: Hot spots
of vegetation-climate feedbacks under future green-house forcing in Europe, J. Geophys. Res., 115, D21119, doi:10.1029/2010jd014307, 2010.
Zaehle, S. and Dalmonech, D.: Carbon-nitrogen interactions on land at global scales: understanding in modelling climate biosphere feedbacks, Curr. Opin. Environ. Sustain., 3, 311–320, 2011. Zhang, W., Miller, P. A., Smith, B., Wania, R., Koenigk, T., and
Döscher, R.: Tundra shrubification and tree-line advance am-plify arctic climate warming: results from an individual-based dynamic vegetation model, Environ. Res. Lett., 8, 034023, doi:10.1088/1748-9326/8/3/034023, 2013.