Evolution of short- and medium-range order in the melt-quenching
Evolution of short- and medium-range order in the melt-quenching
amorphization of Ge2Sb2Te5
amorphization of Ge2Sb2Te5
Chong Qiao Fudan University
Y. R. Guo Fudan University
F. Dong
Fudan University
J. J. Wang Fudan University
H. Shen
Fudan University
See next page for additional authors
Follow this and additional works at: https://lib.dr.iastate.edu/ameslab_manuscripts Part of the Materials Chemistry Commons
Recommended Citation Recommended Citation
Qiao, Chong; Guo, Y. R.; Dong, F.; Wang, J. J.; Shen, H.; Wang, S. Y.; Xu, Ming; Miao, X. S.; Zheng, Y. X.; Zhang, R. J.; Chen, L. Y.; Wang, Cai-Zhuang; and Ho, Kai-Ming, "Evolution of short- and medium-range order in the melt-quenching amorphization of Ge2Sb2Te5" (2018). Ames Laboratory Accepted Manuscripts. 327.
https://lib.dr.iastate.edu/ameslab_manuscripts/327
This Article is brought to you for free and open access by the Ames Laboratory at Iowa State University Digital Repository. It has been accepted for inclusion in Ames Laboratory Accepted Manuscripts by an authorized
Phase-change memory takes advantage of the fast phase transition between amorphous and crystalline phases of phase-change materials (e.g., Ge2Sb2Te5 or GST). To date, while the “SET” process
(crystallization of GST glass) has been intensively studied, studies on the “RESET” process
(melt-quenching amorphization of GST) are still limited. In this work, we explored the structural changes of GST upon rapid cooling by ab initio molecular dynamics simulations and atomistic cluster alignment (ACA) analysis. Different from other methods which only focus on the nearest bonding atoms, the ACA method can study both the short- and medium-range order clusters containing atoms beyond the first-neighboring shell and enables us to explore the changes of cluster structures in a larger scale. The results reveal that low-coordinated octahedral clusters tend to become high-coordinated ones, and Ge-centered octahedral structures change to tetrahedrons whereas Sb-centered tetrahedrons transform to octahedral structures during the amorphization process. Interestingly, tetrahedrons show aggregation in liquid and supercooled liquid in contrast to 6-fold octahedrons which present notable aggregation in amorphous GST. Moreover, our study showed that wrong bonds (Ge–Ge, Sb–Sb, Ge–Sb and Te–Te bonds) can promote the
formation of large rings, and irreducible rings tend to separate into smaller and larger rings as the temperature is decreased. Our findings provide useful insights into the formation process and the structure of amorphous GST, which is valuable for facilitating the application of phase change materials.
Keywords Keywords
short-range structure, medium-range structure, amorphous, molecular dynamics
Disciplines Disciplines
Materials Chemistry
Authors Authors
Chong Qiao, Y. R. Guo, F. Dong, J. J. Wang, H. Shen, S. Y. Wang, Ming Xu, X. S. Miao, Y. X. Zheng, R. J. Zhang, L. Y. Chen, Cai-Zhuang Wang, and Kai-Ming Ho
Evolution of short- and medium-range order in melt-quenching amorphization of Ge2Sb2Te5
Journal: Journal of Materials Chemistry C
Manuscript ID TC-ART-02-2018-000549.R3 Article Type: Paper
Date Submitted by the Author: 10-Apr-2018
Complete List of Authors: Qiao, Chong; Fudan University, Department of Optical Science and Engineering Shanghai, CN
Guo, Y. R. ; Fudan University, Department of Optical Science and Engineering
Dong, Fei; Fudan University, Department of Optical Science and Engineering
Wang, Jinjin; Fudan University,
Shen, Hong; Fudan University, Department of Optical Science and Engineering
Wang, Songyou; Fudan University, Department of Optical Science and Engineering
Xu, Ming; Huazhong University of Science and Technology,
Miao, Xiangshui; Huazhong University of Science and Technology, School of Optical and Electronic Information
Zheng, Y. X. ; Fudan University, Department of Optical Science and Engineering
Zhang, Rongjun; Fudan University, Department of Optical Science and Engineering
Chen, Liangyao; Fudan University,
Wang, Cai Zhuang; Ames Laboratory-U.S. DOE, Physics and Astronomy Ho, Kai Ming; Ames Laboratory-U.S. DOE, Physics and Astronomy
1
Evolution of short- and medium-range order in melt-quenching
amorphization of Ge
2Sb
2Te
5Chong Qiao1, Y. R. Guo 1, F. Dong1, J. J. Wang1, H. Shen1, S.Y. Wang1,2,*, Ming Xu3,*, X. S. Miao3, Y. X. Zheng1, R. J. Zhang1, L. Y. Chen1, C. Z. Wang4 and K. M. Ho4
1Shanghai Ultra-Precision Optical Manufacturing Engineering Center and
Department of Optical Science and Engineering, Fudan University, Shanghai, 200433, China
2Key Laboratory for Information Science of Electromagnetic Waves (MoE), Shanghai
200433, China
3Wuhan National Research Center for Optoelectronics, School of Optical &
Electronic Information, Huazhong University of Science & Technology, Wuhan, 430074, China
4Ames Laboratory, U. S. Department of Energy and Department of Physics and
Astronomy, Iowa State University, Ames, Iowa 50011, USA
Corresponding Authors
*Email: [email protected] ; [email protected]
Abstract
Phase-change memory takes advantage of fast phase transition between amorphous
and crystalline phases of the phase-change materials (e.g., Ge2Sb2Te5 or GST). To
date, while the “SET” process (crystallization of GST glass) has been intensively
studied, studies of “RESET” process (melt-quenching amorphization of GST) are still
limited. In this work, we explored the structural changes of GST upon rapid cooling
by ab initio molecular dynamics simulations and an atomistic cluster alignment (ACA)
analysis. Different from other methods which only focus on the nearest bonding
atoms, the ACA method can study both the short- and medium-range order clusters
containing atoms beyond the first-neighbor shell and enables us to explore the
changes of cluster structures in a larger scale. The results reveal that the
low-coordinated octahedral clusters tend to become high-coordinated ones, and
Ge-centered octahedral structures change to tetrahedrons whereas Sb-centered
tetrahedrons transform to octahedral structures during the amorphization process.
2
contrast to the 6-fold octahedrons which present a notable aggregation in amorphous
GST. Moreover, our study showed that wrong bonds (Ge-Ge, Sb-Sb, Ge-Sb and Te-Te
bonds) can promote the formation of large rings, and irreducible rings tend to separate
into smaller and larger rings as the temperature is decreased. Our findings provide
useful insights into the formation process and the structure of amorphous GST, which
is valuable for facilitating the application of phase change materials.
Keywords:
short-range structure, medium-range structure, amorphous, moleculardynamics
Introduction
Switching of materials properties can be utilized to record information in memory
devices.1-7 Ge2Sb2Te5 (GST), as a prototypical phase-change memory material (PCM),
is widely utilized in nonvolatile memory devices such as random access memory
(RAM),5-12 due to its rapid and reversible change between crystalline and amorphous
phases. In past decades, the mechanism of the rapid crystallization of GST glass (i.e.,
the “SET” process) has been intensively studied, because the crystallization rate
determines the writing speed of the data storage.13-16 However, the “RESET” process
(i.e., glass forming from the melt), which determines the power-consumption of the
memory devices, appears to be less focused on.
The GST presents three structures under ambient conditions, namely, the stable
hexagonal phase,17-19 the metastable rocksalt structure20, 21 and the amorphous state.13,
19, 20
The GST glass is amorphized from the liquid state which has high similarity, yet
with salient difference, to the amorphous structure, as advocated by Kolobov.22
Through simulations and experiments, Schumacher et al. noticed that the viscosity of
liquid GST exhibits Arrhenius behavior in the equilibrium as well as in the weakly
supercooled liquid state.23 As for the amorphous structure of GST, recent studies
revealed that the local environment of Ge and Sb is usually distorted octahedrons in
3
global valence alternation was applied to explain such bonds in amorphous GST.27 A
further study discovered the coexistence of tetrahedral- and octahedral motifs in
amorphous phase change materials, e.g., one third of Ge atoms are in the tetrahedral
environment while the other atoms show a defective octahedral environment.28 In
addition, using an analytical methods based on electron charge density, the
chemical-bonding network and lone pair electrons (i.e., a pair of unbonded electrons)
have also been investigated to explore the structural order of amorphous GST.29
Although these reports provide helpful information about the liquid and amorphous
GST, the studies on the melt-quenching evolution of local structures are still
insufficient.
In order to gain more details about the structures of liquid and amorphous GST, in
this paper, we performed ab initio molecular dynamics simulations and analyzed the
evolution of short- and medium-range order using an atomistic cluster alignment
(ACA) method.30 We show the changes of cluster structures and quantitatively
determine the fraction of octahedron and tetrahedron in GST during the fast cooling
process. Furthermore, we find that tetrahedrons present an aggregation behavior in
liquid and supercooled states but are randomly distributed in amorphous state,
whereas the octahedrons show an aggregation phenomenon only in amorphous state.
Finally, ABAB and irreducible rings are also studied under amorphization process.
Our results contribute to a better understanding of the glass-forming ability of GST
and have implications on the design of low-power-consumption PCMs.
Methods
The ab initio molecular dynamics (AIMD) simulations have been performed using
the Vienna ab initio simulation package (VASP) program based on the density
functional theory,31, 32 with the projector-augmented wave method33, 34 and the
Perdew-Burke-Ernzerhof generalized gradient approximation (GGA-PBE) for the
exchange-correlation energy functional.35 The initial simulation cell was a cubic
4
in the Brillouin zone in the AIMD simulations. The simulations were carried out at a
canonical ensemble (i.e., constant number of particle, constant volume, and constant
temperature (NVT) ensemble) with the periodic boundary conditions. The
temperature was controlled by the Nose-Hoover thermostat.36, 37 At the beginning of
the simulation, the system was heated to 2000 K and relaxed for 30 ps in order to
remove the memory effect from the initial configuration. Then, the temperature of
GST was cooled down to 300 K quickly with a constant cooling rate of 0.1 K/step.
The time step was set to 3 fs. Then the configurations at the temperatures of 1273,
1073, 900, 773, 623, 473 and 300 K respectively were sampled to investigate the
structural properties of GST. Each sample was relaxed for 6000 MD steps at the
sampled temperature to bring the system to equilibrium, and the size of simulation
cell was adjusted to ensure that the internal pressure of the system was close to zero.
6000 trajectories at each sample temperature were utilized to study the structural
changes in GST from liquid to amorphous state.
In this work, the ACA method,30 which is an effective and convenient tool to
investigate the short- and medium-range arrangements in liquids and glasses,38-42 was
applied to explore the structural orders of GST in different states. The short-range
order (SRO) characters are classified by two types of alignment schemes. (1) The
collective alignment is the first type of ACA method, e.g., a lot of clusters (center
atom and its neighboring atoms) composed of the same number of atoms are selected
randomly from the system, then center atoms of all the selected clusters are put in a
same position and they are rigidly rotated to minimize the overall mean-square
distances between different clusters. Finally, the average short-range structure is
obtained with a proper isosurface value. (2) Individual cluster-template alignment is
utilized to further classify the system into various types of short-range structures
according to the similarity between selected cluster and given templates. In a typical
run of individual cluster-template alignment, the template is fixed, and the selected
single cluster is randomly rotated to minimize the mean-square distance between
template and selected cluster. A direct parameter called “structure fitting score f” is
5 2 2 , 1,..., min C
T C T
C n
r r
=
∆ = ∆ (1)
2 1 1 min T n T T T f r n = = ∆
∑
(2)where ∆, is the distance between atom C in cluster and atom T in template. ∆ is
the minimal square distance between atom T in the template and all C atoms in the
cluster. Structure fitting score f characterizes the difference between the template
(usually an undistorted octahedron or tetrahedron for GST) and the real clusters, e.g.,
f=0 indicates that the selected cluster has exactly the same structure to the template,
and a larger f means the selected cluster has more deviation from the template. For
each template, by summarizing all the clusters with the structure fitting score f less
than a “cutoff”, we can calculate how many clusters that resemble the template
structure. The selection of the f cutoff may has some impact on the final results, e.g.,
larger cutoff will include more cluters with larger distortion. In our ACA analysis, we
choose f = 0.2 as the cutoff so that most of relevant clusters, even with moderate
distortions, are counted in. Detail procedures of both alignments can be found in Ref
30.
Results and Discussion
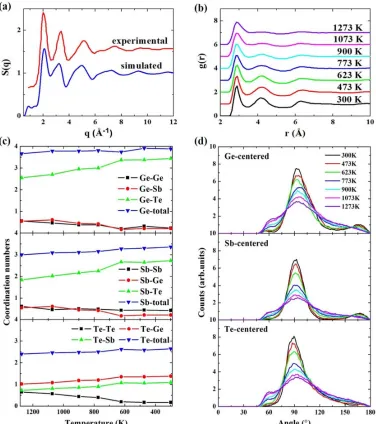
Figure 1(a) plots the structure factors of GST at 300 K obtained from our
simulation which are in good agreement with x-ray diffraction data.43-45 Figure 1(b)
plots the total pair correlation function (PCF) of GST at different temperatures. The
first peak of the PCF at 1273 K locates at the vicinity of 2.87 Å. As the temperature
decreases to 300 K gradually, the first peak shifts slightly to the left but its amplitude
increases remarkably, indicating that the local structure becomes more well-defined.
Similar to previous studies,23, 25, 46-48 the second and third peaks are observed below
6
temperature, demonstrating that there are strong short- and medium-range49 orders
(MRO) in amorphous GST. Figure 1(c) shows the coordination numbers (CNs) of
different type of atoms in GST with a cutoff distance of 3.2 Å. With the decreasing
temperature, total CNs of Ge, Sb and Te atoms slightly increase to 3.88, 3.36 and 2.64
at 300 K, respectively, probably because that the liquid has low Peierls distortion and
a uniform distance cutoff has excluded more atoms in liquid.50 These values, closing
to the previous report,48 follow the “8 – N rule”.51-53 By analyzing the partial CNs, it
is found that Ge and Sb atoms tend to connect with Te atoms, indicating an ABAB
arrangement17, 18 in the amorphous GST. Figure 1(d) shows the bond-angle
distributions (BAD) of GST during the quenching process with a cutoff distance of
3.2 Å. In agreement with the previous studies,24, 25, 27, 28, 45, 48, 54 the notable peaks of
BADs for Ge, Sb and Te atoms locate at the vicinity of 90°, reminding us of the
octahedral structures. As the temperature decreases, the peaks become stronger,
indicating an increase in local octahedral order. The small peaks at the vicinity of 170°
of BAD for Ge and Sb atoms reveal the distorted octahedral-like structure. As for the
small shoulder at the vicinity of 60° of BAD, it suggests a triangular configuration25
which tends to disappear eventually with the decreasing temperature.
To explore the short-range structure of GST, the ACA method,30 which is utilized to
explore the average structure in liquids and glasses by describing the local atomic
packing, is applied. Collective alignment is the first part of the ACA method, here
3000 clusters, each consists of one center atom and six nearest atoms, are randomly
selected from the simulation trajectories and are aligned with each other to minimize
the overall mean-square distances between different clusters by rigid rotation and
relative translation. By classifying the clusters according to the chemical constituent
of the center atom in cluster, the common structural motifs describing the local
environment of a given chemical constituent are obtained. For example, the common
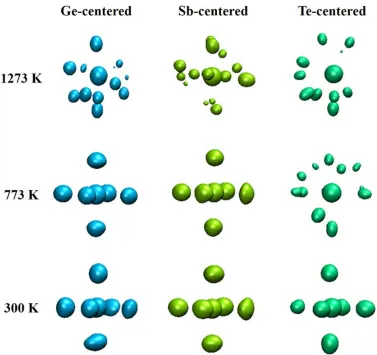
structures centered Ge, Sb and Te atoms at 1273, 773 and 300 K are shown in Figure
2, respectively. At 1273 K, all Ge-, Sb- and Te-centered clusters are in the disordered
configurations, suggesting that there are no uniform SROs in the nearest-neighbor
7
contours of Ge- and Sb-centered clusters present the octahedral patterns, indicating
that Ge- and Sb-centered clusters begin to form octahedral configurations, but that of
Te-centered cluster still presents a disorder state, illustrating Te atoms are more fragile
when they connect with neighboring atoms and form local structure. When the
temperature decreases to 300 K, the contours of Ge- and Sb-centered clusters become
larger, demonstrating that more octahedral configurations have formed. Eventually,
the contour of Te-centered cluster changes to an octahedral structure as well. We note
that although all of the clusters tend to adopt the octahedral configurations at 300 K,
the size and shape of atomic-density contour after alignment is different in different
centered clusters, suggesting that there are some defects in the clusters such as
vacancies and distortions.
Template alignment is the other part of ACA method, which can quantitatively
determine the proportions of the SROs by comparing the similarity between template
structure and selected clusters.30 In previous studies,22, 28 it is demonstrated that
amorphous GST is composed of tetrahedral- and octahedral-like motifs, and
amorphous and liquid GST have a similar SRO. In collective alignment part, we
realize that the existence of vacancies may lead to defective octahedral-like SRO.
Therefore, in our work, we build five templates (i.e., tetrahedron and 3-fold, 4-fold,
5-fold and 6-fold octahedrons) to explore the changes of tetrahedral- and
octahedral-like SROs in the cooling process. In most of the previous studies in
literatures,25, 27, 48 bonding atoms (usually within a fixed cutoff distance) are mainly
focused on exploring the SRO of GST. The clusters used in ACA analysis can reach
neighbors beyond first neighboring shell so that it can better detect the changes of
SRO or even MRO. Therefore, template alignment is an effective tool to explore the
changes of short-range structures in GST during the cooling process.
Different from the analysis method with a fixed cutoff distance (as shown in
Figures 1(c) and (d)), ACA method can study the local structure in a larger scale, so it
provides us a new perspective on the SROs. Figure 3(a) displays the five templates
(tetrahedron, 3-, 4- and 5-fold defective octahedrons and 6-fold octahedron) used to
8
Te-centered SROs at different temperatures. Changes in the fractions of SROs are
relative small from 1273 K to 900 K and 623 K to 300 K whereas they become
notable from 900 K to 623 K, indicating that the structural changes primarily take
place in this temperature range. In Figure 3(b), GST consists of mainly 3-, 4- and
5-fold defective octahedrons and tetrahedrons at 1273 K, with the fractions of 27.6%,
49.5%, 12.2% and 7.3%, respectively, indicating that defective octahedrons are the
major theme in liquid GST and these octahedral motifs are mainly low-coordinated
such as 3- and 4-fold ones. As the temperature decreases from 1273 K to 300 K, the
fractions of 3- and 4-fold defective octahedrons are decreased to 13.1% and 39.7%,
whereas the fractions of 5- and 6-fold octahedrons are increased to 25.1% and 13.0%,
respectively, showing that the low-coordinated (3- and 4-fold) octahedrons present a
tendency to become to the high-coordinated (5- and 6-fold) ones. As for tetrahedrons,
the fraction reaches 8.4% at 300 K. In the whole cooling process, the fraction of total
octahedral structures (sum of 3-, 4-, 5- and 6-fold octahedrons) remains ~90.5% and
that of tetrahedrons stays around 8.0%, revealing that both liquid and amorphous GST
are mainly composed of octahedral structures with only a small fraction of tetrahedron.
Local structures other than octahedrons and tetrahedrons also exist, but they make up
less than 2%.
The fractions of Ge-centered SROs with temperatures are shown in Figure 3(c). In
the cooling process from 1273 K to 300 K, the fraction of 3-fold octahedron
disappears gradually and that of 4-fold octahedron is decreased from 49.4% to 16.4%,
while that of 5-fold octahedron is increased from 14.8% to 31.1% and that of 6-fold
octahedron is increased to 26%. As a whole, the fraction of total Ge-centered
octahedrons is decreased from 82.5% to 74.1%. As for the tetrahedrons, the fraction is
increased from 16.7% to 25.9%, which is close to the value (27%) reported by
Caravati45 but a little smaller than his previous report with a value of 33%.28 Then it is
inferred that some Ge-centered octahedral clusters transform to Ge-centered
tetrahedrons during the amorphization process.
Figure 3(d) shows the fractions of Sb-centered SROs at different temperatures. As
9
presents a decreasing tendency in contrast to the increasing trend presented in
Ge-centered SROs, the evolution trends of other four Sb-centered SROs show the
similar tendencies to those of Ge-centered SROs. 3-fold octahedrons disappear
gradually, the fraction of 4-fold octahedron is decreased from 52.7% to 27.3% with an
abruptly decrease between 773 K and 623 K, while that of 5-fold octahedron is
increased from 17.1% to 38.7% and that of 6-fold octahedron is increased to 28.9%
with a notable increase between 773 K and 623 K, demonstrating that many 4-fold
octahedrons change to 5- and 6-fold octahedrons in this stage. As for tetrahedrons, the
fraction is decreased from 7.4% to zero, indicating that there is no Sb-centered
tetrahedron in amorphous GST, in line with the previous study.28 At the same time, the
fraction of total Sb-centered octahedrons is increased from 92.1% to 97.5%,
illustrating that Sb-centered tetrahedrons change to octahedral structures in the fast
cooling process.
The fractions of Te-centered SROs from 1273 K to 300 K are shown in Figure 3(e).
Only the fractions of 3- and 5-fold octahedrons present a similar evolution
phenomenon to those of Ge- and Sb-centered configurations, the fraction of 3-fold
octahedron is decreased from 35% to 22.2% while that of 5-fold octahedron is
increased from 9.1% to 17.2%. Contrary to the trend in Ge- and Sb-centered SROs,
the fraction of 4-fold octahedron is increased from 48.2% to 53.9%. As for
tetrahedron and 6-fold octahedron, both of the fractions are close to zero in the
cooling process. The fraction of total Te-centered octahedrons is of ~93% during the
whole cooling process, indicating that 3-fold octahedral structures change to 4- and
5-fold octahedral structures with the decreasing temperature.
By comparing the evolution of Ge-, Sb- and Te-centered SROs shown in Figures
3(c), (d) and (e) in the fast cooling process, we find that 3- and 4-fold octahedrons in
Ge- and Sb-centered clusters change to 5- and 6-fold octahedrons, and 3-fold
octahedrons in Te-centered clusters change to 4- and 5-fold octahedrons. It is revealed
that the low-coordinated octahedrons present a trend to change to high-coordinated
octahedrons under the amorphization process. Additionally, total Ge-centered
10
increase due to disappearance of tetrahedron, while total Te-centered octahedrons
maintain a stable proportion. The most notable feature is that substantial Ge-centered
octahedral sites transform to Ge-centered tetrahedrons while Sb-centered tetrahedrons
change to Sb-centered octahedral-like structures during the amorphization process.
Figure 4 displays the spatial distribution of tetrahedrons and 6-fold octahedrons (i.e.,
intact octahedrons without vacancies) obtained from ACA method at different
temperatures. At 1273 K, most Ge-centered tetrahedrons consist of one center Ge
atom and four neighboring Te atoms, presenting sp3 hybridization. There is a large
probability that Te atoms are replaced by Ge and Sb atoms, forming the so called
“wrong bonds” (Ge-Ge, Sb-Sb, Ge-Sb and Te-Te bonds).51, 55, 56 Interestingly, a few
Sb-centered clusters also present the tetrahedral-like structure, in which the center Sb
atoms tend to bond to Ge or Sb atoms, in line with the model proposed by Lee
recently.29 At 773 K, apart from Ge- and Sb-centered tetrahedrons, Ge- and
Sb-centered 6-fold octahedrons are also obtained, they tend to bond to Te atoms with
few wrong bonds. At 300 K, Sb-centered tetrahedrons disappear and only a few
Ge-centered tetrahedrons survive, very similar to the results from previous study.28
This is because the Ge-Te bonds with sp3 hybridization is relative stable. In 6-fold
octahedral structures, wrong bonds still exist, and apparently they play an important
role in SRO and MRO in GST.
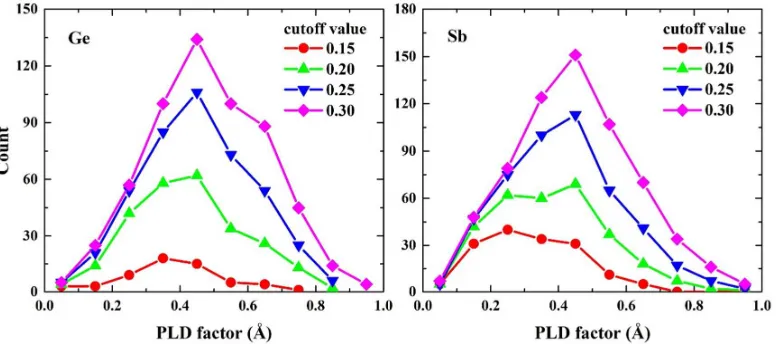
As the Peierls-like distortion (PLD) is one of the major structural features in phase
change materials,57-59 we also study it in the 6-fold octahedrons with different cutoff
values of structure fitting scores, as shown in Figure 5. Here the PLD factor is
obtained by averaging the differences of long- and short-bonds in the diagonal lines of
each octahedron (e.g. a PLD factor of 0.5 Å means that the 6-fold octahedron is
distorted to the extent that the “long bonds” are averagely longer than the collinear
“short bonds” by 0.5 Å), and then the average PLD factor is used to characterize the
distortion of each 6-fold octahedral cluster. Larger PLD factor indicates more severe
distortion of central atoms in the clusters. As the cutoff value of structure fitting score
increases, more 6-fold octahedral clusters are counted, and these newly included
11
distortion factors of Ge- and Sb-centered 6-fold octahedral structures concentrate at
the vicinity of 0.45 Å, in line with the previous reports.57, 58 This indicates that even
though the shape of octahedral clusters may vary (characterized by different structure
fitting scores), the intrinsic PLD remains at the same level and thus they may equally
contribute to a similar band gap. Therefore, the PLD factor derived from ACA method
can effectively reflect the distortion of local structure in amorphous GST and its
electronic structure.
Traditionally, a fixed distance cutoff is used to determine the chemical environment
for each atom. Very differently, the ACA method innovatively uses some standard
templates to match with the clusters in atomic models. The selected clusters are
allowed to bear some differences from the templates by setting a threshold of the
structure fitting score. The selection of this threshold cutoff is very important, yet
quite artificial. Despite of this drawback, ACA method is still an effective and
innovative tool to analyze the structure of materials, particularly the liquid and
amorphous systems.
To explore the evolution of medium-range order in GST upon quenching, Figures
6(a)-(c) show the connectivity of the center atoms of tetrahedrons and 6-fold
octahedrons, with a cutoff distance of 5.2 Å which is at the vicinity of second valley
of total pair correlation function. Figures 6(d)-(f) present the relationship of clusters
corresponding to Figures 6(a)-(c), respectively. At 1273 K, there is no 6-fold
octahedron, only tetrahedral clusters are observed in the simulation cell and most of
them connect with each other to form a longer chain, indicating an obvious
aggregation phenomenon, as seen in Figure 6(a). The tetrahedrons are connected by
two ways: sharing a vertex or an edge (two vertices), and a larger MRO structure is
formed by random combination of these two connecting ways, as shown in Figure
6(d). At 773 K, although the positions of tetrahedrons are different from the case at
1273 K, the clusters are still aggregated, and a few of 6-fold octahedrons are formed
around the tetrahedral clusters, as seen in Figure 6(b). Among the MRO structures,
tetrahedrons are connected by sharing a vertex, center atom or an edge, octahedrons
12
connected by sharing central atom, a vertex or an edge, as shown in Figure 6(e).
When the temperature decreases to 300 K, many more 6-fold octahedrons emerge and
their size is still growing. The left-over tetrahedrons tend to connect with the larger
clusters in a random distribution, as displayed in Figure 6(c). Further analysis of the
relationship of tetrahedrons and 6-fold octahedrons at 300 K demonstrates: (1)
tetrahedrons connect with each other only by vertices, (2) octahedrons connect with
other octahedrons by sharing a vertex, an edge or a surface (three vertices), and (3)
tetrahedrons connect with octahedrons by sharing a vertex, an edge or center atom, as
shown in Figure 6(f). Same to the previous simulations,25, 28, 45 the element
aggregation is not observed, it is probably due to the limitation of supercell and
simulation time. To summarize, we observe a large aggregation of tetrahedrons in the
high temperature liquid (1273 K) and supercooled liquid (773 K) by sharing the
vertex, edge or center atom, but these tetrahedrons are sparsely distributed in the
amorphous state. In contrast, the number of 6-fold octahedrons grows fast upon
cooling and they tend to connect with each other to complete the nucleation process.
To further explore the MRO structure in GST upon quenching, ring statistics are
analyzed using a cutoff distance of 3.2 Å. Figure 7(a) shows the evolution of ABAB
ring with temperature, where 4- and 6-membered rings are found to be dominated,
suggesting that heteropolar bonds tend to form the specific short-range structure,
similar to the previous report.25 To investigate the effect of wrong bonds on the MRO
in the disorder GST, irreducible rings at 1273 K, 773 K and 300 K are also studied
using the ring statistics analysis code,60 as the results are shown in Figures 7(b), (c)
and (d), respectively. It can be seen that rings vary from 3-membered ring to
20-membered ring regardless of temperature, indicating the existence of short- and
medium-range orders. Compare the irreducible rings to ABAB rings, apart from the
short rings, many large rings (such as 9- to 20-membered rings) are also observed,
suggesting that homopolar bonds play an inevitable role in MRO. At 1273 K, rings
from 3-membered to 5-membered are in a large weight while the fractions of rings
from 6- to 20-membered are relative small, as seen in Figure 7(b). When the
13
of 6-membered rings increases notably. At this temperature, the fractions of 4-, 5- and
6-membered rings are the largest ones while that of 7- to 20-membered rings are very
small, as shown in Figure 7(c). As the temperature decreases to 300 K, 3-membered
rings almost disappear, while 4- to 6-membered rings possess an even larger weight.
More interestingly, there is a small spike for the 15- to 17-membered rings, as shown
in Figure 7(d). A similar phenomenon is also observed in a previous literature,61 and
this is probably due to the presence of nanocavities.24, 62 Hence, the irreducible rings
present two opposite trends under amorphization process, i.e., to become smaller rings
or to change into larger ones. Additionally, it is noticed that 5-membered rings always
have a large weight in the cooling process, indicating that wrong bonds also play an
importance role in SROs.25, 63
Mean square displacement (MSD) is usually utilized to characterize atomic
mobility. The MSD as a function of time is defined as follows:
( )
22 1 1 ( ) ( ) N i i i
R t R t R
N
α
α α α
α
τ
τ
=
=
∑
+ − (3)where Nα is the number of α atoms, Riα are the coordinates of atom i, and τ is the
arbitrary origin of time. The MSD of total, Ge, Sb and Te atoms at different
temperatures are shown in Figure 8, and all of them exhibit a nearly linear behavior in
the liquid and supercooled liquid states. As the temperature decreases, the slope of
MSD decreases, indicating that atomic mobility is reduced in cooling process. By
comparing the MSD of Ge, Sb and Te atoms, we find that Ge atom moves fastest in
liquid (above 900 K) and supercooled liquid (from 623 K to 900 K) GST, and Sb is
the slowest in liquid whereas Te becomes the slowest in supercooled liquid. The
diffusion coefficients are computed by the Einstein formula as follows:
( )
2 1
lim 6 t
D R t
t →∞ α
∂ =
∂ (4)
Furthermore, diffusion coefficients also follow the Arrhenius equation:
0exp B E D D k T α = −
(5)
14
the Boltzmann constant. The relation between lnD and 1/T is shown in Figure 9. lnD
decreases with 1/T, implying that calculated diffusion coefficient decreases with the
decreasing temperature. Using the linear fitting, we obtain the pre-exponential factors
and activation energies of liquid GST, respectively. The calculated pre-exponential
factor and activation energy are 1.42×10⁻⁷ m2/s and 0.33 eV between 1273 K and 523
K, respectively. As the temperature decreases continuously, the calculated
pre-exponential factor and activation energy become 0.009×10⁻⁷ m2/s and 0.08 eV,
respectively, indicating the liquid turns into glass eventually.
Conclusions
In conclusion, by using first-principles calculations with the ACA analysis method,
we have investigated changes of short- and medium-range structures in phase change
material GST upon rapid cooling. Different from previous studies, the clusters
selected for ACA analysis go beyond the first neighboring shell atoms, so that the
SRO in GST can be better characterized. As the temperature decreases, we find that
the low-coordinated octahedrons tend to become the high-coordinated ones upon
cooling. It is also found that Ge-centered octahedral structures change to tetrahedron
while Sb-centered tetrahedrons transfer to octahedral structures in the formation
process of amorphous GST, and Ge-centered tetrahedrons in amorphous GST possess
a fraction of 25.9% in Ge-centered configurations. Furthermore, we find that
tetrahedrons show an aggregation in liquid and supercooled liquid but exhibit a
random distribution in amorphous. By contrast, 6-fold octahedrons show a random
distribution in supercooled liquid but an obvious aggregation in amorphous state.
Specifically, tetrahedrons connect with each other directly in many ways to form a
larger cluster in both liquid and supercooled liquid. While in the amorphous state,
6-fold octahedrons are connected with each other and also connected with
tetrahedrons. Finally, the ABAB and irreducible rings are investigated in the fast
cooling process, we realize that wrong bonds can promote the formation of large rings,
15
temperature is decreased. Our study can promote the knowledge of the formation
process and structure of amorphous GST, and the analysis method can be applied to
more phase change materials.
Acknowledgments
Work at Fudan University was supported by the NSF of China (Grant No. 11374055
and 61427815) and the Fudan High-end computing center. M.X. acknowledges
National Key R&D Plan of China (Grant No. 2017YFB0701700 “Materials Genome
Engineering”). Work at Ames Laboratory was supported by the US Department of
Energy, Basic Energy Sciences, and Division of Materials Science and Engineering,
including a grant of computer time at the National Energy Research Scientific
Computing Centre (NERSC) in Berkeley, CA under. Ames Laboratory is operated for
the U.S. DOE by Iowa State University under contract # DE-AC02-07CH11358.
References
1. H. Nili, S. Walia, S. Balendhran, D. B. Strukov, M. Bhaskaran and S. Sriram, Adv. Funct. Mater.,
2014, 24, 6741-6750.
2. H. Nili, S. Walia, A. E. Kandjani, R. Ramanathan, P. Gutruf, T. Ahmed, S. Balendhran, V. Bansal,
D. B. Strukov, O. Kavehei, M. Bhaskaran and S. Sriram, Adv. Funct. Mater., 2015, 25,
3172-3182.
3. H. Nili, T. Ahmed, S. Walia, R. Ramanathan, A. E. Kandjani, S. Rubanov, J. Kim, O. Kavehei, V.
Bansal, M. Bhaskaran and S. Sriram, Nanotechnology, 2016, 27, 505210.
4. T. Ahmed, S. Walia, J. Kim, H. Nili, R. Ramanathan, E. L. H. Mayes, D. W. M. Lau, O. Kavehei, V.
Bansal, M. Bhaskaran and S. Sriram, Nanoscale, 2017, 9, 14690-14702.
5. S. R. Ovshinsky, Phys. Rev. Lett., 1968, 21, 1450-1453.
6. J. Feinleib, J. Deneufville, S. C. Moss and S. R. Ovshinsky, Appl. Phys. Lett., 1971, 18, 254-257. 7. A. Pirovano, A. L. Lacaita, A. Benvenuti, F. Pellizzer and R. Bez, Ieee T. Electron Dev., 2004, 51,
452-459.
8. M. H. R. Lankhorst, B. Ketelaars and R. A. M. Wolters, Nat. Mater., 2005, 4, 347-352.
9. M. Wuttig and N. Yamada, Nat. Mater., 2007, 6, 824-832.
10. S. Raoux, G. W. Burr, M. J. Breitwisch, C. T. Rettner, Y. C. Chen, R. M. Shelby, M. Salinga, D.
Krebs, S. H. Chen, H. L. Lung and C. H. Lam, Ibm J. Res. Dev., 2008, 52, 465-479.
11. G. W. Burr, M. J. Breitwisch, M. Franceschini, D. Garetto, K. Gopalakrishnan, B. Jackson, B.
16 Technol. B, 2010, 28, 223-262.
12. S. Raoux, W. Welnic and D. Ielmini, Chem. Rev., 2010, 110, 240-267.
13. A. V. Kolobov, P. Fons, A. I. Frenkel, A. L. Ankudinov, J. Tominaga and T. Uruga, Nat. Mater.,
2004, 3, 703-708.
14. D. Loke, T. H. Lee, W. J. Wang, L. P. Shi, R. Zhao, Y. C. Yeo, T. C. Chong and S. R. Elliott, Science,
2012, 336, 1566-1569.
15. J. Orava, A. L. Greer, B. Gholipour, D. W. Hewak and C. E. Smith, Nat. Mater., 2012, 11,
279-283.
16. F. Rao, K. Ding, Y. Zhou, Y. Zheng, M. Xia, S. Lv, Z. Song, S. Feng, I. Ronneberger, R. Mazzarello,
W. Zhang and E. Ma, Science 2017, 358, 1423-1426.
17. B. J. Kooi and J. T. M. De Hosson, J. Appl. Phys., 2002, 92, 3584-3590.
18. Z. M. Sun, J. Zhou and R. Ahuja, Phys. Rev. Lett., 2006, 96, 055507.
19. J. L. F. Da Silva, A. Walsh and H. Lee, Phys. Rev. B, 2008, 78, 224111.
20. N. Yamada and T. Matsunaga, J. Appl. Phys., 2000, 88, 7020-7028.
21. X. Q. Liu, X. B. Li, L. Zhang, Y. Q. Cheng, Z. G. Yan, M. Xu, X. D. Han, S. B. Zhang, Z. Zhang and E.
Ma, Phys. Rev. Lett., 2011, 106, 025501.
22. A. V. Kolobov, P. Fons, M. Krbal, R. E. Simpson, S. Hosokawa, T. Uruga, H. Tanida and J.
Tominaga, Appl. Phys. Lett., 2009, 95, 241902.
23. M. Schumacher, H. Weber, P. Jovari, Y. Tsuchiya, T. G. A. Youngs, I. Kaban and R. Mazzarello,
Sci. Rep., 2016, 6, 27434.
24. J. Akola and R. O. Jones, Phys. Rev. B, 2007, 76, 235201.
25. J. Akola and R. O. Jones, J. Phys.: Condens. Matter, 2008, 20, 465103.
26. N.-K. Chen, X.-B. Li, X.-P. Wang, W. Q. Tian, S. Zhang and H.-B. Sun, Acta Mater., 2018, 143,
102-106.
27. M. Xu, Y. Q. Cheng, H. W. Sheng and E. Ma, Phys. Rev. Lett., 2009, 103, 195502.
28. S. Caravati, M. Bernasconi, T. D. K hne, M. Krack and M. Parrinello, Appl. Phys. Lett., 2007, 91, 171906.
29. T. H. Lee and S. R. Elliott, Adv. Mater., 2017, 29, 1700814.
30. X. W. Fang, C. Z. Wang, Y. X. Yao, Z. J. Ding and K. M. Ho, Phys. Rev. B, 2010, 82, 184204
31. G. Kresse and J. Hafner, Phys. Rev. B, 1993, 47, 558-561.
32. G. Kresse and J. Furthmuller, Comp. Mater. Sci., 1996, 6, 15-50. 33. P. E. Blochl, Phys. Rev. B, 1994, 50, 17953-17979.
34. G. Kresse and D. Joubert, Phys. Rev. B, 1999, 59, 1758-1775.
35. J. P. Perdew, K. Burke and M. Ernzerhof, Phys. Rev. Lett., 1996, 77, 3865-3868.
36. W. G. Hoover, Phys. Rev. A, 1985, 31, 1695-1697. 37. S. Nose, J. Chem. Phys., 1984, 81, 511-519.
38. L. H. Xiong, K. Chen, F. S. Ke, H. B. Lou, G. Q. Yue, B. Shen, F. Dong, S. Y. Wang, L. Y. Chen, C. Z.
Wang, K. M. Ho, X. D. Wang, L. H. Lai, H. L. Xie, T. Q. Xiao and J. Z. Jiang, Acta Mater., 2015, 92,
109-116.
39. M. Wu, J. S. Tse, S. Y. Wang, C. Z. Wang and J. Z. Jiang, Nat. Commun., 2015, 6, 6493.
40. Y. Zhang, C. Z. Wang, M. I. Mendelev, F. Zhang, M. J. Kramer and K. M. Ho, Phys. Rev. B, 2015,
91, 180201.
41. L. H. Xiong, X. D. Wang, Q. Yu, H. Zhang, F. Zhang, Y. Sun, Q. P. Cao, H. L. Xie, T. Q. Xiao, D. X.
17
42. X.-D. Wang and J.-Z. Jiang, Adv. Mater., 2017, 29, 1703136.
43. S. Kohara, K. Kato, S. Kimura, H. Tanaka, T. Usuki, K. Suzuya, H. Tanaka, Y. Moritomo, T.
Matsunaga, N. Yamada, Y. Tanaka, H. Suematsu and M. Takata, Appl. Phys. Lett., 2006, 89,
201910.
44. W. Zhang, V. L. Deringer, R. Dronskowski, R. Mazzarello, E. Ma and M. Wuttig, Mrs Bull., 2015,
40, 856-869.
45. S. Caravati, M. Bernasconi, T. D. Kuehne, M. Krack and M. Parrinello, J. Phys.: Condens. Matter,
2009, 21, 255501.
46. C. Steimer, V. Coulet, W. Welnic, H. Dieker, R. Detemple, C. Bichara, B. Beuneu, J.-P. Gaspard
and M. Wuttig, Adv. Mater., 2008, 20, 4535-4540.
47. J. Hegedus and S. R. Elliott, Nat. Mater., 2008, 7, 399-405.
48. E. Cho, J. Im, C. Park, W. J. Son, D. H. Kim, H. Horii, J. Ihm and S. Han, J. Phys.: Condens. Matter,
2010, 22, 205504.
49. S. R. Elliott, Nature, 1991, 354, 445-452.
50. M. Delheusy, J. Y. Raty, R. Detemple, W. Welnic, M. Wuttig and J. P. Gaspard, Physica B, 2004,
350, e1055–e1057.
51. P. Jovari, I. Kaban, J. Steiner, B. Beuneu, A. Schops and A. Webb, J. Phys.: Condens. Matter,
2007, 19, 335212.
52. P. Jovari, I. Kaban, J. Steiner, B. Beuneu, A. Schoeps and M. A. Webb, Phys. Rev. B, 2008, 77,
035202.
53. N. F. Mott, Adv. Phys., 1967, 16, 49.
54. F.-C. Pang, D. Wang, N.-K. Chen, S.-Y. Xie, X. Meng, C.-S. Huo, H. Yang, X.-P. Su, W.-Q. Wang
and H.-L. Tu, Comp. Mater. Sci., 2012, 61, 287-290.
55. T. H. Lee and S. R. Elliott, Phys. Rev. Lett., 2011, 107, 145702.
56. J. Kalikka, J. Akola, J. Larrucea and R. O. Jones, Phys. Rev. B, 2012, 86, 144113.
57. M. Xu, Z. Yu, L. Wang, R. Mazzarello and M. Wuttig, Adv. Electron. Mater., 2015, 1, 1500240. 58. J. Y. Raty, W. Zhang, J. Luckas, C. Chen, R. Mazzarello, C. Bichara and M. Wuttig, Nat. Commun.,
2015, 6, 7467.
59. J. Y. Raty, V. Godlevsky, P. Ghosez, C. Bichara, J. P. Gaspard and J. R. Chelikowsky, Phys. Rev.
Lett., 2000, 85, 1950-1953.
60. S. Le Roux and P. Jund, Comp. Mater. Sci., 2010, 49, 70-83.
61. S. Gabardi, S. Caravati, M. Bernasconi and M. Parrinello, J. Phys.: Condens. Matter, 2012, 24,
385803.
62. S. Caravati, M. Bernasconi and M. Parrinello, Phys. Rev. B, 2010, 81, 014201.
63. K. Ohara, L. Temleitner, K. Sugimoto, S. Kohara, T. Matsunaga, L. Pusztai, M. Itou, H. Ohsumi,
1
Figure 1. (a) The experimental and calculated structure factors at 300 K. (b) Total PCFs, (c)
CNs and (d) BADs of GST when it is quenched from liquid to glass.
[image:21.612.121.497.75.499.2]2
Figure 2. Atomic-density contour plot of GST from the cluster alignment method at selected three
temperatures of 1273, 773 and 300 K, respectively, with the iso-surface value of 0.25 Å-3. Cyan,
3
Figure 3. (a) Five templates: tetrahedron, 3-, 4- and 5-fold octahedrons (defective octahedrons)
and 6-fold octahedron. (b) - (e) the fractions of the five templates at different temperatures.
[image:23.612.127.506.67.443.2]4
Figure 4. Distributions of tetrahedron and 6-fold octahedron centered Ge and Sb atoms at
[image:24.612.111.503.69.372.2]5
Figure 5. The distribution of Ge- and Sb-centered 6-fold octahedrons at different PLD factors
6
Figure 6. Distribution and connectivity of tetrahedrons and 6-fold octahedrons. Only the central
atom of each cluster is depicted. Dark and red spheres denote the center atoms forming
tetrahedrons and 6-fold octahedrons at (a) 1273 K, (b) 773 K and (c) 300 K, respectively. (d), (e)
and (f) correspond to (a), (b) and (c), presenting the connectivity of clusters. A square, a dashed
line and a triangle represent that clusters connect by sharing one, two and three vertices,
respectively. Ellipse represents the central atoms of two clusters connect with each other. Solid red
7
Figure 7. (a) Distributions of ABAB rings at different temperatures. Distributions of irreducible
8
9