www.biogeosciences.net/12/6791/2015/ doi:10.5194/bg-12-6791-2015
© Author(s) 2015. CC Attribution 3.0 License.
Evaluating sensitivity of silicate mineral dissolution rates to physical
weathering using a soil evolution model (SoilGen2.25)
E. Opolot1,2and P. A. Finke1,2
1Department of Geology and Soil Science, Ghent University, Krijgslaan 281, 9000 Ghent, Belgium 2Department of Soil management, Ghent University, Coupure Links 653, 9000 Ghent, Belgium Correspondence to: E. Opolot (emmanuel.opolot@ugent.be) and P. A. Finke (peter.finke@ugent.be)
Received: 7 July 2015 – Published in Biogeosciences Discuss.: 26 August 2015
Revised: 6 November 2015 – Accepted: 11 November 2015 – Published: 27 November 2015
Abstract. Silicate mineral dissolution rates depend on the in-teraction of a number of factors categorized either as intrin-sic (e.g. mineral surface area, mineral composition) or ex-trinsic (e.g. climate, hydrology, biological factors, physical weathering). Estimating the integrated effect of these factors on the silicate mineral dissolution rates therefore necessitates the use of fully mechanistic soil evolution models. This study applies a mechanistic soil evolution model (SoilGen) to ex-plore the sensitivity of silicate mineral dissolution rates to the integrated effect of other soil-forming processes and fac-tors. The SoilGen soil evolution model is a 1-D model devel-oped to simulate the time-depth evolution of soil properties as a function of various soil-forming processes (e.g. water, heat and solute transport, chemical and physical weathering, clay migration, nutrient cycling, and bioturbation) driven by soil-forming factors (i.e., climate, organisms, relief, parent material). Results from this study show that although soil so-lution chemistry (pH) plays a dominant role in determining the silicate mineral dissolution rates, all processes that di-rectly or indidi-rectly influence the soil solution composition play an equally important role in driving silicate mineral dis-solution rates. Model results demonstrated a decrease of sil-icate mineral dissolution rates with time, an obvious effect of texture and an indirect but substantial effect of physical weathering on silicate mineral dissolution rates. Results fur-ther indicated that clay migration and plant nutrient recycling processes influence the pH and thus the silicate mineral dis-solution rates. Our silicate mineral disdis-solution rates results fall between field and laboratory rates but were rather high and more close to the laboratory rates possibly due to the assumption of far from equilibrium reaction used in our dis-solution rate mechanism. There is therefore a need to include
secondary mineral precipitation mechanism in our formula-tion. In addition, there is a need for a more detailed study that is specific to field sites with detailed measurements of sili-cate mineral dissolution rates, climate, hydrology, and min-eralogy to enable the calibration and validation of the model. Nevertheless, this study is another important step to demon-strate the critical need to couple different soil-forming pro-cesses with chemical weathering in order to explain differ-ences observed between laboratory and field measured sili-cate mineral dissolution rates.
1 Introduction
Silicate mineral weathering is the major source of most plant nutrients in soils (Carey et al., 2005; Hartmann et al., 2014), and it is probably the foremost process controlling soil pro-duction rates (Anderson et al., 2007; Dixon and von Blanck-enburg, 2012). Silicate mineral dissolution rates also have implications on acidification in forest soils (Phelan et al., 2014) and carbon sequestration (Beaulieu et al., 2011; God-déris et al., 2013; Pham et al., 2011). Quantifying the rates of silicate mineral dissolution is therefore of utmost importance to answer many environmental questions such as the surface and groundwater composition, the supply of macronutrients (e.g K and Ca) in forests, and the neutralization of acid pre-cipitation (Ganor et al., 2007).
et al., 2009; Parry et al., 2015; White and Brantley, 2003; White et al., 1996; White, 2003; White, 2002). One common conclusion from most of these studies is that a discrepancy of up to 5 orders of magnitude (Oliva et al., 2003; Parry et al., 2015; White et al., 1996; Zhu, 2005) does exist between laboratory and field weathering rates. There seems to be a general consensus that these differences may be explained by (i) changes in fluid composition, (ii) changes in primary min-eral surfaces (reactive sites), (iii) the formation of secondary phases, (iv) efficiency of solution/mineral contact, and (v) the composition of the soil solution in micro pores. White (2002) grouped these factors into two: intrinsic (e.g. mineral compo-sition, surface area) and extrinsic factors (e.g. solution com-position, climate, biological processes). All these five fac-tors could slow field weathering rates compared to labora-tory experiments where most of the physical, biological, and chemical conditions can be constrained (White and Brantley, 2003). In general the integrated effects of these intrinsic and extrinsic factors are complex and certainly difficult to capture both in the field and in the laboratory experiments. Moreover, uncertainty in the extrinsic factors that occurred and varied in the past is difficult to constrain in experiments (Moore et al., 2012; White and Brantley, 2003).
Modelling approaches enhanced by an understanding of silicate kinetic rates and mechanisms from the experimental works are therefore essential to facilitate in the quantification of silicate dissolution rates (Beaulieu et al., 2011; Goddéris et al., 2006; Hellevang et al., 2013; Roelandt et al., 2010; Stendahl et al., 2013). However, in only a few of these mod-elling approaches (Goddéris et al., 2006; Maher et al., 2009; Moore et al., 2012) has the integrated effect of some intrinsic and extrinsic factors on silicate mineral dissolution rates been investigated. There is a need for mechanistic models capa-ble of simulating the integrated effect of physical, biological, and chemical soil-forming processes on chemical weathering rates. Such coupling will give the possibilities to determine the role played by intrinsic and extrinsic factors and explain the differences in dissolution rates observed in the laboratory and field experiments (Goddéris et al., 2006; Hartmann et al., 2014; Moore et al., 2012).
The objective of this work is to explore the integrated ef-fect of physical weathering, clay migration, and plant uptake processes on the silicate mineral dissolution rates with par-ticular emphasis on physical weathering. The relationship be-tween particle size distribution and chemical mineral weath-ering is well-known. Holding other factors constant (eg. pH), the smaller the grain size the larger the surface area per unit mass and consequently the higher the rate of chemical weath-ering (Hartmann et al., 2014). In most cases, a constant grain size distribution has been assumed when estimating weath-ering rates; this assumption could be invalid especially when looking at longer timescales. This contribution applies a Soil-Gen model (a model that simulates evolution of soil proper-ties as a function of several interactive soil-forming processes including water flow, chemical weathering, physical
weath-ering, carbon-cycling, cation exchange, clay migration, nutri-ent uptake by plants, bioturbation, and leaching) to evaluate the sensitivity of silicate mineral dissolution rates to other soil-forming processes.
In summary, this study addresses the interactive effects of intrinsic and extrinsic factors on chemical weathering using a mechanistic soil model. We mainly focused on the effects of physical weathering with the hypothesis that physical weath-ering affects the magnitude of chemical weathweath-ering and this could partly be the cause of systematic deviations between laboratory and field approaches to estimate silicate mineral dissolution rates.
Specific objectives are to (i) assess the effects of par-ent material composition on the silicate mineral dissolution rates, (ii) assess sensitivity of chemical silicate mineral dis-solution rates to change in soil texture, (iii) assess the effect of physical weathering of primary minerals on their disso-lution rates, (iv) assess the effect of interactive soil-forming processes on silicate mineral dissolution rates, and (v) com-pare our modelled silicate mineral dissolution rates to rates reported in literature.
2 Materials and methods 2.1 Study area
This is a sensitivity test study that is not specific to any location. However, the choice was made to do this study in the forested loess soils, in the Zonian forest in Belgium (50◦4603100N, 4◦240900E), primarily because the soil-forming processes (clay migration, physical weathering, decalcifica-tion, carbon-cycling) in the model have already been cali-brated to this site (Finke and Hutson, 2008; Finke, 2012; Opolot et al., 2015; Yu et al., 2013). In addition, the mea-sured soil data (Finke, 2012; van Ranst, 1981) and other re-constructed model input data (Finke and Hutson, 2008) were readily available for this site.
2.2 Research set up
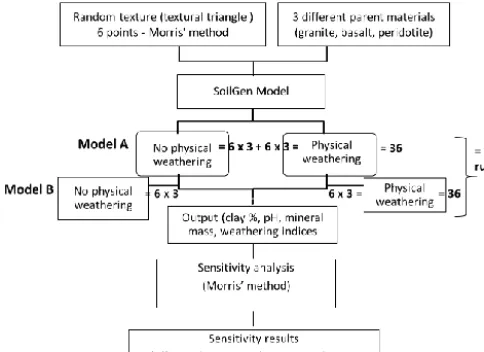
Figure 1. Research set up.
2013) and the mineralogical compositions were estimated from these geochemical data using the normative mineral-ogy calculation method (Cross et al., 1902; Kelsey, 1965). Only primary minerals were considered at this stage and their weight compositions were rescaled to sum up to one.
At this stage two scenarios (with physical weathering, PhyWE and without physical weathering, NoPhyWE) were defined but in two different model setups (Model A and Model B; Fig. 1). Model setup 1, hereafter referred to as Model A, is intended to simulate majorly the effect of change in particle size (due to physical weathering process) on sili-cate weathering rates and therefore the effects of other pro-cesses (clay migration, carbon-cycling, bioturbation) on sil-icate weathering rates are minimized by deactivating these processes in this model set up. Model setup 2, hereafter re-ferred to as Model B, was intended to simulate the interac-tive effect of other soil-forming processes (including physi-cal weathering, clay migration, carbon-cycling, plant uptake, bioturbation) on silicate weathering rates and therefore all these processes are active. The soil-forming processes in-cluded in the SoilGen and input data are briefly discussed in the subsequent sections. In total, 72 cases were run in the SoilGen model (i.e two set ups X two scenarios X six texture points X three parent materials).
The output parameters from the model include soil tex-ture (% mass fraction of clay, silt and sand), pH, base satu-ration, weathering indices, mass of each mineral remaining, etc. For this study the outputs of interest extracted included pH, clay mass fraction, and mineral mass. The mass of each mineral remaining after the simulation period (15 000 years) was used to calculate the respective dissolution rates of each mineral and was the basis for the sensitivity analysis as will be explained in the subsequent sections.
2.3 The SoilGen model
The SoilGen model is a 1-D model designed to simulate time - depth evolution of soil properties as a function of interactive soil-forming processes (majorly driven by the soil-forming factors (“CLORPT”): climate, living organisms, relief, par-ent material, time). The governing processes in the model in-clude unsaturated water flow simulated using Richard’s equa-tion, heat flow described following heat flow equaequa-tion, and solute transport described by convection-dispersion equa-tion (CDE). For unsaturated water flow, the model uses van Genuchten parameters to characterize water retention and hydraulic conductivity relations. The van Genuchten param-eters are estimated each simulation year by a pedotransfer function (HYPRES; Wosten et al., 1999) using texture, or-ganic matter content and bulk density and all these three soil properties are simulated in the model.
2.3.1 Physical weathering
Physical weathering in SoilGen is defined as the stochastic process through which soil particles are split up into smaller particle sizes due to strain caused by temperature gradients. The process of physical weathering consequently leads to the reduction in grain size, producing material in the clay frac-tion that may be moved by clay migrafrac-tion (Finke, 2012).
As a starting point, the fine earth fraction is divided into particle size classes with boundaries at 2048–1024–512– 256–128–64–32–16–8–4–2 µm. It is assumed that all parti-cles are cubes and have an edge size halfway between the class limits: 1536, 768, 384, 192, 96, 48, 24, 12, 6, 3, and 1 µm. In principle, each particle has to be split in half up to 7 times to attain 8 equally sized particles in the next smaller particle size class. The splitting probability of each particle,
Psis assumed to follow Bernoulli process and depends on the temperature gradient over a certain time interval, dt (Finke, 2012):
Ps=
Ps,max if dT
dt > B Ps,max×ddTt
B if
dT
dt ≤B
(1)
whereBis a threshold temperature gradient over dt, where
Ps,max is maximal, T is the temperature, and Ps,max is the maximal split probability. Ps,max andB are normally sub-jected to calibration in conjunction with parameters that de-scribe clay migration (Finke et al., 2015).
The expected number of the potential splitting events,
E(N ) that are needed to achieve successful splits, m(i.e.,
m=7) are assumed to follow the negative binomial distribu-tion and are defined as
E(N )= m
Ps
(2) Thus the number of grains,Sin any particle size classithat is split in time dtis obtained from Eq. (3):
Si,dt =min ki, t−dtki, t−dt/E (N ), (3)
whereki,t−dt is the number of grains in particle size class at the start of dtandki, t is defined as
ki,t =ki,t−dt−a×Si,dt+b×8×Si−1,dt, (4)
wherea=0 for clay fraction (i=11) anda=1 else;b=0 for the coarsest sand fraction (i=1) andb=1 else (Finke, 2012).
It has to be noted that physical weathering in SoilGen is assumed to be caused solely by temperature fluctuations and other mechanical processes that result in the breakup of bedrock (e.g. by plant roots) are not modelled. The splitting of gravel-sized particles is yet to be included in the descrip-tion of physical weathering and this currently limits the use of the SoilGen model to unconsolidated, non-gravelly de-posits.
2.3.2 Chemical weathering
The weathering mechanism that is implemented here (i.e., in SoilGen2.25) is different from the mechanism that has been used in the previous version of the SoilGen model (Soil-Gen2.24). The previous chemical weathering module (un-weathered phase) of SoilGen considers the four most com-mon primary minerals (Anorthite, Chlorite, Microcline, Al-bite) that respectively release Ca, Mg, K, and Na. Congru-ent weathering of Anorthite, Chlorite, Microcline and Al-bite release Al. A detailed mechanism is already presented in (Opolot et al., 2015; Sect. 2.1.2: Weathering processes). In general, the approach is based on the acidification models and takes only a few minerals into account. There was a need to extend this module to allow simulation of chemical weath-ering of a wider range of primary minerals such that more chemical species may be simulated (Opolot et al., 2015). The extended chemical weathering system presented here is based on the transition state theory and similar to the ap-proaches already presented in other weathering models e.g. Sverdrup and Warfringe (1995) and Goddéris et al. (2006).
The release rate of cation,i from all thek minerals,ri,k (mol m−2s−1)can be computed as:
ri,k=
XN
k=1Akvi,krkmkt, (5)
whereAk (m2mol−1) is the specific surface area of thekth mineral,vi,k(−) is the stoichiometric number of theith el-ement in mineral k, andrk (mol m−2s−1)is the dissolution rate constant of thekth mineral.mk is the amount of thekth mineral in the parent material expressed in (mol m−3 soil) andt(m) is the thickness of the soil compartment (=0.05 m in SoilGen).
The total surface area of soil minerals,Aj(m2g−1) can be obtained based on the percentage fractions of sand, silt and clay (Eq. 6; Sverdrup and Warfvinge, 1995). The individual reactive areaAkis obtained as a product of weight composi-tion ofkth (kcomp)mineral andAj.Akis again multiplied by the relative formula mass of the mineral (kRFM, g mol−1) to give the mineral areaAk in m2mol−1(Eq. 7):
Aj=8xclay+2.2xsilt+0.3xsand+0xcoarse. (6) Coefficients 8, 2.2 and 0.3 represent the specific surface areas (m2g−1) of clay, silt and fine sand (< 256µ) sized particles, respectively.
Ak=Aj×kcomp×kRFM. (7)
equation to estimate the mineral reactive area. The accurate estimation of reactive mineral surface area in natural environ-ments is still a subject of considerable debate (e.g. Hodson et al., 1997; Brantley et al., 2008). Nevertheless, the use of Eq. (6) along with experimental dissolution rates normalized to the BET surface area allows for the good estimation of mineral surface area in natural environments (Sverdrup and Warfvinge, 1995). This function is therefore still widely used as a reasonable first estimate of mineral surface areas (God-déris et al., 2006; Gudbrandsson et al., 2011; Koptsik et al., 1999; Koseva et al., 2010; Phelan et al., 2014; Stendahl et al., 2013; Violette et al., 2010; Whitfield et al., 2010).
The dissolution rate of most silicate minerals, rk at far from equilibrium conditions is calculated as a function of pH (Eq. 8), is based on laboratory kinetic laws derived from the concept of transition state theory (Eyring, 1935; Brantley et al., 2008).
rk=kHaHn++kH2O+kOHa
m
OH− (8)
wherekH, andkOH are mineral dissolution rate constants at acidic and basic conditions, respectively. The parameterskH andkOHhave to be corrected for temperature (Eqs. 9 and 10).
aH+ andaOH− are activities of H+and OH−, respectively, and superscripts n and m denote the reaction orders.kH2Ois
a parameter describing the dissolution rate at neutral pH and was not considered in the implementation because at neutral conditions the dissolution rate of silicates is so slow that this term makes an insignificant contribution to the overall sili-cate dissolution rate (Brantley, 2004).
kH kH25 =exp k EaH R 1
298.15− 1 T (9) kOH kOH25 =exp k EaOH R 1
298.15− 1
T
(10) where kH25 and kOH25 are measured dissolution rate con-stants at 25◦C (298.15 K); k
EaOH, kEaH (KJ mol
−1K−1) are the activation energies of a kt h mineral at acidic and basic conditions, respectively, and R is a gas constant (0.00831446 KJ mol−1K−1).T is absolute soil temperature (K) and it is simulated in the model.
2.4 Model input data
[image:5.612.309.545.106.203.2]The SoilGen model was designed keeping in mind the gener-ally accepted paradigm that soil is a function of soil-forming factors; “CLORPT” (Jenny, 1941). Therefore the model uses these factors either as initial conditions (e.g mineralogy, tex-ture) or boundary conditions (e.g. climate, vegetation, biotur-bation, slope, and exposition). The initial conditions specify to the model the initial soil properties at the beginning of the simulations and are usually assumed to be equal to the soil properties from the analysis of samples taken from the C-horizon. Initial texture and mineralogy used in this study are
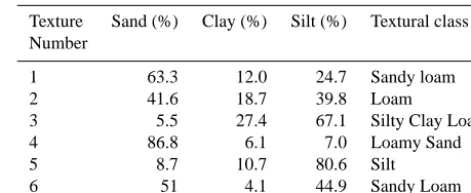
Table 1. Texture points randomly selected from the USDA textural triangle (Soil Survey Division Staff, 1993) and used as initial soil texture in all the model runs.
Texture Sand (%) Clay (%) Silt (%) Textural class Number
1 63.3 12.0 24.7 Sandy loam
2 41.6 18.7 39.8 Loam
3 5.5 27.4 67.1 Silty Clay Loam
4 86.8 6.1 7.0 Loamy Sand
5 8.7 10.7 80.6 Silt
6 51 4.1 44.9 Sandy Loam
shown in Tables 1 and 2, respectively. Other initial soil prop-erties (e.g. initial OC %, bulk density, solution composition, and exchange surface chemistry), and boundary conditions (i.e., time series of climate, vegetation and bioturbation) were taken from Finke (2012).
2.5 Calculating average silicate dissolution rates Silicate mineral dissolution rate usually reported in units of mol m−2s−1is defined as the amount of mineral (moles) that is released in the form of constituent elements per unit area (e.g., cm2, m2 or ha) or volume (cm3, m3)over a given pe-riod time. Similar to the approach used in (White and Brant-ley, 2003), congruent weathering was assumed and the moles of each cation released during silicate mineral dissolution was based on the stoichiometric coefficient of that particu-lar element in the mineral. To calculate the dissolution rate of a given mineral, the amount of mineral (mass per unit volume) remaining after defined simulation period was sub-tracted from the respective amount of each mineral initially present. This difference was then converted to mol m−2by multiplying with the respective compartment thickness (t) and dividing by the relative formula mass (RFM). The re-sulting value was again divided by the simulation period to give dissolution rates in mol m−2s−1(Eq. 11).
kdiss=
( mkinit− mkfinal)×1000×t RFMk×SP
(11)
wherekdiss (mol m−2s−1)is the dissolution rate of silicate mineral, k,mkinitandmkfinalare the initial and the final mass (kg m−3)of silicate mineralk, RFMk is the relative formula mass (g mol−1)of mineralk, and SP is the simulation period (s). The number 1000 is the conversion factor from Kg to g of mineralk.
2.6 Sensitivity analysis
Table 2. Primary minerals and their relative weight composition. The oxide weight composition typical of granite, basalt and peri-dotite was obtained from literature (Blatt and Tracy, 1996; Harris et al., 1967; Hartmann et al., 2013). The mineralogical compositions were estimated from these data using the normative mineralogy cal-culation method (Cross et al., 1902; Kelsey, 1965).
Parent material Primary silicate mineral (wt %) type
Albite K-feldspar Quartz Forsterite
Granite 42.3 26.1 31.6 –
Basalt 32.1 34.5 – 33.4
Peridotite 10.9 0.3 – 88.8
et al., 2005). It is computationally cheaper than other sensi-tivity methods and therefore suitable for especially long run time models such as SoilGen (Finke et al., 2015; Yu et al., 2013). The method basically aims to quantify the response of model output due to differences in the levels of input pa-rameter (the so-called elementary effects). In this study the levels include different textures and whether physical weath-ering is allowed or not. The output of interest in this case is the amount of mineral (Kg m−3)lost over the simulation period due to chemical weathering which is itself influenced by differences in texture and physical weathering. The ele-mentary effects of differences in texture (ui)on the amounts of mineral lost were calculated following Eq. (12; Morris, 1991). Sensitivity of each silicate mineral was then evalu-ated by plotting the mean and the standard deviations of the elementary effects against each other (in the x andy axis, respectively) for both PhyWE and NoPhyWE scenarios and for each parent material.
ui=
Y (x1, x2, x3. . .xi+1xi)−Y (x1, x2, x3. . .xi)
1xi
(12) wherex1, x2, x3. . .xiare the different levels of input parame-ter (i.e., different textures, in this study),1xi is the variation imposed on the input parameter measured as the Euclidean distance between two points in the textural triangle, andY is the model output in response to each level of input parameter.
3 Results and discussion
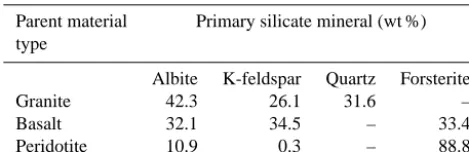
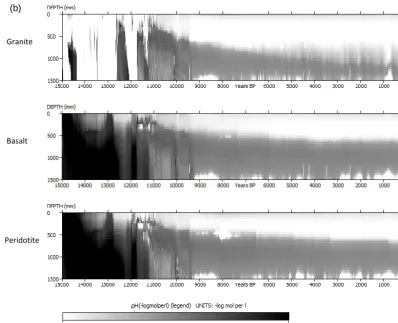
3.1 pH evolution as a function of parent material The evolution of pH as a function of parent material is shown in Fig. 2a (Model A) and Fig. 2b for model B. There is erratic behaviour of pH in the beginning of the simulations (between 15 000 and 12 000 years BP especially under granite). Gen-erally, pH is increasing with depth and decreasing over time across the different parent materials as well as the two dif-ferent model set ups (i.e, Model A and Model B). pH is gen-erally higher in basalt and peridotite parent materials than
granite but only in the first 5000 years of simulation (i.e., up to 10 000 years BP). The trends are, however, reversed in the subsequent years especially in Model A. There is generally a more gradual evolution of pH under model B compared to model A with a generally lower pH under model A than Model B, when comparing respective parent materials.
The erratic behaviour of pH in the beginning of the simu-lations (between 15 000 and 12 000 years BP especially un-der granite parent material (Fig. 2a, b)) could be linked to the sensitivity of dissolution rates to dilution due to variation in precipitation. This period coincides with the drier periods (see Fig. 3 in Finke, 2012) with incidences of precipitation deficit in some years. Precipitation deficit means low dilution as well as limited mineral dissolution and release of cations, consequently keeping the pH low. At the current model ver-sion, the assumption is that dissolution occurs at far from equilibrium and thus the effect of the formation of secondary mineral formation on pH is not yet accounted for. This is cer-tainly a limitation of this study and work is on-going to in-corporate this mechanism into the model. A number of stud-ies (Casey et al., 1993; Goddéris et al., 2006; Maher et al., 2009; Moore et al., 2012; Zhu, 2005; Zhu et al., 2010) have already demonstrated that solute composition and secondary mineral precipitation controls the reaction affinity of primary minerals. The dissolution rates from this study are therefore expected to be faster than they would be if secondary min-eral precipitation were to be taken into account. The plunge in pH after 10 000 years BP for basalt and peridotite (Fig. 2a and b) could be linked to the depletion of forsterite at that time and thus less release of Mg2+. Comparing Fig. 2a and b, the effect of mineralogical composition on pH appears to come less in Fig. 2b (particularly after year 10 000 BP; be-tween 500–1400 mm) compared to that in Fig. 2a. This trend is likely due to the cation exchange capacity (CEC) buffering effect on pH in the zone of clay accumulation (Finke, 2012). 3.2 Evolution of clay mass fraction
Granite
Basalt
Peridotite
(a)
Figure 2. (a) Time-depth evolution of pH with physical weathering (Model A) for three parent materials with texture number 5 (Table 1).
forest (see Fig. 7 in Finke, 2012). Since the chemical and mineralogical analyses presented by van Ranst (1981) did not support any clay new formation, the increase in clay content with time was mainly attributed to the physical weathering process. The right part of Fig. 3 shows the clear effect of clay migration process on clay mass fraction. The clay mass that is produced by physical weathering (Fig. 3, left panel) is subsequently transported from the top compartments into the lower compartments (through clay migration), forming E and Bt horizons (Fig. 3, right panel), respectively (Finke, 2012). The complete Bt belly could not be shown by our re-sults probably because of our shallow profile which was con-sidered to reduce the run-time of the model.
3.3 Mineral dissolution rates
3.3.1 Effect of parent material composition on dissolution rates
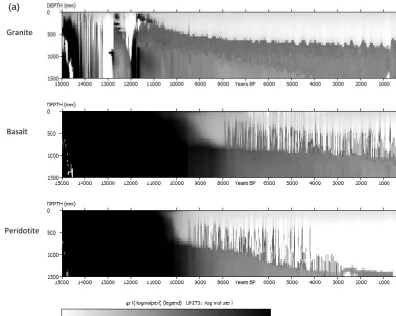
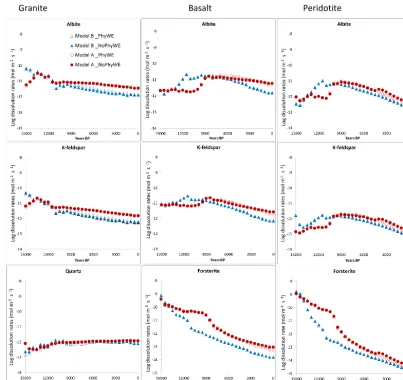
Figure 4 shows the effect of parent material composition on the average dissolution rates of K-feldspar, albite, quartz, and forsterite over successive time intervals of 500 years. With the exception of quartz whose rates were increasing with time, the dissolution rates across the three parent materials decrease with time. The dissolution rates of albite and
K-feldspar are higher (especially at the beginning of the sim-ulation) under the granite parent material than in basalt and peridotite. Model A dissolution rates across all the minerals are generally higher than the rates from Model B. In granite however, dissolution rates of albite and K-feldspar in Model A between 15 000 and 13 000 years BP are lower than the re-spective dissolution rates in Model B. From 13 000 years BP until 9000 years the dissolution rates are similar between the two models. In Basalt and peridotite, the dissolution rates of albite and K-feldspar between 13 000 and 9000 years BP are higher in model B than in Model A. From 9000 until 0 years BP, the dissolution rates of all minerals (except for quartz) across three parent materials are generally higher in model A than in model B.
[image:7.612.98.495.67.383.2]Granite
Basalt
Peridotite
(b)
Figure 2. (b) Time-depth evolution of pH with interactive soil-forming processes (Model B) for three parent materials with texture number 5 (Table 1).
-150 -135 -120 -105 -90 -75 -60 -45 -30 -15 0
0 10 20 30 40
D
e
p
th
(
cm
)
Clay mass (%)
1 1 2 2 3 3 4 4 5 5 6 6
-150 -135 -120 -105 -90 -75 -60 -45 -30 -15 0
0 10 20 30
D
e
p
th
(
cm
)
Clay mass (%)
Figure 3. Clay mass fraction (%) evolution as a function of physi-cal weathering (Model A, left panel) and as a function of interactive soil-forming processes (Model B, right panel). Roman numerals 1– 6 represent texture numbers presented in Table 1. Solid lines repre-sent initial textures while broken lines reprerepre-sent evolution of texture as affected by other soil processes i.e., only physical weathering (left hand side) and a combination of mainly physical weathering and clay migration (right hand side). Notice that with only physical weathering allowed (Model A), the initial textures (solid lines) do not change whereas in model B, even the initial textures change due to other processes notably clay migration.
explained by the influence that the parent material has on pH (e.g., interpreting Fig. 2a for model A and Fig. 2b for Model B). The higher dissolution rates (especially in the be-ginning) of albite and K-feldspar observed in granite com-pared to basalt and peridotite could therefore be due to lower pH observed in granite than in Basalt and Peridotite at that point in time. The Mg2+ released from forsterite (which is
[image:8.612.98.497.65.388.2] [image:8.612.52.285.444.567.2]Granite Basalt Peridotite
Figure 4. Example (based on soil texture number 5; Table 1) of time evolution of silicate dissolution rates in different parent materials (Granite, Basalt and Peridotite). The modelled rates are calculated for a depth of 0.5 m for every 500 years. Model A: Circles; solid (no physical weathering) open (physical weathering allowed). Model B: Triangles; solid (no physical weathering) open (physical weathering allowed).
Model B that are not observed in Model A. From 9000 years BP until 0 years BP, Model A dissolution rates of albite, K-feldspar, and forsterite are higher than respective rates in Model B owing to the lower pH in Model A (averaged over 0. 5 m) than in model B (Figs. 2a and b). Quartz is less sensi-tive to pH less than 6 (Knauss and Wolery, 1988) and thus its dissolution rates in Model A and model B were not any dif-ferent and did not seem to change from 10 000 until 0 years BP.
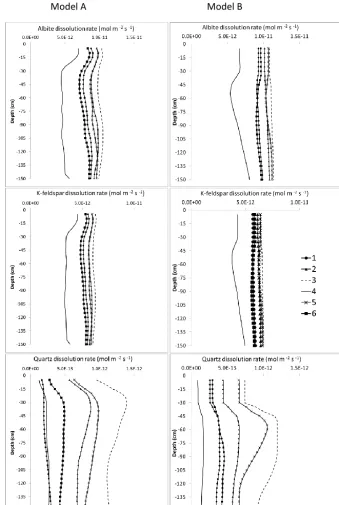
3.3.2 Effect of initial texture
The effect of initial texture on silicate mineral dissolution rates for Model A and Model B is presented in Fig. 5. As would be expected and consistent with previous studies (e.g. Hartmann et al., 2014; Phelan et al., 2014), the mineral dis-solution rates are higher for finer textures than for coarse
Model A Model B
Figure 5. Effect of initial texture (shown in Table 1) on the depth distribution of silicate dissolution rates. The rates shown are taken from granite parent material and are averaged over a 15 000-year simulation period.
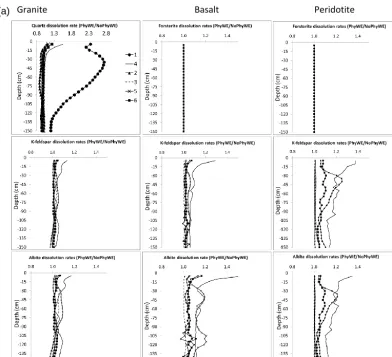
3.3.3 Effect of physical weathering
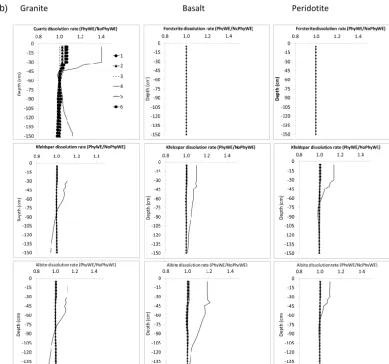
The effect of only physical weathering (Model A) and the integrated effect of all soil-forming processes (Model B) on the average silicate dissolution rates are shown in Fig. 6a and b, respectively. The rates are presented as a ra-tio of physical weathering to no physical weathering (i.e., PhyWE/NoPhyWE), where a value greater than 1 implies
Granite Basalt Peridotite
(a)
Figure 6. (a) Effect of physical weathering on silicate mineral dissolution rates (Model A). Dissolution rates are presented here as a ratio of physical weathering to no physical weathering (i.e., PhyWE/NoPhyWE). Values greater than one imply that the rates are higher when physical weathering is allowed. Roman numerals 1–6 represent texture numbers presented in Table 1.
minerals and parent materials with the exception of Quartz mineral (in Model A) where dissolution rate due to physi-cal weathering is highest under texture number 1. In model B however, the effect of physical weathering is almost not visible (except for the texture number 4; solid line) as in-dicated with unity PhyWE/NoPhyWe ratios of all minerals across the different textures. Higher dissolution rates with no physical weathering compared to with physical weathering (i.e., PhyWE/NoPhyWE < 1) were only observed for Albite and K-feldspar below 0.75 m under Model B (see Fig. 6b: granite; texture number 4).
As already mentioned in the previous section, the direct effect of texture on chemical weathering is through its influ-ence on the mineral surface area. Based on Eq. 6, this would imply that the higher the number of particles moved from coarse to fine classes, the higher the mineral surface area and thus the higher the mineral dissolution rate. This seems to be the case especially for coarse texture (texture num-ber 4) where the dissolution rates of albite and K-feldspar
in basalt and peridotite (Fig. 6a) are up to 1.4 times higher with PhyWE compared to NoPhyWE. The effect of physical weathering on the dissolution rates of albite and K-feldspar seems to be more pronounced in basalt and peridotite where pH is relatively higher and thus imposes less dominance on the chemical dissolution rates of albite and K-feldspar. The generally lower pH under granite could explain the higher ef-fect of physical weathering on quartz dissolution rates under coarse textures 1, 4 and 6 (Fig. 6a).
[image:11.612.105.498.63.420.2]Granite Basalt Peridotite
(b)
Figure 6. (b) Integrated effect of soil-forming processes on silicate mineral dissolution rates (Model B). Dissolution rates are presented here as a ratio of physical weathering to no physical weathering (i.e., PhyWE/NoPhyWE). Values greater than one imply that the rates are higher when physical weathering is allowed. Roman numerals 1–6 represent texture numbers presented in Table 1.
to Moore et al. (2012), hydrology is a key physical extrin-sic factor and perhaps one of the most important factors that could explain observed differences between laboratory and field measured rates.
3.3.4 Interactive effects of selected soil-forming processes on chemical weathering rates
The interacting soil-forming processes that affect chemical weathering and are discussed this study include clay migra-tion, plant uptake, carbon cycling, and physical weathering. The results of these processes are presented under model B (in Figs. 2b, 3 (right panel), 4, 5, 6b, 7, and 8). These processes have both direct and indirect effects on chemical weathering rates (White, 2002) through their influence on texture (e.g. clay migration, physical weathering, bioturba-tion) and on pH (e.g. clay migration, plant uptake, CO2 pro-duction by mineralisation of organic matter). As discussed in Finke (2012), clay migration process moves clay mass from
the top part of the profile into the lower part of the profile (Fig. 3, right panel), leading to the formation of an argillic (Bt) horizon which slows down water flow thus increasing solute concentration and lowering reaction affinity (Smeck and Ciolkosz, 1989; White and Brantley, 2003). Clay migra-tion process also has a pH buffering effect (Fig. 2b) through its influence on cation exchange capacity (Finke, 2012). El-ement cycling through plant uptake and release (through or-ganic matter decomposition) influences the pH and conse-quently mineral weathering rates (Brady et al., 1999; Drever, 1994; Moulton et al., 2000; Stillings et al., 1996). Higher pH that is visible in the top 0.25 m (Fig. 2b) can therefore be attributed to plant nutrient cycling process.
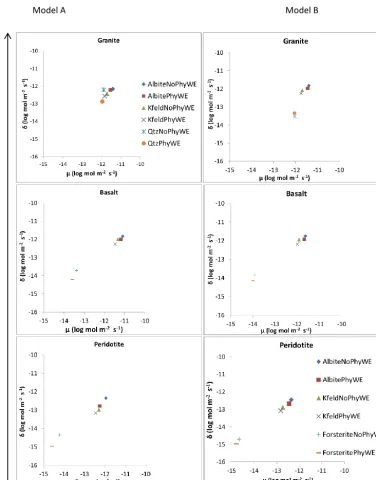
3.4 Sensitivity of mineral dissolution rates to physical weathering
[image:12.612.106.496.66.430.2]In
creasin
g v
ari
ab
ilit
y in di
sso
lu
ti
o
n
rate
s du
e
to
dif
fer
ent
el
em
entar
y e
ff
ect
s
Increasing mean differences in mineral dissolution rates due to elementary effects
[image:13.612.118.494.64.544.2]Model A Model B
Figure 7. Sensitivity of mineral dissolution rates to physical weathering (Model A) and to other interactive soil-forming processes (Model B). The data used in this sensitivity analysis were extracted from the top soil compartment (0.05 m depth).µandδare the mean and standard deviation, respectively of elementary effects (ui)calculated from Eq. (12).
sensitivity (Model A) to no sensitivity of dissolution rates (Model B) due to differences in texture and physical weather-ing across different minerals and parent materials. The pH of the soil solution seems to be a dominant factor to the chem-ical weathering of silicate minerals. In addition, the indirect effect of physical weathering on water flow and thus soil pH seems to oppose and cancel out the direct effects of physical
Granite Basalt Peridotite
Figure 8. Comparison of SoilGen average mineral dissolution rates (Model A and Model B) to laboratory and field determined dissolution rates. Field rates were taken from Parry et al. (2015) and White (2009; Table 2) while lab rates were taken from Holdren and Speyer (1987); Siegal and Pfannkuch (1984); Swoboda-Colberg and Drever (1993); Blum and Stillings (1995), Lee et al. (1998): K-feldspar; Stillings et al. (1996); Welch and Ullman (1996); Oxburgh et al. (1994); Blum and Stillings (1995), Chou and Wollast (1985); Knauss and Wolrey (1986); Hamilton et al. (2000): Albite; Brady and Walther (1990); Dove (1994): Quartz. The same field and laboratory rates are repeated for different parent materials (Granite, Basalt and Peridotite). Laboratory and field dissolution rates for Forsterite are not shown.
3.5 Comparison between SoilGen-modelled average mineral dissolution rates and Laboratory and field-measured rates
SoilGen modelled silicate dissolution rates (Models A and B) were compared with rates obtained from field and laboratory experiments (Fig. 8). Rates plotted are for the whole profile depth (1.5 m) and for all the six different texture positions shown in Table 1. These rates are averaged for 15 000 years BP and they generally fall between what is reported from field measurements and what is reported from the laboratory studies. Our results are, however, generally closer to the labo-ratory rates than the field measured rates most likely because we assumed far from equilibrium reactions.
There seems to be no difference between dissolution rates from Model A and Model B across different parent materi-als when looking at the average rates over the whole sim-ulation period of 15 000 years (Fig. 8). However, when the rates are calculated over short time intervals e.g. 500 years, there is a clear difference at some points in time between the two models and even across different parent materials (see
Fig. 4 for example). The evolution of silicate dissolution rates with time (Fig. 4) is not linear and this is in line with other previous studies (e.g. Hodson and Langan, 1999; White and Brantley, 2003). In general, silicate dissolution rates decrease with time due to depletion of reactive surfaces and the forma-tion of leached layers and secondary minerals (Hodson and Langan, 1999; White and Brantley, 2003). The comparison of dissolution rates obtained at different timescales therefore remains a challenge and could partly explain the significant differences in silicate dissolution rates reported in literature (White and Brantley, 2003). In addition, the various defini-tions of chemical weathering rates used in different studies e.g. cation chemical weathering rates (CCWR), chemical sil-icate rock weathering rates (CSRWR), and total chemical weathering rates (TCWR) make it difficult to compare re-sults between studies (Hartmann and Moosdorf, 2011). Inter-preting and comparing results from different studies should therefore be done with utmost care.
surface area was based on the calibration study with mea-sured BET surface area (Sverdrup and Warfvinge, 1995). The field and laboratory rates were however not tied to the timescales or parent materials which could also limit our comparisons to some extent. There are also other questions that could be raised and that could potentially limit our com-parisons with field and laboratory measurements. For ex-ample, would the calibrations already done for clay migra-tion, physical weathering, and carbon cycling processes in the quartz-dominated loess sediment (Zonian forest; Finke, 2012) hold for other sites with mafic and ultramafic parent materials? And whether ignoring the differences in climate and the timescales would invalidate the comparison between the dissolution rates from this study and previous studies? To answer such questions requires a more detailed study that is specific to field sites with field data of soil age, silicate dis-solution rates, climate, hydrology, mineralogy, and any other important factors to enable the calibration and validation of the model. Although still challenging, such studies are al-ready feasible on well-studied chronosequences (e.g. Moore et al., 2012). However the intention of these comparisons (Fig. 8) is to show the general trends of our simulations rather than the absolute values.
4 Conclusions and outlook
We have used a fully mechanistic soil evolution model (Soil-Gen) to explore the sensitivity of silicate dissolution rates to the interaction between intrinsic (mineral composition, mineral surface area) and extrinsic factors (climate, physical weathering, clay migration, plant uptake, hydrology). Results from this study have shown consistency with both theoreti-cal understanding of the effects of these factors on chemi-cal weathering, and with observations from experiments and some modelling studies. Our results have demonstrated that although soil solution chemistry (pH) plays a dominant role in determining the silicate dissolution rates, all processes that directly or indirectly influence the soil solution composition play a major role in driving silicate dissolution rates. For ex-ample, although the sensitivity results did not confirm sensi-tivity of dissolution rates to physical weathering, the effect of texture (as influenced by physical weathering) on hydrol-ogy could have a substantial effect on the water flow, ele-ment leaching and consequently the pH and silicate dissolu-tion rates.
Our dissolution rates results were in between field and laboratory rates, however they were rather high and closer to the laboratory rates owing to the assumption of far from equilibrium reaction. This remains a limitation of this study since near-to-equilibrium conditions have mainly been re-ported from the field experiments. However these findings are important and challenge us to include secondary mineral precipitation mechanism in the model and perform a com-parative study to quantify these effects. Furthermore,
cali-bration and validation of the model to the sites with detailed chronosequence data (soil age, silicate dissolution rates, cli-mate, hydrology, mineralogy) is needed.
Despite the limitations identified, this study is another im-portant step to demonstrate the critical need to couple differ-ent soil-forming processes with chemical weathering in order to explain differences between silicate dissolution rates mea-sured in the laboratory and in the field. In summary, results showed an inverse relationship of silicate mineral dissolution rates with time, an obvious effect of texture and an indirect but substantial effect of physical weathering on silicate dis-solution rates. Additionally, results have shown that clay mi-gration and plant nutrient recycling processes influence the pH and thus the silicate dissolution rates.
Code availability
The SoilGen model is freely available. The user man-ual and the programs for previous versions can be downloaded at http://users.ugent.be/pfinke/index_bestanden/ Page1167.htm. SoilGen2.25 version is not yet available on the website but can be obtained on request (by sending an email to peter.finke@ugent.be).
Author contributions. Peter Finke developed the model code and designed the research. Emmanuel Opolot contributed to the model code development (weathering module), performed the simulations and prepared the manuscript with continuous and valuable contri-bution from Peter Finke.
Acknowledgements. This work is part of the PhD project under the theme “The Soil System Under Global change, SOGLO” and funded by the Belgian Science Policy Office (project BEL-SPO/IUAP p7/24).
Edited by: A. Ito
References
Anderson, S. P., von Blanckenburg, F., and White, A. F.: Physical and Chemical Controls on the Critical Zone, Elements, 3, 315– 319, doi:10.2113/gselements.3.5.315, 2007.
Beaulieu, E., Goddéris, Y., Labat, D., Roelandt, C., Calmels, D., and Gaillardet, J.: Modeling of water-rock interac-tion in the Mackenzie basin: Competiinterac-tion between sul-furic and carbonic acids, Chem. Geol., 289, 114–123, doi:10.1016/j.chemgeo.2011.07.020, 2011.
Blatt, H. and Tracy, R.J.: Petrology: Igneous, sedimentary and meta-morphic, 2nd ed. New York, W. H. Freeman, ISBN 0-7167-2438-3, 1996.
Brady, P. V. and Walther, J.V.: Kinetics of quartz dissolution at low temperatures, Chem. Geol., 82, 253–264, 1990.
Brady, P. V., Dorn, R. I., Brazel, A. J., Clark, J., Moore, R. B., and Glidewell, T.: Direct measurement of the combined ef-fects of lichen, rainfall, and temperature onsilicate weathering, Geochim. Cosmochim. Ac., 63, 3293–3300, doi:10.1016/S0016-7037(99)00251-3, 1999.
Brantley, S. L.: Reaction kinetics of primary rock-forming minerals under ambient conditions, in: Treatise on Geochemistry, Surface and ground water, weathering, and soils, edited by: Drever, J. I., Elsevier Pergamon, San Diego, CA, 73–118. 2004.
Brantley, S. L., Kubicki, J. D., and White, A. F.: Kinetics of Water-Rock Interaction. Springer Science+Business Media, LLC, 833 pp., 2008.
Carey, A. E., Lyons, W. B., and Owen, J. S.: Significance of land-scape age, uplift, and weathering rates to ecosystem develop-ment, Aquat. Geochem., 11, 215–239, doi:10.1007/s10498-004-5733-6, 2005.
Casey, W. H., Banfield, J. F., Westrich, H. R., and McLaugh-lin, L.: What do dissolution experiments tell us about natu-ral weathering?, Chem. Geol., 105, 1–15, doi:10.1016/0009-2541(93)90115-Y, 1993.
Chou, L. and Wollast, R.: Steady-state kinetics and dissolution mechanism of albite, Am. J. Sci., 285, 963–993, 1985.
Cross, W., Iddings, J.P., Pirsson, L. V., and Washington, H. S.: A quantitative chemico-mineralogical classification and nomencla-ture of igneous rocks, J. Geo, 10, 555–690, 1902.
Dixon, J. L. and von Blanckenburg, F.: Soils as pacemakers and limiters of global silicate weathering, C. R. Geosci., 344, 597– 609, doi:10.1016/j.crte.2012.10.012, 2012.
Dove, P. M.: The dissolution kinetics of quartz in sodium-chloride solutions at 25◦C to 300◦C, Am. J. Sci, 294, 665–712, 1994. Drever, J. I.: The effect of land plants on weathering rates of
silicate minerals, Geochim. Cosmochim. Ac., 58, 2325–2332, doi:10.1016/0016-7037(94)90013-2, 1994.
Eyring, H.: The activated complex in chemical reactions. J. Chem. Phys. 3, 107–115, 1935.
Finke, P. A.: Modeling the genesis of luvisols as a function of topo-graphic position in loess parent material, Quat. Int., 265, 3–17, doi:10.1016/j.quaint.2011.10.016, 2012.
Finke, P. A. and Hutson, J. L.: Modelling soil gen-esis in calcareous loess, Geoderma, 145, 462–479, doi:10.1016/j.geoderma.2008.01.017, 2008.
Finke, P. A., Vanwalleghem, T., Opolot, E., Poesen, J., and Deck-ers, J.: Estimating the effect of tree uprooting on variation of soil horizon depth by confronting pedogenetic simulations to mea-surements in a Belgian loess area, J. Geophys. Res.-Earth Surf., 118, 2124–2139, doi:10.1002/jgrf.20153, 2013.
Finke, P. A., Samouëlian, A., Suarez-Bonnet, M., Laroche, B., and Cornu, S. S.: Assessing the usage potential of SoilGen2 to predict clay translocation under forest and agricultural land uses, Eur. J. Soil Sci., 66, 194–205, doi:10.1111/ejss.12190, 2015.
Ganor, J., Lu, P., Zheng, Z., and Zhu, C.: Bridging the gap between laboratory measurements and field estimations of silicate weath-ering using simple calculations, Environ. Geol., 53, 599–610, doi:10.1007/s00254-007-0675-0, 2007.
Goddéris, Y., François, L. M., Probst, A., Schott, J., Moncoulon, D., Labat, D., and Viville, D.: Modelling weathering processes at the catchment scale: The WITCH numerical model, Geochim.
Cos-mochim. Ac., 70, 1128–1147, doi:10.1016/j.gca.2005.11.018, 2006.
Goddéris, Y., Brantley, S. L., François, L. M., Schott, J., Pollard, D., Déqué, M., and Dury, M.: Rates of consumption of atmospheric CO2through the weathering of loess during the next 100 yr of climate change, Biogeosciences, 10, 135–148, doi:10.5194/bg-10-135-2013, 2013.
Gudbrandsson, S., Wolff-Boenisch, D., Gislason, S. R. and Oelkers, E. H.: An experimental study of crystalline basalt dissolution from 26pH611 and temperatures from 5 to 75◦C, Geochim. Cosmochim. Ac., 75, 5496–5509, doi:10.1016/j.gca.2011.06.035, 2011.
Hamilton I. P., Pantano C. G., and Brantley S. L.: Dissolution of albite glass and crystal, Geochim. Cosmochim. Ac., 64, 2603– 2615, 2000.
Hartmann, J. and Moosdorf, N.: Chemical weathering rates of silicate-dominated lithological classes and associated lib-eration rates of phosphorus on the Japanese Archipelago-Implications for global scale analysis, Chem. Geol., 287, 125– 157, doi:10.1016/j.chemgeo.2010.12.004, 2011.
Hartmann, J., West, A. J., Renforth, P., Köhler, P., Rocha, C. L. D. La, Wolf-gladrow, D. A., Dürr, H. H., and Scheffran, J.: enhanced chemical weathering as a geoengineering strat-egy to reduce atmospheric carbon dioxide, supply nutrients, and mitigate ocean acidification, Rev. Geophys, 51, 113–149, doi:10.1002/rog.20004, 2013.
Hartmann, J., Moosdorf, N., Lauerwald, R., Hinderer, M., and West, A. J.: Global chemical weathering and associated P-release – The role of lithology, temperature and soil properties, Chem. Geol., 363, 145–163, doi:10.1016/j.chemgeo.2013.10.025, 2014. Harris, P. G., Reay, A., and White, G. I.: Chemical
composi-tion of the upper mantle, J. Geophys. Res., 72, 6359–6369, doi:10.1029/JZ072i024p06359, 1967.
Hellevang, H., Pham, V. T. H., and Aagaard, P.: Kinetic modelling of CO2–water–rock interactions, Int. J. Greenh. Gas Control, 15, 3–15, doi:10.1016/j.ijggc.2013.01.027, 2013.
Hodson, M. E. and Langan, S. J.: The influence of soil age on cal-culated mineral weathering rates, Appl. Geochem., 14, 387–394, 1999.
Hodson, M. E., Langan, S. J., and Wilson, M.: A critical evaluation of the use of the PROFILE model in calculating mineral weath-ering rates, Water, Air Soil Poll., 98, 79–104, 1997.
Holdren Jr., G. R. and Speyer, P. M.: Reaction rate surface area rela-tionships during the early stages of weathering, II. Data on eight additional feldspars, Geochim. Cosmochim. Ac., 51, 2311–2318, 1987.
Jenny, H.: Factors of Soil Formation: A System of Quantitative Pedology, McGraw-Hill, New York, 281 pp., 1941.
Jenkinson, D. S. and Coleman, K.: Calculating the annual input of organic matter to soil from measurements of total organic carbon and radiocarbon, Eur. J. Soil Sci., 45, 167–174, 1994.
Kelsey, C. H.: Calculation of the CIPW norm: Mineralogical Mag-azine, Mineralogical MagMag-azine, 34, 276–282, 1965.
Knauss, K. G. and Wolery, T. J.: The dissolution kinetics of quartz as a function of pH and time at 70◦C, Geochim. Cosmochim. Ac., 52, 43–53, 1988.
Koptsik, G., Teveldal, S., Aamlid, D., and Venn, K.: Calculations of weathering rate and soil solution chemistry for forest soils in the Norwegian-Russian border area with the PROFILE model, Appl. Geochem., 14, 173–185, doi:10.1016/S0883-2927(98)00048-1, 1999.
Koseva, I. S., Watmough, S. A., and Aherne, J.: Estimating base cation weathering rates in Canadian forest soils using a simple texture-based model, Biogeochemistry, 101, 183–196, doi:10.1007/s10533-010-9506-6, 2010.
Lee, M. R., Hodson, M. E., and Parsons, I.: The role of intragranu-lar microtextures and microstructures in chemical and mechani-cal weathering: Direct comparisons of experimentally and natu-rally weathered alkali feldspars, Geochim. Cosmochim. Ac., 62, 2771–2788, doi:10.1016/S0016-7037(98)00200-2, 1998. Maher, K., Steefel, C. I., White, A. F., and Stonestrom, D. A.:
The role of reaction affinity and secondary minerals in regulat-ing chemical weatherregulat-ing rates at the Santa Cruz Soil Chronose-quence, California, Geochim. Cosmochim. Ac., 73, 2804–2831, doi:10.1016/j.gca.2009.01.030, 2009.
Moore, J., Lichtner, P. C., White, A. F., and Brantley, S. L.: Using a reactive transport model to elucidate differences between labora-tory and field dissolution rates in regolith, Geochim. Cosmochim. Ac., 93, 235–261, doi:10.1016/j.gca.2012.03.021, 2012. Morris, M.: Factorial sampling plans for preliminary computational
experiments, Technometrics, 33, 161–174, 1991.
Moulton, K .L., West, J., and Berner, R. A.: Solute Flux and Mineral mass balance approaches to the quantification of plant effects on silicate weathering, Am. J. Sci., 300, 539–570, 2000.
Navarre-Sitchler, A. and Brantley, S.: Basalt weathering across scales, Earth Planet. Sci. Lett., 261, 321–334, doi:10.1016/j.epsl.2007.07.010, 2007.
Oliva, P., Viers, J., and Dupré, B.: Chemical weathering in granitic environments, Chem. Geol., 202, 225–256, doi:10.1016/j.chemgeo.2002.08.001, 2003.
Opolot, E., Yu, Y. Y., and Finke, P. A.: Modeling soil genesis at pedon and landscape scales: Achievements and problems, Quat. Int., 376, 34–46, doi:10.1016/j.quaint.2014.02.017, 2015. Oxburgh, R., Drever, I., and Sun, Y.: Mechanism of plagioclase
dis-solution in acid dis-solution at 25◦C, Geochim. Cosmochim. Ac., 58, 661–669, 1994.
Parry, S. A., Hodson, M. E., Kemp, S. J., and Oelkers, E. H.: The surface area and reactivity of granitic soils: I. Dissolu-tion rates of primary minerals as a funcDissolu-tion of depth and age deduced from field observations, Geoderma, 237–238, 21–35, doi:10.1016/j.geoderma.2014.08.004, 2015.
Pham, V. T. H., Lu, P., Aagaard, P., Zhu, C., and Hellevang, H.: On the potential of CO2–water–rock interactions for CO2 storage using a modified kinetic model, Int. J. Greenh. Gas Control, 5, 1002–1015, doi:10.1016/j.ijggc.2010.12.002, 2011.
Phelan, J., Belyazid, S., Kurz, D., Guthrie, S., Cajka, J., Sverdrup, H., and Waite, R.: Estimation of Soil Base Cation Weathering Rates with the PROFILE Model to Determine Critical Loads of Acidity for Forested Ecosystems in Pennsylvania, USA: Pi-lot Application of a Potential National Methodology, Water, Air, Soil Pollut., 225, 225:2109, doi:10.1007/s11270-014-2109-4, 2014.
Roelandt, C., Goddéris, Y., Bonnet, M.-P., and Sondag, F.: Cou-pled modeling of biospheric and chemical weathering processes at the continental scale, Global Biogeochem. Cy., 24, GB2004, doi:10.1029/2008GB003420, 2010.
Saltelli, A., Ratto, M., Tarantola, S., and Campolongo, F.: Sensitiv-ity Analysis for Chemical Models, Chem. Rev., 105, 2811–2827, 2005.
Sauer, D., Finke, P., Sørensen, R., Sperstad, R., Schülli-Maurer, I., Høeg, H., and Stahr, K.: Testing a soil development model against southern Norway soil chronosequences, Quat. Int., 265, 18–31, doi:10.1016/j.quaint.2011.12.018, 2012.
Siegel, D. I. and Pfannkuch, H. O.: Silicate mineral dissolution at pH 4 and near standard temperature and pressure, Geochim. Cos-mochim. Ac., 48, 197–201, doi:10.1016/0016-7037(84)90362-4, 1984.
Smeck, N. E. and Ciolkosz, E. J.: Fragipans: their occurrence, classification and genesis, SSSA Spec. Publ., 24. Soil Sci. Soc. Amer., Madison. 153 pp., 1989.
Soil Survey Division Staff: Soil survey manual, Soil Conservation Service, US Department of Agriculture, Handbook 18, chapter 3, 1993.
Stendahl, J., Akselsson, C., Melkerud, P.-A., and Belyazid, S.: Pedon-scale silicate weathering: comparison of the PROFILE model and the depletion method at 16 forest sites in Sweden, Geoderma, 211-212, 65–74, doi:10.1016/j.geoderma.2013.07.005, 2013.
Stillings, L. L. and Susan, L.: Feldspar dissolution at 25◦C and pH 3: Reaction stoichiometry and the effect of cations, Geochim. Cosmochim. Ac., 59, 1483–1496, 1995.
Stiillings, L. L., Drever, J. I., Brantley, S. L., Sun, Y., and Oxburgh, R.: chemical Rates of feldspar dissolution at pH 3–7 with 0–8 m M oxalic acid, Chem. Geol., 132, 79–89, 1996.
Sverdrup, H. and Warfvinge, P.: Estimating field weathering rates using laboratory kinetics, in: Weathering Kinetics of Silicate Minerals, edited by: White, A. and Brantley, S., Reviews in Min-eralogy 31. Min. Soc. of America, 485–542, 1995.
Swoboda-Colberg, N. G. and Drever, J. I.: Mineral dissolution rates in plot-scale field and laboratory experiments, Chem. Geol., 105, 51–69, doi:10.1016/0009-2541(93)90118-3, 1993.
Van Ranst, E.: Genesis and properties of silty forest soils in cen-tral Belgium and the Ardennes, Unpublished PhD thesis, Ghent University, Belgium, 349 pp., 1981 (in Dutch).
Velbel, M. A.: Constancy of silicate-mineral weathering-rate ratios between natural and experimental weathering: implications for hydrologic control of differences in absolute rates, Chem. Geol., 105, 89–99, doi:10.1016/0009-2541(93)90120-8, 1993. Violette, A., Goddéris, Y., Maréchal, J.-C., Riotte, J., Oliva, P.,
Kumar, M. S. M., Sekhar, M., and Braun, J.-J.: Modelling the chemical weathering fluxes at the watershed scale in the Trop-ics (Mule Hole, South India): Relative contribution of the smec-tite/kaolinite assemblage versus primary minerals, Chem. Geol., 277, 42–60, doi:10.1016/j.chemgeo.2010.07.009, 2010. Welch S. A. and Ullman W. J.: Feldspar dissolution in acidic and
organic solutions: Compositional and pH dependence of dissolu-tion rate, Geochim. Cosmochim. Ac., 60, 2939–2948, 1996. White, A. F.: Natural weathering rates of silicate minerals, Treatise
on geochemistry, 5.05, 133–168, 2003.
applica-tion to biotite weathering in saprolites, Chem. Geol., 190, 69–89, doi:10.1016/S0009-2541(02)00111-0, 2002.
White, A. F. and Brantley, S. L.: The effect of time on the weathering of silicate minerals: why do weathering rates dif-fer in the laboratory and field?, Chem. Geol., 202, 479–506, doi:10.1016/j.chemgeo.2003.03.001, 2003.
White, A. R. T. F., Blum, A. E., Schulz, M. S., Bullen, T. O. M. D., Harden, J. W., Peterson, M. L., Survey, U. S. G., and Park, M.: Chemical weathering rates of a soil chronosequence on granitic alluvium?: I . Quantification of mineralogical and surface area changes and calculation of primary silicate reaction rates, Geochim. Cosmochim. Ac., 60, 2533–2550, 1996. Whitfield, C. J., Aherne, J., Watmough, S. A., and Mcdonald,
M.: Estimating the sensitivity of forest soils to acid deposi-tion in the Athabasca Oil Sands Region, Alberta, 69, 201–208, doi:10.3274/JL10-69-S1-20, 2010.
Wosten, J. H. M., Lilly, A., Nemes, A., and Le Bas, C.: De-velopment and use of a database of hydraulic properties of European soils. Geoderma, 90, 169–185, doi:10.1016/S0016-7061(98)00132-3, 1999.
Yu, Y. Y., Finke, P. A., Wu, H. B., and Guo, Z. T.: Sensitivity analysis and calibration of a soil carbon model (SoilGen2) in two contrasting loess forest soils, Geosci. Model Dev., 6, 29–44, doi:10.5194/gmd-6-29-2013, 2013.
Zhu, C.: In situ feldspar dissolution rates in an
aquifer, Geochim. Cosmochim. Ac., 69, 1435–1449, doi:10.1016/j.gca.2004.09.005, 2005.
Zhu, C. and Lu, P.: Alkali feldspar dissolution and secondary min-eral precipitation in batch systems: 3. Saturation states of prod-uct minerals and reaction paths, Geochim. Cosmochim. Ac., 73, 3171–3200, doi:10.1016/j.gca.2009.03.015, 2009.
Zhu, C., Lu, P., Zheng, Z., and Ganor, J.: Coupled alkali feldspar dissolution and secondary mineral precipitation in batch systems: 4. Numerical modeling of kinetic reaction paths, Geochim. Cos-mochim. Ac., 74, 3963–3983, doi:10.1016/j.gca.2010.04.012, 2010.