Iranian Chemical Society
Anal. Bioanal. Chem. Res., Vol. 6, No. 2, 457-476, December 2019.
pH Independent Complexation of 2-Aminobenzimidazole with β-cyclodextrin
R. Rajamohan
a,*, S. Kothai Nayaki
b, M. Swaminathan
cand K. Sivakumar
da
Centre for Nanoscience and Technology, Pondicherry University, Puducherry - 605014, India
b
Chemistry Section, FEAT, Annamalai University, Annamalainagar 608 002, India
c
International Research Centre, Kalasalingam University, Krishnankoil - 626 126, India
d
Department of Chemistry, SCSVMVUniversity, Enathur, Kanchipuram - 631561, India (Received 12 February 2019 Accepted 30 April 2019)
The spectral characteristics of 2-aminobenzimidazole (2ABZ) in aqueous and β-cyclodextrin media has been investigated using absorption, steady state and time resolved fluorescence techniques. The stoichiometric ratio of the inclusion complex of neutral and
monocationic forms of 2ABZ in β-CDx medium is found to be 1:1. There is no significant differences between ground and the excited state pKavalues of 2ABZ under both the media and thus the amino group of 2ABZ molecule is not much affected by the complexation process i.e., it lies outside the β-CDx cavity. Considering the shape and dimensions of β-CDx, it is clear that the 2ABZ molecule cannot be completely included in the β-CDx cavity. Because, the overall height of 2ABZ is 10.6 Å, but the overall height of β-CDx is only 7.8 Å. Hence, it is possible to locate half of the 2ABZ molecule only permitted inside the β-CDx cavity as interpreted using experimental data.
Keywords: 2-Aminobenzimidazole, Inclusion complex, Lifetime, Acidity constant, Patch-Dock server
INTRODUCTION
The concept of supramolecular chemistry has attracted lots of attention from chemists, biologists, and material scientists, where they utilize the non-covalent interactions, including hydrogen-bonding interaction, π-π stacking interaction, electrostatic interaction, van der Waals force, and hydrophobic/hydrophilic attraction, to explain the systems from easy to be complicated [1-5]. During the past decades, considerable efforts have been paid to develop numerous supramolecular systems and to investigate their applications in catalysis, functional materials, electronic devices, sensors, nanomedicine, and so on [6-10].
As compared to covalent interactions, the non-covalent interactions present several advantages. First, the non-covalent interactions provide easy and facile approaches for building supramolecular structures, which could eliminate
*Corresponding author. E-mail: rajmohanau@gmail.com
several synthesis steps and a tedious purification process during the fabrications [11]. Such supramolecular methods are often cost effective and environmentally friendly. Out of numerous non-covalent bonding type interaction, the significant one among all is the host-guest interaction and it has been generally explored. Through host-guest incorporation process, two or more chemical molecules can be integrated together in an easy and reversible manner, providing endless possibilities for the preparation of novel supramolecular structures.
Supramolecular chemistry is a hot topic in current chemical research. Supramolecular chemistry aims at developing highly complexed chemical systems from
components through interacting by non-covalent
selectively binds a certain guest, is cited as an important contribution. The construction of supramolecular systems involves selective molecular combination between host and guest [12-13]. Among various potential hosts, cyclodextrins seem to be the most important host molecules to construct various molecular assemblies [14-15].
Macrocycles are exact worthwhile in supramolecular chemistry, because they provide whole cavities, which can completely surround guest molecules. The macromolecules such as Cyclodextrins, calixarenes, cucurbiturils and crown ethers are readily synthesized in large quantities and are used in supramolecular systems. More complex cyclophanes and cryptands can be synthesized to provide more tailored recognition properties. Supramolecular metallacycle is macrocyclic aggregates with metal ions in the ring, often formed from angular and linear modules. Common metallic cycle shapes pieces bearing functional groups are connected
via "self-assembly" in these types of applications include triangles, squares, and pentagons [16]. From fused chelate-rings, the metal macrocycles metallacrowns generated through a similar self-assembly approach.
Within the CD family, the ones containing 6, 7 and 8 glucose units are most commonly used, named as α-, β- and γ-CD, respectively. The CDs have a truncated cone-resembled shape with a hollow cavity. The sizes of the primary and secondary sides of the CDs are dependent on the unit number of glucose. The depth of the hollow cavity is 0.78 nm for all three types of CDs. The hydroxyl groups of the glucose units are oriented toward the outside at the orifice of the two ends, while methinic protons are located inside the cavity, the structure of which enables CDs with hydrophilic external surface and hydrophobic hollow cavity. Thus, a variety of guests can be encapsulated into the cavity via the host-guest. By this means, the guest molecules are incorporated into the space through the non-bonding interaction in both solid as well as liquid nature of fine sized molecules [17], charged species [18], amino molecules [19], and polymeric chains [20-23].
In this article, we have measured the absorption and fluorescence spectral changes of 2ABZ by the addition of β-CDx. The confirmation of complexation between 2ABZ and β-CDx has also been done by fluorescence lifetime analysis through the production of bi-exponential decay. The stoichiometry and binding constant values of the host-
guest complexes has also found and supported for 1:1. The confirmation of the formation of complex between guest and β-CDx by the analysis of FT-IR and SEM image in the solid state. The determination of the ground and excited state acidity constant values of complexed 2ABZ with
β-CDx and the structure of the inclusion complexes are proposed using the software MOPAC/AM1/PM3.
MATERIALS AND METHODS
Materials
The fluorophore 2ABZ is obtained from Aldrich chemical company. β-Cyclodextrin (β-CDx) and D (+) -glucose are purchased from SD fine chemicals. All the above compounds have been purified by recrystallisation using the solvents reported in the literature [24]. Spectrograde methanol (BDH) is used without further purification. An Analar grade of other solvents such as cyclohexane and trifluoroacetic acid (TFA) is further purified according to a procedure suggested in the literature [24]. The Purity of the compounds is checked by thin layer chromatography and sharp melting point and by using fluorescence technique i.e.,
by getting same spectral profile when excited with different wavelengths. The purity and transparency of the solvents are checked by UV spectra recorded using triply distilled water as the reference. Solvents are also tested for spurious fluorescence emission.
Preparation of Solutions
Preparation of Solid Inclusion Complexes
The preparation of solid complexes of 2ABZ with β-CDx is performed using co-precipitation method and for the reference, the physical mixture (PM) is also prepared. 2ABZ and β-CDx with 1:1 molar ratio is accurately weighed. Saturated CDx solutions are prepared using β-CDx and water. Then, the 2ABZ solution in methanol is added slowly and a suspension is formed. The suspension is kept for stirring at 38 °C for 36 h. The obtained masses are filtered through 0.45 µm membrane filter and dried at 105 °C in an oven up to 90 min. The dried complex is ground to a fine powder and screened through 80-mesh sieve.
Jobs Method of Analysis
The determination of complex stoichiometry can be provided by the continuous variation technique (Job’s plot) based on the difference in absorbance, OD (OD = A - A0) of 2ABZ observed in the presence of β-CDx. An equimolar solutions of the 2ABZ and the corresponding β-CDx is prepared and mixed to standard volumes and proportions in order that the total concentration remained constant ([2ABZ]t + [β-CDx]t = M) but the ratio of the initial concentrations varied between zero and one. OD values in the preparations of the guests are calculated by measuring the absorbance of 2ABZ in the absence (A0) and the presence (A) of the corresponding concentrations of β-CDx. Also, an equimolar solution of β-CDx is used as a blank, to take into account its refractive index.
Subsequently, OD is plotted for the corresponding
β-CDx against mole fraction {mole fraction =
[2ABZ]t/([2ABZ]t + [β-CDx]). This means that if the complex stoichiometry is 1:1 (2ABZ, β-CDx = 1), the maxima value for the examined parameter will be reached at mole fraction = 0.5; if the complex stoichiometry is 1:2 (2ABZ = 1, β-CDx = 2), the maximum value will be reached at mole fraction is 0.35.
Determination of Ground State Acidity Constant
(pK
a)
Absorption spectra of an acid and its conjugate base are different enough that clear isosbestic points could be obtained. Two sets of wavelengths on either side of the isosbestic points are selected and absorbance at these are
measured. Calculation for different set of are also done separately. The concentration of each species at a different pH is calculated from the following equation
C1 =
) ( ) ( -) ( ) ( ) ( ) ( A -) ( ) (λ A 1 2 2 1 2 2 1 2 1 2 2 2 2 1
(1)
C2 = CT - C1
where CT is the total concentration of the compound in both forms and 1(1), 1(2), 2(1) and 2(2) are the molar extinction coefficients of species 1 and 2 at wavelengths 1 and 2, respectively. The latter are determined from the absorbance at a pH pKa 2 where only one species is present. The pKa for the equilibrium
BH B- + H+ BH+ - species 1 B- - species2
is calculated by using the equation
pKa = pH + log
2 1
C
C (2)
Instruments Used
Absorption spectra are recorded with HITACHI model U-2001 spectrophotometer. Fluorescence measurements are made using a Shimadzu RF-5301 PC spectrofluorimeter. pH of various solutions employed using ELICO LI-10T model
pH-meter. Single photon counting picosecond
spectrofluorimeter (TSUNAMI, SPECTRA PHYSICS, USA) is used for the measurements of fluorescence lifetime of the fluorophores. FT-IR spectra are obtained with Avatar-330 FT-IR spectrophotometer using KBr pellets. The spectral range is 500-4000 cm-1. Microscopic morphological structural measurements are performed with JEOI-JSM 5610 LV scanning electron microscope (SEM). Various bond lengths of the 2ABZ chosen as fluorophore are calculated theoretically using the computer program Argus lab MOPAC/AM1.
Picosecond
Time Correlated Single Photon
Counting (TCSPC) Spectrofluorimeter
using a picosecond laser and single photon counting setup. A diode pumped Millena CW laser (Spectra Analysis) at 532 nm. This instrument is adopted to record the fluorescence lifetime analysis. To pump the Ti-Sapphire rod, CW laser type diode is used here in this Tsunami picosecond mode locked laser system. The Ti-Sapphire rod is oriented at Brewster’s angle to the laser beam. The wavelength turning range is 720-850 nm, i.e., standard pico configuration. The pulse repetition rate is 82 MHz and the FWHM is less than 2 ps. Scanning auto correlator (Model 409-08, Spectra Physics) is used to check the shape and duration of the pulse from the Tsunami. The pulse is displayed on an oscilloscope for real time viewing. The laser pulse is next focused to the pulse from the 82 MHz train at a maximum pulse selection rate of 4 MHz. The output from the pulse which aligned at Brewster angle to the path of the laser beam, with the standard wavelength of 720-850 nm. The repetition of the pulse beam is at the range of 82 MHz and the FWHM is be of less than 2 ps. The arrived graph shape and the pulse rate from the Tsunami is checked for its correctness using the Auto scanning correlator. By means of an oscilloscope the obtained pulses are produced in real time display and it continue on pulsating.
The frequency of the pulse picker output is doubled using flexible Harmonic generator (FHG-23 Spectra Physics). The frequency doubled 375 nm output is used to excite the sample. The focal length is assumed to be 10 cm with space of f/3 for the emission monochromator (Seya-Namioka configuration) and its frequency is choose both auto or by manual mean. Hamamatsu 323P MCP photomultiplier is utilized to identify the excited beam whose path is right opposite to it and its output is collected through the magic angle polarisation. the cm focal length and f/3 aperture. The wavelength selection in the
monochromator is achieved either manually or
automatically via the P.C. The emission is detected at right angles to the excitation beam using a Hamamatsu 323P MCP photomultiplier. The emissions are collected at magic angle polarisation (54.7) to avoid bias due to polarisation effects for all viewing angles. The instrument response time is 50 Ps. Flourescence decay is measured at the front face configuration with suitable cutoff filters to avoid scattered light and the decay curve is analysed using
IBH (UK) software (DAS-6). The overall time taken to carry out the measurement is found to be approximately 50 Ps.
Molecular Docking Study
The most probable structure of the 2ABZ: β-CD inclusion complex is determined also by molecular docking studies using the Patch-Dock server [25]. The 3D structural data of β-CD and 2ABZ is obtained from crystallographic databases. The guest molecule (2ABZ) is docked in to the host molecule (β-CD) cavity using Patch-Dock server by submitting the 3D coordinate data of 2ABZ and β-CD molecules. Docking is performed with complex type configuration settings. Patch-Dock server follows a geometry-based molecular docking algorithm to find the docking transformations with good molecular shape complementarity. Patch-Dock algorithm separates the Connolly dot surface representation [26-27] of the molecules into concave, convex and flat patches. These divided complementary patches are matched in order to generate candidate transformations and evaluated by geometric fit and atomic desolvation energy scoring function. RMSD (root mean square deviation) clustering is applied to the docked solutions to select the non-redundant results and to discard redundant docking structures.
Semi-empirical Quantum Mechanical Calculations
The ground state of 2ABZ molecule is optimized using ArgusLab program by AM1 method. MolSoft MolBrowser
tool is used to visualize the 3D structural data.
RESULTS AND DISCUSSION
Effect of β-CDx Concentration
complexation through the hydrophobic interaction between guest molecule and β-CDx.
The β-CDx dependence of 2ABZ absorbance is analysed by the Benesi-Hildebrand equation [28-29]. Figure 1 shows the plot of 1/(A) vs. 1/[β-CDx] for neutral and monocationic forms of 2ABZ. The linearity of the plot shows the formation of 1:1 complex for 2ABZ-β-CDx and 2ABZH-β-CDx. Binding constant values are calculated to be 164.1 and 155.9 M-1, for 2ABZ-β-CDx and 2ABZH-β-CDx, respectively at 303 K.
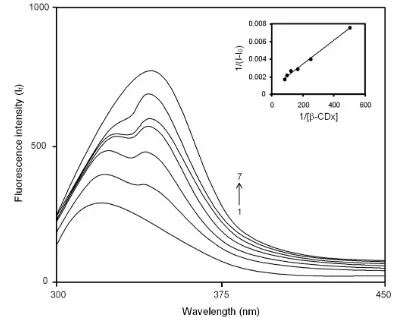
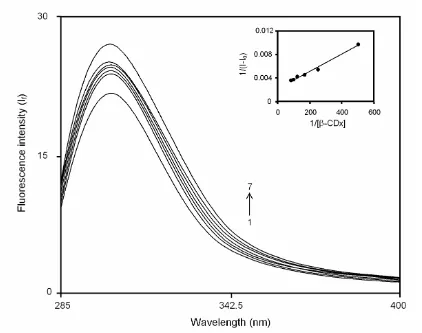
Figures 2 and 3 represent the fluorescence spectra of 2ABZ at pH 8.1 and 1.1 with different concentrations of β-CDx. The addition of β-CDx concentration, the fluorescence intensity has increased continuously with
the red shift in their maximum at both pH conditions. Beyond the 12 10-3 M, no change in the maximum and fluorescence intensity are observed. These remarkable changes indicated that the complete accommodation of
2ABZ molecule in β-CDx cavity. Hence, the
complexation is completed at the 12 10-3 M of β-CDx concentration.
The β-CDx dependence of 2ABZ fluorescence is analysed by the Benesi-Hildebrand equation [28-29]. Here also, the obtained graph of linear in nature indicates the complexiation between the host and the guest. The inset Figs. 2 and 3 are the output graph of plotting 1/(I - I0) vs. 1/[β-CDx]. The binding constants are found to be 184.5 and 183.2 M-1 for neutral and monocationic forms of
Table 1. Absorption and Fluorescence Maxima of 2ABZ with Different Concentrations of -CDx at pH 8.1
and 1.1
pH 8.1 pH 1.1
Concentrations of
-CDx (mol dm-3)
max (nm) (abs)
max (nm) (abs)
flu (nm)
max (nm) (abs)
max (nm) (abs) flu (nm) 0 280.2 (0.165) 240.0 (0.146) 323.0 - 279.6 (0.134) 274.8 (0.134) 301.0
2 10-3
280.0 (0.186) 240.0 (0.168) 323.0 340.0 (s) 279.4 (0.178) 274.2 (0.192) 300.5
4 10-3
279.6 (0.241) 239.6 (0.189) 325.0 341.0 279.4 (0.199) 274.2 (0.215) 300.5
6 10-3
279.6 (0.261) 239.6 (0.215) 327.0 342.0 279.2 (0.262) 274.2 (0.281) 300.0
8 10-3
279.2 (0.329) 239.6 (0.250) 329.0 (s) 342.0 279.0 (0.300) 274.2 (0.321) 299.0
10 10-3
278.8 (0.357) 239.4 (0.289) 336.0 (s) 342.5 278.6 (0.341) 274.0 (0.351) 298.5
12 10-3
2ABZ with β-CDx, respectively, at 303 K.
The Job’s plot using absorption data (Fig. 4) confirmed
the stoichiometry of the inclusion complex of 2ABZ with
β-CDx. The figure indicated that the complexation is 1:1
stoichiometric ratio, since the OD is maximum at 0.5.
The decay curves of 2ABZ in the presence of β-CDx
gave a best fit for bi-exponential decay with good 2 values (less than 1.26). The amplitude and lifetime of the β-CDx
complexed form of 2ABZ increased upto a concentration of
0.012 M β-CDx (Table 2) and there is no further change in
the lifetime and relative amplitude above this concentration.
The bi-exponential decay observed in presence of β-CDx.
The lifetime and relative amplitudes of complexed form has
been increased remarkably and which confirmed the
formation of inclusion complex between 2ABZ and β-CDx.
The bi-exponential function is given by the Eq. (3)
I(t) = B1exp(-t/τ1)B2exp(-t/τ2) (3)
where, 1 and 2 are lifetimes of the two components, B1 and B2 are the pre-exponential factors of the same and ‘t’ is
time. The binding constant ‘K’ can be calculated [30] using Eq. (4),
CDx] -[
1
2 K
B B
(4)
The plot of B2/B1 vs. [β-CDx] is of linear type, which corresponds to the 1:1 complexion between the β-CDx
and 2ABZ, which is given in Fig. 5. The binding constant (K) value is found to be 190.4 M-1 at room
temperature.
The free energy change (G) is calculated from the binding constant K using the following Eq. (5).
G = – 2.303 RT logK (5)
The thermodynamic parameter, G values for the binding of the 2ABZ with β-CDx using absorption and fluorescence data are given in Table 3. The negative values of G indicate that the formation of inclusion complex between both forms of 2ABZ and β-CDx is exergonic and spontaneous at room temperature.
With aqueous D (+) glucose, the absorption and fluorescence spectra of 2ABZ are not significantly changed, which confirms that all the spectral changes of 2ABZ in β-CDx is only due to inclusion process.
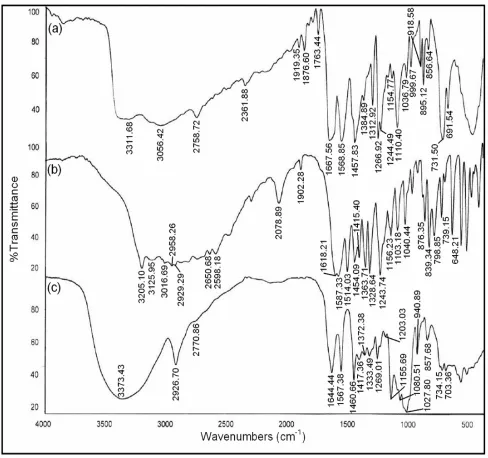
The inclusion complexation in solid state is analyzed by FT-IR and SEM analysis. FT-IR spectra of pure 2ABZ, PM
and solid complex of 2ABZ with β-CDx are shown in Fig. 6. The N-H and C-H (aromatic) stretching vibrations of pure 2ABZ appears at 3311.68 and 3056.42 cm-1, whereas they are completely merged and observed at 3373.43 cm-1 for the solid complex. Further, the C=N stretching frequency observed at 1568.85 cm-1 in pure 2ABZ and it is shifted to 1644.44 cm-1 for the solid complex. The stretching frequencies in the solid complex are significantly weaker (10-20%) than pure 2ABZ. Hence, the FT-IR spectral analysis confirmed the formation of inclusion complex between 2ABZ and β-CDx.
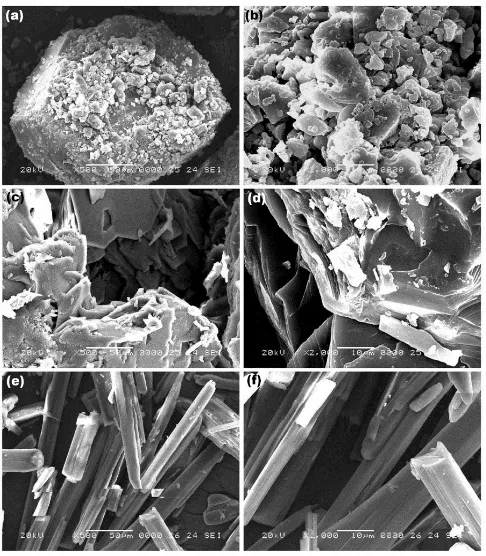
Supporting evidence for the complexation of 2ABZ with β-CDx is also obtained from SEM image analysis. Figure 7 indicated the SEM images of pure 2ABZ, PM and solid Fig. 2. Fluorescence spectra of 2ABZ (concentration = 2.59 × 10⁻⁵ M) with increasing concentrations of
complex of 2ABZ with β-CDx. There are two magnifications (X500 and X2000) are used to visualize the
shape of the each samples. Each sample showed no much difference in both the magnifications while comparing with
other samples. However, quite differences are noticed between the samples. The images of pure 2ABZ possessing
a stone like structures (Figs. 7a and b), but it became a clear needle like structure (Figs. 7e and f) for solid complex. On
the other hand, the PM sample has such a colloidal structure indicating the slight influence of β-CDx on 2ABZ, but not
much differed their shape of 2ABZ. Thus, the morphological differences for the samples can be taken as the tool for the complexation of 2ABZ: β-CDx.
Effect of Acid-base Concentration
The effect of pH on the absorption spectra of 2ABZ has
been studied in the range of H0 -3 to pH 7 in aqueous and β-CDx solutions (Figs. 8 and 9). The absorption spectrum of
the neutral form of 2ABZ at pH 7.0 has the maxima at 280.2 and 240.0 nm in aqueous solution while in β-CDx solution at
278.4 and 239.2 nm. When pH is decreased, a blue shifted spectrum is obtained around pH 1.5 for both the solutions
which evident that the formation of monocation of 2ABZ by the protonation of the amino group. The absorption
maxima of monocation in aqueous and β-CDx solutions are 279.6 (s) & 274.8 and 278.6 (s) & 274.0 nm, respectively. Further increases in acid concentration, Fig. 3. Fluorescence spectra of 2ABZ (concentration = 2.59 × 10⁻⁵ M) with increasing concentrations of β-CDx
Fig. 4. Job’s plot of 2ABZ with β-CDx (λabs = 278.0 nm).
which does not influence the absorption spectrum significantly.
When pH increased from 7.0, there is no significant change in the absorption spectra even upto pH 12.0. For the
monocation-neutral equilibrium of 2ABZ, clear isosbestic points at 259.0 and 260.2 nm are observed in aqueous and β-CDx solutions, respectively. The ground state pKa values for the monocation-neutral equilibrium of 2ABZ in aqueous Table 2. Fluorescence Lifetime and Amplitudes of 2ABZ with Increasing Concentrations of -CDx at pH 8.1 (Excitation Wavelength 280.0 nm; Detection Wavelength 334.0 nm)
Concentrations of -CDx (mol dm-3)
Lifetime, s Relative amplitude 2 Standard deviation
0 2.002 10-10 100 1.26 1.83 10-12
2 10-3
1.99 10-10 1.34 10-9
39.85
60.17
1.11
1.56 10-12 2.07 10-10
4 10-3
1.99 10-10 1.64 10-10
34.32
65.68
1.17
2.73 10-12 8.50 10-11
6 10-3
1.99 10-10 1.69 10-9
33.65
66.35
1.09
5.32 10-12 9.78 10-11
8 10-3
1.85 10-10 1.89 10-9
32.75
67.25
1.05
7.66 10-12 7.88 10-11
10 10-3
1.75 10-10 2.24 10-9
26.81
73.19
1.26
6.52 10-12 1.18 10-11
12 10-3
1.75 10-10 2.54 10-9
21.59
78.41
1.10
5.99 10-12 1.04 10-10
Table 3. Binding Constants and Gibb’s Free Energy Change Values of 2ABZ in -CDx Medium
Neutral Monocation
Parameters
Absorption Fluorescence Life time Absorption Fluorescence
K(M-1) 164.1 184.5 190.4 155.9 183.2
G (kJ mol-1) -10.11 -10.74 -10.81 10.08 -10.71
r 0.998 0.997 0.998 0.978 0.994
Standard
deviation
and β-CDx solutions are determined spectrophotometrically and found to be 6.5 and 6.4, respectively.
The fluorescence spectra of 2ABZ in aqueous solution at different pH/H0 values are shown in Fig. 10. At pH 7, the neutral species shows a maximum at 323.0 nm. When pH is decreased, the fluorescence intensity of the at 323.0 nm is
decreased. At pH 3.5, a new spectral maximum is appeared
at 301.0 nm. Further increase in acid concentration, there is
no spectral shift is observed. This blue shifted spectrum
may be due to formation of monocation of 2ABZ obtained
by the protonation of -NH2 group. The absorption and
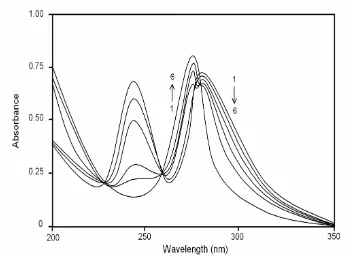
Fig. 8. Absorption spectra of 2ABZ (concentration = 2.59 × 10⁻⁵ M) without β-CDx at different pH values: 1. pH 9.4, 2. pH 8.4, 3. pH 7.2, 4. pH 6.6, 5. pH 5.3, 6. pH 4.7.
Fig. 10. Fluorescence spectra of 2ABZ (concentration = 2.59 × 10⁻⁵ M) without β-CDx at different pH values: 1. pH 9.4, 2. pH 8.4, 3. pH 7.2, 4. pH 6.6, 5. pH 5.3, 6. pH 4.7, 7. pH 3.8, 8. pH 2.9, 9.
pH 1.7, 10. pH 1.1 (λexc = 259.0 nm) (Inset: Fluorimetric titration curves for 2ABZ without β-CDx).
Table 4. Absorption and Fluorescence Spectral Maxima of Neutral and Monocationic Forms of 2ABZ in Aqueous and -CDx Media
Absorption maxima
(nm)
Fluorescence maxima
(nm) pH
Aqueous medium -CDx medium Aqueous medium -CDx medium
7.0
280.2
240.0
278.4
239.2
323.0 343.0
1.1
279.6 (s)
274.8
278.6 (s)
274.0
301.0 298.5
forms of 2ABZ in aqueous and β-CDx media are given in Table 4.
The fluorescence spectra of 2ABZ in β-CDx at various pH/H0 values are shown in Fig. 11. The neutral form of 2ABZ in β-CDx shown a fluorescence maximum 343.0 nm. When pH is decreased, a blue shifted maximum is obtained at 298.5 nm which is attributed to the formation of monocation.
The plots of fluorescence intensities of 2ABZ at
different H0/pH values in aqueous and β-CDx media are
shown in inset Figs. 10 and 11. Both the figures, two curves
are met at pH 3.9 and 3.7 which are taken as pKa*values for
monocation-neutral equilibrium (Table 5) of 2ABZ in
aqueous and β-CDx media, respectively. The pKa values of
2ABZ for the monocation-neutral equilibrium in aqueous
and β-CDx media are found to be a different rather than
observed for other aromatic amines. In 2ABZ, the amino Fig. 11. Fluorescence spectra of 2ABZ (concentration = 2.59 × 10⁻⁵ M) with β-CDx (concentration = 12.0 × 10⁻³ M) at different pH values: 1. pH 5.3, 2. pH 4.8, 3. pH 4.3, 4. pH 3.8, 5. pH 3.3, 6. pH 2.7, 7. pH 2.1 (λexc = 258.0 nm) (Inset: Fluorimetric titration curves for 2ABZ with β-CDx).
Table 5. Ground and Excited State Acidity Constant Values of 2ABZ in Aqueous and -CDx Media
Acidity constant Equilibrium
monocation neutral Ground state pKa Excited state pKa
Without -CDx 6.5 3.9
Fig. 12. MOPAC/AM1 of (a) optimized structure of 2ABZ, (b) optimized structure of 2ABZH+, (c) schematic diagram of inclusion complex (1:1) of 2ABZ with β-CDx and (d) schematic diagram of inclusion complex (1:1) of 2ABZH+ with β-CDx.
Table 6. Bond lengths between Various Atoms of 2ABZ and its Cation
Atoms Bond distance
(Å)
Neutral
H14-H16 7.23
H13-H17 7.54
H11-H12 5.06
H14-N7 4.69
H14-C8 5.59
Cation
H14-H16 7.46
H13-H17 7.34
H11-H12 5.08
H14-N7 4.68
H14-C8 5.56
(-NH2) group lies in between >NH group and ring nitrogen atom. The existence of strong intramolecular hydrogen bonding facilitates the protonation of -NH2 group of 2ABZ with great ease in the ground state. Such type of interaction is found to be less effective in the excited state. So, the pKa* values are found to be around 3.5, as observed for other aromatic amines. The stoichiometry of the inclusion complex of both forms of 2ABZ in β-CDx is found to be 1:1. There is no
significant difference in ground and the excited state pKa values of 2ABZ in aqueous and β-CDx media. This shows that the amino group is not affected during complexation
i.e., it lies outside the β-CDx cavity.
Calculations using the software MOPAC/AM1 show that length of 2ABZ molecule and its cation 2ABZH is 7.23 and 7.46 Å, respectively (Table 6). Based on low values of binding constant, the structures of inclusion Fig. 13. Ball and stick representation of (a) β-CD (b) 2ABZ and (c) 1:1 inclusion complex; the oxygen atoms are
complexes of 2ABZ and its cation in β-CDx are proposed as in Fig. 12.
Molecular Docking Study of Inclusion Process
The 3D structure of β-CDx and 2ABZ obtained from crystallographic databases are shown in Figs. 13a and 13b. The guest molecule, 2ABZ is docked into the cavity of β-CDx using Patch-Dock server. The Patch-Dock server program gave several possible docked models for the most probable structure based on the energetic parameters; geometric shape complementarity score [31], approximate interface area size and atomic contact energy [32] of the 2ABZ: β-CDx inclusion complex (Table 7). The docked 2ABZ: β-CDx 1:1 model (Fig. 13c) with the highest geometric shape complementarity score 2220, approximate interface area size of the complex 241.40 Å2 and atomic contact energy -192.45 kcal mol-1 is the highly probable and energetically favorable model and it is in good correlation
with results obtained through experimental methods.
Semi-empirical Quantum Mechanical Calculations
The internal diameter of the β-CDx is approximately 6.5 Åand its height is 7.8 Å (Fig. 14a). Considering the shape and dimensions of β-CDx, it is clear that the 2ABZ molecule cannot be completely included in the β-CDx cavity because, the overall height of 2ABZ is 10.6 Åshown in Fig. 14b and Table 8 (i.e., the vertical distance between H19-H32), but the overall height of β-CDx is only 7.8 Å. Hence, it is possible to locate half of the 2ABZ molecule inside the β-CDx cavity as interpreted using experimental data.
CONCLUSIONS
The addition of β-CDx concentration on 2ABZ, the absorbance and fluorescence intensities are enhanced Table 7. Scores of the Top 7 Docked Models of 2ABZ: β-CD Inclusion Complex Computed Using
Patch-Dock server.
Model
Geometric shape
complementarity score
Approximate interface area
size of the complex
Atomic contact energy
1 2220 241.40 -192.45
2 2200 233.80 -188.23
3 1826 194.10 -164.84
4 1792 186.60 -142.25
5 1556 163.60 -111.91
6 1460 198.70 -151.12
7 1318 137.00 -136.01
Table 8. Bond Distances and Orientations is 2ABZ
2ABZ atom distance in Å Orientation
H13-H15 7.6 Vertical
continuously with blue and red shifted maxima, respectively at both pH conditions indicating the formation of complex between 2ABZ and β-CDx. Moreover, the lifetime values are also enhanced significantly for the 2ABZ: β-CDx than the free 2ABZ molecule. Since, no much influence of β-CDx on 2ABZ molecule while varying the pH solution, the amino group of 2ABZ is lies to aqueous environment and not encapsulated to β-CDx environment. Finally, half of the 2ABZ molecule only included inside the β-CDx cavity through docking study and it is interpreted using experimental data.
REFERENCES
[1] R.P. Sijbesma, F.H. Beijer, L. Brunsveld, B.J. Folmer, J.H. Hirschberg, R.F. Lange, J.K. Lowe, E.W. Meijer, Science 278 (1997) 1601.
[2] T. Park, S.C. Zimmerman, S. Nakashima, J. Am. Chem. Soc 127 (2005) 6520.
[3] J.H. Ryu, D.J. Hong, M. Lee, Chem. Commun 127 (2008) 1043.
[4] J.D. Hartgerink, E. Beniash, S.I. Stupp, Science 294 (2001) 1684.
[5] Z. Zhang, Y. Luo, J. Chen, S. Dong, Y. Yu, Z. Ma, F. Huang, Angew. Chem. Int. Ed. 50 (2011) 1397. [6] K. Ariga, T. Kunitake, Springer-Verlag, Berlin,
Heidelberg, New York, 2006.
[7] H.J. Schneider, Taylor & Francis: Boca Raton, FL. (2012).
[8] F. Wang, J. Zhang, X. Ding, S. Dong, M. Liu, B. Zheng, S. Li, L. Wu, Y. Yu, H.W. Gibson, F. Huang, Angew. Chem. Int. Ed. 49 (2010) 1090.
[9] W. Zhang, W. Jin, T. Fukushima, A. Saeki, S. Seki, T. Aida, Science 334 (2011) 340.
[10] F. Wang, C. Han, C. He, Q. Zhou, J. Zhang, C. Wang, N. Li, F. Huang, J. Am. Chem. Soc. 130 (2008) 11254.
[11] B. Rybtchinski, ACS Nano 5 (2011) 6791.
[12] K.E. Schmalenberg, L. Frauchiger, L. Nikkhouy-Albers, K.E. Uhrich, Biomacromol. 2(2001) 851. [13] T. Govender, T. Riley, T. Ehtezazi, M.C. Garnett, S.
Stolnik, L. Illum, S.S. Davis, Int. J. Pharm. 199 (2000) 95.
[14] K. Ariga, T. Kunitake, Springer-Verlag, Berlin, Heidelberg, New York, 2006.
[15] J. Szejtli, Chem. Rev. 98 (1998) 1743.
[16] S.J. Lee, W. Lin, Acc. Chem. Res. 41 (2008) 521. [17] M.V. Rekharsky, Y. Inoue, Chem. Rev. 98 (1998)
1875.
[18] M.V. Rekharsky, Y. Inoue, J. Am. Chem. Soc. 124 (2002) 813.
[19] T. Irie, K. Uekama, Adv. Drug Delivery Rev. 36
(1999) 101.
[20] S.A. Nepogodiev, J.F. Stoddart, Chem. Rev. 98 (1998) 1959.
[21] G. Wenz, B.H. Han, A. Müller, Chem. Rev. 106 (2006) 782.
[22] Y. Liu, Y.L. Zhao, H.Y. Zhang, H.B. Song, Angew. Chem. Int. Ed. 115 (2003) 3382.
[23] J. Araki, K. Ito, Soft Matter 3 (2007) 1456.
[24] H. Chapman, In “Dictionary of Organic Compounds, Vth Ed, New York, London, Toronto, 1982.
[25] C. Zhang, G. Vasmatzis, J.L. Cornette, C. DeLisi, J. Mol. Biol. 267 (1997) 707.
[26] D. Schneidman-Duhovny, Y. Inbar, R. Nussinov, H.J. Wolfson, Nucl. Acids Res. 33 (2005) 363.
[27] M.L. Connolly, Science 221 (1983) 709.
[28] D.W. Cho, Y.H. Kim, S.G. Koug, M. Yoon, D.J. Kim, J. Chem. Soc. Faraday Trans. 92 (1996) 29.
[29] H.A. Benesi, J.H. Hildebrand, J. Am. Chem. Soc. 71 (1949) 2703.
[30] S. Monti, G. Kohler, G. Grabner, J. Phys. Chem. 97 (1993) 13011.
[31] D. Duhovny, R. Nussinov, H.J. Wolfson, Proceedings
of the Second Workshopon Algorithms in
Bioinformatics (WABI), Lecture Notes in Computer Science Rome, Italy: Springer Verlag 2452 (2002) 185.
![Figure 1 shows the plot of 1/(A) vs. 1/[β-CDx] for neutral](https://thumb-us.123doks.com/thumbv2/123dok_us/8898822.1829636/5.595.78.520.185.519/figure-shows-plot-vs-b-cdx-neutral.webp)