Iranian Chemical Society
Anal. Bioanal. Chem. Res., Vol. 5, No. 1, 67-79, June 2018.
Determination of Acidity Constants of p-Rosolic Acid and Bromoxylenol Blue by
Solution Scanometric Method
Ardeshir Shokrollahi*, Masoud Gohari and Foroogh Ebrahimi
Department of Chemistry, Yasouj University 75918-74831, Yasouj, Iran (Received 11 June 2017, Accepted 24 September 2017)
Recently, solution scanometry, as a new, simple, fast, portable, and economic method has been introduced for determination of acidity
constants of indicators and dyes. In this study, a method was applied for the determination of the acidity constant of p-Rosolic acid (RA) and Bromoxylenol blue (BXB) indicators. The method is based on scanning of Plexiglas® sheet containing colored solutions with a flatbed scanner. The obtained images were analyzed to red, green, and blue (RGB) values using software written in visual basic 6. For comparison,
the acidity constants of the indicators were determined by spectrophotometric method using the Hypspec program. The corresponding distribution diagrams were also drawn through the Hyss2009 program. The comparison between the presented and traditional UV-Vis
spectrophotometric method was performed, and similar trends were observed in the results of both methods. The obtained values of pKa by solution scanometric and spectrophotometric methods showed a good agreement with the corresponding values reported in the literature.
Keywords: p-Rosolic acid (RA), Bromoxylenol blue, Acidity constant, Plexiglas® cell, RGB parameters
INTRODUCTION
Knowledge of the accurate value of acidity constant is often required in various chemical and biochemical areas
involving acid-base equilibrium in solution. In
biochemistry; for example, the pKa values of proteins and amino acid side chains are important for the activity of enzymes and the stability of proteins [1]. Buffer solutions are used extensively to provide solutions at or near the physiological pH for the study of biochemical reactions [2]; the design of these solutions depends on knowledge of the pKa values of their components.
In pharmacology, ionization of a compound alters its behavior and macro properties such as solubility and lipophilicity. For example, ionization of any compound will increase the solubility in water, but decrease the lipophilicity. This is exploited in drug development to increase the concentration of a compound in the blood by
*Corresponding author. E-mail: [email protected]
adjusting the pKa of an ionizable group [3]. In analytical chemistry, the acidity constants of organic reagents play a key role in many analytical techniques such as acid-base titration [4], solvent extraction [5], ion transport [6], and complex formation [7]. Although considerable advances have been made in the calculation techniques for the estimation of acidity constants in aqueous solution [8-11], there are also major developments in the experimental methods based on spectrophotometric determination [12], potentiometric titration [13], calorimetric methods [14], proton magnetic resonance spectroscopy (1H NMR) [15], 13C NMR [16], Fourier transform-infrared spectrometry
(FT-IR) [17], fluorescence spectrophotometry [18],
conductometry [19], capillary electrophoresis [20], and chromatography [21] as well as combination methods [22].
ligands [23] and stability constants of complexes in aqueous and nonaqueous solutions, using spectrophotometric data [24].
The solution scanometric technique was introduced by Abbaspour et al. in 2009 [25]. The method is based on scanning of Plexiglas® cells containing colored solutions with a flatbed scanner. The Plexiglas® cells were scanned and finally the red, green, and blue (RGB) color model was used in color monitoring [26]. This method was developed
by Shokrollahi et al. to CPE-Scanometry [27]. The
advantages of solution scanometry include simplicity, using commonplace and portable equipments namely handheld scanner and PC, high scanning speed, low cost, no need for finding the λmax, existence archive of experiments, short response time, limited interference, and capability of performing various simultaneous determination. However, there are some disadvantages such as lack of uniformity of cell images and existence of shades on the edge of images which have serious effects on the relative standard deviation and precision of analysis. However, it can be nearly resolved by selecting the same or shade-free areas for the corresponding cell images.
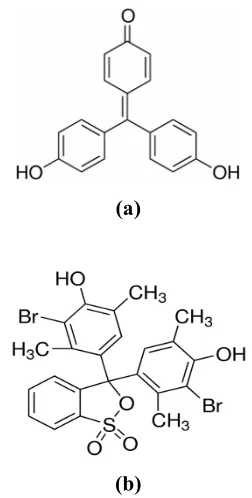
Para-rosolic acid or aurin (Fig. 1a) is an acid-base indicator from triphenylmethane group which its transition range is around pH 6.6-8.0. Below this pH, it is yellow and above it is red. It has various chemical, industrial, and medical uses [28].
Bromoxylenol blue or 3',3''-dibromo-p-xylenol
sulfonphthalein (Fig. 1b) is a pH indicator for pH ranges 6.0-7.6. Bromoxylenol blue shows one color transition in aqueous solutions, from yellow to blue, corresponding to deprotonation of the phenolic hydroxyl. It is in the form of light pink powder and sparingly soluble in water, but soluble in ethyl acetate, acetone, and in aqueous solutions of alkalis. BXB, as an indicator of sulfonphthalein family, is commonly used as an indicator in acid-base titrations. Recently, these compounds have been used for building pH sensors, synthesizing antifungal activity compounds, determination of drugs, developing optical sensors for high-acidity measurements, and fiber-optic biosensors for the detection and determination of pesticides [29-31]. It has also been used for the photometric determination of carboxylic acid impurities in polymers and organic liquids [32].
(a)
(b)
Fig. 1. (a) Structure of p-Rosolic acid, (b) Structure of Bromoxylenol blue.
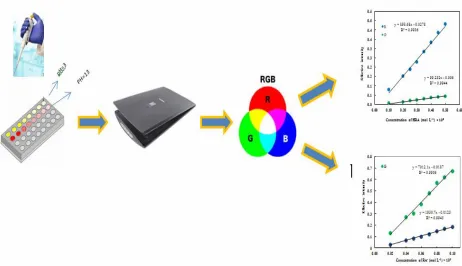
In last attempt of our research team, the solution scanometric technique was introduce for determination of acidity constant of three azo indicators including methyl orange, methyl yellow, and methyl red [33]. Afterwards this method was applied for calculation of pKa of other indicators [34,35]. In this work, the solution scanometric method (Fig. 2) was applied for the calculation of pKa of p-Rosolic acid and Bromoxylenol blue indicators.
EXPERIMENTAL
Apparatus
Biochrom (Cambridge, UK.) UV-Vis spectrophotometer was equipped with 1 cm quartz cells.
Softwares
The RGB software written in Visual Basic 6 based [36] was used to convert the recorded images of cells to RGB values. HypSpec and Hyss 2009 were used to acquire and analyse the spectrophotometric data.
Materials
All chemicals used in this work were of analytical grade. Double distilled water was used throughout. Analytical-grade hydrochloric acid, sodium hydroxide, and potassium chloride used in this study were purchase from Merck (Darmstadt, Germany). Laboratory stock solutions of p-Rosolic acid 5.0 10-3 M and Bromoxylenol blue 5.0
10-4 were prepared by dissolving 0.0145 and 0.0284 g of p-Rosolic acid (Merck) and Bromoxylenol blue (Merck) in the least volume of NaOH 1 M and diluted to 100 ml with double distilled water, respectively. 1.0 M of KCl solution was prepared by dissolving 74.5513 g KCl (Merck)
in an appropriate amount of double distilled water, transferring to the 1000 ml volumetric flask and diluting to the mark with double distilled water.
Procedure
In this section two procedures including solution
scanometric and spectrophotometric methods were
employed to obtain acidity constants of p-Rosolic acid (RA) and Bromoxylenol blue (BXB) in aqueous media. Each procedure was the same for both indicators except concentration and pH. The solutions and conditions for the two cited indicators are shown in Table 1.
Solution Scanometric Method
were prepared from the solution (A). For the basic form, (RA-), several dilute solutions in the concentration range of 2 10-5-1 10-4 M in the presence of 0.1 MKCl were prepared from the solution (B). These dilute solutions are applied for drawing calibration curve for acidic and basic forms of RA using solution scanometry. Finally, for determination of ratio of acidic RA to basic one, a series of indicator solutions of 5 10-4 Msupported with 0.1 MKCl
having pHs around 7.0 was prepared by adding various amounts of dilute HCl and NaOH. 500 µl of these solutions was transferred into each cell of Plexiglas® for solution scanometry.
For another indicator, BXB, solution (A) was prepared by diluting a mixture of 5 mL of the standard BXB solution,
5.0 10-4 M and 0.1 MHCl to 25 ml. The solution (B) was prepared by diluting a mixture of 5 ml of the standard BXB solution and 0.1 MNaOH to 25 ml. In the following, several dilute solutions with concentration between 1.0 10-5 and 8.0 10-5 M in the presence of 0.1 MKCl were prepared from the solution (A) and solution (B), separately. Finally, a series of indicator solutions of 1.3 10-4 M supported with
0.1 M KCl having pHs around 6.8 were prepared by adding variable amounts of HCl and NaOH.
In the solution scanometry, the color of each cell is analyzed based on the RGB system into R, G and B values. It should be noted that in the color analysis programs, a specific area of the obtained image was selected for color analyzing and the number of pixels that could be indicated by this area was about 10,000-300,000. This program can average these pixels. Therefore, the noise can be
dramatically decreased. The effective intensity for any color value was calculated as following:
b s r R R A log b s g G G A log b s b B B A log
where, Ar, Ag, and Ab are the effective intensity for red, green, and blue respectively. Rs, Gs, Bs and Rb, Gb, and Bb are the red, green, and blue color values of a sample and a blank, respectively.
Spectrophotometric Method
The acidity constant of RA was easily obtained using 1.8 10-5 M solutions of it in the pH range of 1.0-13.0 at 25 ºC. After each pH adjustment by dilute hydrochloric acid and sodium hydroxide, an appropriate amount of solution was transferred into a quartz cell and the absorption spectra were recorded. In all experiments, the ionic strength of the solutions was kept constant at 0.1 M using KCl as the supporting electrolyte. The obtained absorbance vs. pH data was used for calculation of the protonation constant using the HypSpec program.
The experiment was also done for BXB in a similar way using 4.0 10-5 M solution of BXB in in the pH range of 1.0-13.0 at 25 ºC.
Table 1. Condition of Solution Scanometric Method
Indicator
Stock solution
concentration
(M)
Dilute solutions range
concentration
(M)
Ionic strength
(M) KCl
pH of solutions containing
of two form
of indicator
p-Rosolic acid 5.0 10-3 2 10-5-5 10-4 0.1 6.5, 6.7, 7.0, 7.2
RESULTS AND DISCUSSION
Determination
of
the
Acidity Constant
of
Indicators by Solution Scanometry
Acid-base indicators are usually weak acids or bases. When they are dissolved in water, they dissociate slightly and form ions. Consider an indicator which is a weak acid, with the formula HIn. At equilibrium, the following equilibrium equation is established with its conjugate base:
H O H O In
HIn 2 3 (1)
Here, HIn stands for the acidic form and In- for the conjugate base of the indicator. The acid dissociation constant, Ka, is defined as:
] [ ] [ ] [ 3 HIn In O H Ka
(2)
Converting Eq. (4) into the form of the Henderson-Hasselbalch equation: HIn In pH
pKa log
(3)
The acid dissociation constant may be calculated from measurements of the ratio [In-/HIn] at known pH values. The new pKa determination method described here is simple, fast and inexpensive. The ratio [In-/HIn] is calculated from the following equations: when pH is less than pKa, the indicator is mainly in the acidic form, and the species HIn is responsible for the effective intensity, AHIn. When pH is greater than pKa, the indicator is mainly in the basic form, and the species In- is responsible for the effective intensity, AIn-. Suppose G and B colors are active in the solution scanometry of HIn and In- species.
g In g HIn g A A
A (4)
b In b HIn b A A
A (5)
Where Ab and Ag are the effective intensity of B and G colors, respectively.
( )( In)
g In HIn g HIn g C S C S
A (6)
( )( In)
b In HIn b HIn b C S C S
A (7)
Sb and Sg are the slopes of calibration graphs blue and green color values and CHIn and CIn- are the concentrations of the acidic (HIn) and basic (In-) forms of the indicator, respectively. By solving both Eqs. (6) and (7) simultaneously, one can obtain the concentrations of HIn and In-.
) ( ) ( ) ( ) ( b HIn g In b In g HIn b g In g b In HIn S S S S A S A S C
(8)
) ( ) ( ) ( ) ( b HIn g In b In g HIn g b HIn b g HIn In S S S S A S A S C
(9)
Having the amounts of HIn and In- present as a function of pH, the pKa value of indicators can be calculated using Eq. (3).
Determination of Acidity Constants of RA and
BXB Indicators by the Solution Scanometry
The objective of this study is to determine the acid dissociation constant of RA and BXB indicator, using the solution scanometric method and the comparison of results with those of the spectrophotometric method. Acidic constant determination of RA and BXB was carried out in the same way, therefore acidic constant determination for RA is described herein in more details.
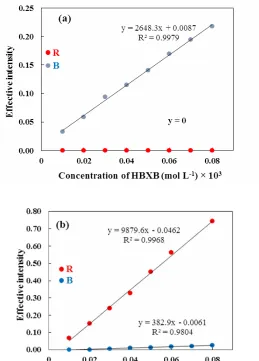
Fig. 3. Calibration graphs of RA (a) acidic form , (b) basic form.
Table 2. The Calibration Equations for RA and BXB Indicators Obtained by the Solution Scanometric Method
Acid form Basic form
Indicator G/R parameter B parameter G/R parameter B parameter
p-Rosolic acid (G) Y = 99.232C - 0.006 Y = 898.67C - 0.0278 Y = 7012.1C + 0.0046 Y = 1950.7C + 0.0123
Table 3. Acidity Constant Values of RA Calculated by the Solution Scanometric and Spectrophotometric Methods
Method Calculation pH (s) pKa Ref.
6.50 6.97 ± 0.03
6.70 7.05 ± 0.05
7.00 7.14 ± 0.04
One point
7.20 6.98 ± 0.04
Solution scanometry
Intercept of
the graph 6.50-7.20 7.03
This work
Spectrophotometry 1.00-13.00 pKa1 = 7.36 ± 0.01
pKa2 = 9.62 ± 0.02
This work
Spectrophotometry - 6.98 [28]
Table 4. Acidity Constant Value of BXB Calculated by Solution Scanometric and Spectrophotometric Methods
Method Calculation pH (s) pKa Ref.
One point
6.50 6.75 6.97 7.17
6.78 ± 0.03 6.84 ± 0.01 6.74 ± 0.04 6.86 ± 0.02 Solution
scanometry
Intercept of the graph
6.50-7.17 6.81
This work
Spectrophotometry 1.00-13.00 6.47 ± 0.02 This work
RA stock solution. The pH of this solution was nearly 13.0, so the RA is present entirely in the form of RA-. The second step involves verifying the linear relationship between the effective intensity of two active colors (G and B color values which change more than R color value) and concentration of HRA and RA- for determining the slopes of calibration curve for each species separately. In order to obtain the linear range for the acidic form (HRA), several dilute solutions in the concentration range of 1 10-4-5
10-4 M in the presence of 0.1 M KCl as the supporting electrolyte were prepared from the (A) solution. For the basic form (RA-), several dilute solutions in the
concentration range of 2 10-5-1 10-4 M in the presence of 0.1 M KCl were prepared from the (B) solution. The calibration curves and corresponding equations are shown in Fig. 3 and Table 2.
As shown in Table 2, the equations of the regression lines for acidic and basic forms for the G parameter were Ag = 99.2CHRA - 0.006 and Ag = 7012CRA- + 0.0046 and for the B parameter were Ab = 898.7CHRA - 0.0278 and Ab =
1950.7CRA- + 0.0123, respectively. According to
aforementioned:
Ab = 898.7CHRA + 1950.7 CRA- (11)
The third step of the experiment is to determine the concentration of HRA and RA- specious present in the solution as a function of pH. A series of indicator solutions with pHs 6.50, 6.70, 7.00 and 7.20 were prepared by adding various amounts of dilute HCl and NaOH. 500 µl of these solutions was transferred into each cell of Plexiglas® for scanning. From effective intensities of G and B at each pH in Table 2, Eqs. (10) and (11), the concentration ratio of HRA/RA- in solution can be calculated. The value of pKa for RA was evaluated from the concentration ratio of
HRA/RA- as a function of pH, using Eq. (3). The results are shown in Table 3.
Another indicator, BXB shows a color transition in aqueous solutions. In acidic solution, it has a yellow color (HBXB form) which changes to blue in its basic form
(BXB-). The similar experiments were done for
determination of pKa of BXB which corresponding curves, features and results are presented in Fig. 4, Tables 2 and 4.
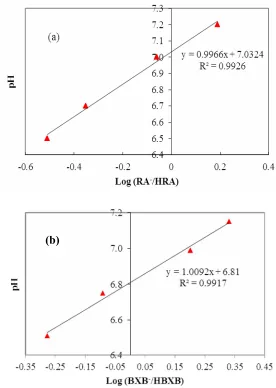
It must be noted that pKa value can be calculated by plotting pH vs. log(In-/HIn). In this regard, intercept of the line is equal to pKa. As shown in Fig. 5, Tables 3 and 4, the pKa values using this method were 7.03 and 6.81 Fig. 5. Graphs of pH vs. logIn-/HIn for determination of pKa values of (a) RA and (b) BXB.
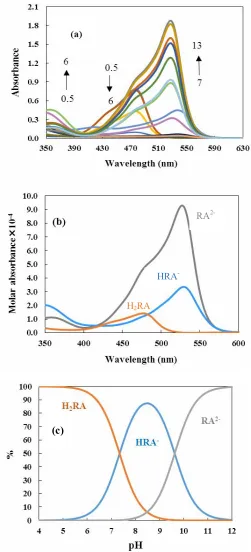
Fig. 6. (a) Absorption spectra, (b) Molar absorbance spectra and (c) distribution diagrams of p-Rosolic acid indicator at different pH values.
RA2-
HRA
-H2RA
Fig. 7. (a)Absorption spectra, (b) Molar absorbance spectra, and (c) distribution diagrams of bromoxylenol blue indicator at different pH values.
for RA and BXB, respectively.
Determination of Acidity Constants of the
Indicators by the Spectrophotometric Method
In general, spectrophotometric methods are precise, highly sensitive and suitable for studying chemical equilibrium solution. These methods are attractive for pKa determination in very dilute aqueous solutions. Thus, spectrophotometry is a reliable method for confirming the results obtained from the new methods. Therefore, the new results from the solution scanometric method were compared with the spectrophotometric results.
Subsequently, UV-Vis spectrophotometry was used to obtain spectral data. Then, commercially available HypSpec software was used which allowed us to perform spectral subtraction followed by spectral analysis to determine the acidity constants. Acidity constants and molar absorbance spectra of RA and BXB were evaluated by the HypSpec program using absorbance-pH data.
Absorbance spectra of these indicators were recorded at various pHs. The positions of these bands were strongly influenced by pH. As observed in Fig. 6a, in acid medium, there is one peak for p-Rosolic acid at 475 nm which corresponds to H2RA. With increasing the pH toward 6.0, this peak diminished and at pH 6.0-7.5, H2RA was converted to HRA-. At higher pH (pH > 7.5), the indicator was fully ionized to RA2- giving a strong absorbance at 530 nm. At pH > 11.0, absorbance diminished due to instability of indicator in very alkaline solution. Although two transitions corresponding to two pKa values were observed in Fig. 6a, only the first one, conversion of H2RA to HRA-, was feasible to follow in solution scanometry and there was no obvious change in color for the second transition (HRA -to RA2-). However, two pKa values were determined by spectrophotometric method in multi-wavelength using Hypspec program that are shown in Table 3.
For Bromoxylenol blue, in accordance to Fig. 7a, in acidic solution, the indicator is entirely nonionized HBXB (acidic form) and the solution is yellow, thus, where the peak centered around 438 nm. As the pH changes from acidic to basic, HBXB is converted to BXB- (basic form), so that, at high pH the solution is blue, resulting in a high absorbance at 618 nm. An isobestic point at 500 nm is observable which corresponds to equality of absorbance
value of HBXB/BXB-. Also the corresponding distribution diagrams were depicted by Hyss2009 (Figs. 6 and 7). The results are shown in Tables 3 and 4. According to these tables, the test ascertained that there was no significant difference among these methods, and the results obtained from the solution scanometric method show good agreement with the spectrophotometric results and the results reported in the literature [28,37].
CONCLUSIONS
The solution scanometric method as a simple, safe, rapid, portable, and inexpensive method was introduced for determination of acidity constant, pKa, of RA and BXB indicators. The acidity constants of two indicators were successfully determined by the proposed method. The
acidity constants were also determined by
spectrophotometry. The results were satisfactory in comparison with spectrophotometric results as well as values given in the previous scientific reports. The presented method can be applied for determination of acidity constant of indicators as an alternative to visible spectrophotometry.
ACKNOWLEDGEMENTS
We gratefully appreciate all precious and kind supports of Yasouj University.
REFERENCES
[1] A. Onufriev, D.A Case, G.M. Ullmann, Biochemistry 40 (2001) 3413.
[2] N.E. Good, G.D. Winget, W. Winter, T.N. Connolly, S. Izawa, R.M.M. Singh, Biochemistry 5 (1966) 467.
[3] A. Avdeef, Absorption and Drug Development:
Solubility, Permeability, and Charge State. Wiley, New York, 2003.
[4] J.P. Morel, N. Marmier, C. Hurel, N.
Morel-Desrosiers, J. Colloid Interf. Sci. 338 (2009) 10.
[5] A.M. Eyal, A Series of Adv. 13 (1997) 31.
[6] D.P. Nikoleis, J.D. Brennan, R.S. Brown, U.J. Krull, Anal. Chim. Acta 257 (1992) 49.
Complex Equilibria, Horwood. 1990.
[8] J. Jover, R. Bosque, J. Sales, QSAR Comb. Sci. 27 (2008) 1179.
[9] G. Cruciani, F. Milletti, L. Storchi, G. Sforna, L. Goracci, Chem. Biodivers. 6 (2009).
[10] F. Milletti, L. Storchi, G. Sforna, G. Cruciani, J. Chem. Inf. Model. 47 (2007) 2172.
[11] P.H. Lee, S.N. Ayyampalayam, L.A. Carreira, M. Shalaeva, S. Bhattachar, R. Coselmon, S. Poole, E. Gifford, F. Lombardo, Mol. Pharmaceutics 4 (2007) 498.
[12] D. Pissinis, L.E. Sereno, J.M. Marioli, J. Braz. Chem. Soc. 16 (2005) 1054.
[13] B. Chahkandi, M. Mirzaei, M. Chahkandi, A.
Shokrollahi, F. Zarghampour, M. Shamsipur, J. Iran. Chem. Soc. 11 (2014) 187.
[14] A. Gervasini and A. Auroux, Thermochim. Acta 567 (2013) 8.
[15] J. Bezençon, B. M. Wittwer, B. Cutting, M. Smieˇsko, B. Wagner, M. Kansy, B. Ernst, J. Pharm. Biomed. Anal. 93 (2014) 147.
[16] I. André, S. Linse, F.A.A. Mulder, J. Am. Chem. Soc. 129 (2007) 15805.
[17] A. Lachenwitzer, N. Li, J. Lipkowski, J. Electroanal. Chem. 532 (2002) 85.
[18] F. Sardi, B. Manta, S. Portillo-Ledesma, B. Knoops, A.M. Comini, G. Ferrer-Sueta, Anal. Biochem. 435 (2013), 74.
[19] G. Bombara, M. Troyli, J. Electroanal. Chem. 5 (1963) 379.
[20] J.M. Cabot, E. Fuguet, C. Rafols, M. Roses, J. Chromatogr. A 1217 (2010) 8340.
[21] T. Angelov, A. Vlasenko, W. Tashkov, J. Liq.
Chromatogr. Related Technol. 31 (2008) 188.
[22] K.J. Box, R.E. Donkor, P.A. Jupp, I.P. Leader, D.F. Trew, C.H. Turner, J. Pharm. Biomed. Anal. 47 (2008) 303.
[23] A.S. Pithadia, A. Kochi, M.T. Soper, M.W. Beck, Y. Liu, S. Lee, A.S. DeToma, B.T. Ruotolo, M.H. Lim, Inorg. Chem. 51 (2012) 12959.
[24] A. Shokrollahi, M. Montazerozohori, T. Mehrpour, H. Tavallali, B. Zare Khafri, Z. Montaseri, Quim. Nova 36 (2013) 1354.
[25] A. Abbaspour, A. Khajehzadeh, A. Ghaffarinejad, Analyst 134 (2009) 1692.
[26] A. Shokrollahi, N. Shokrollahi, Quim. Nova 37 (2014) 1589.
[27] A. Shokrollahi, T. Roozestan, Anal. Methods 5 (2013) 4824.
[28] R.W. Sabnis, Handbook of Acid-Base Indicators, CRC
Press, London, New York, 2008.
[29] G. Pandey, K.K. Narang, J. Coord. Chem. 59 (2006) 1495.
[30] L.R. Allain, K. Sorasaenee, Z. Xue, Anal. Chem. 69 (1997) 3076.
[31] V.G. Andreou, Y.D. Clonis, Biosens. Bioelectron. 17 (2002) 61.
[32] E.M. Rakhmanko, V.V. Zhilko, V.V. Egorov, J. Anal.
Chem. 60 (2005) 16.
[33] A. Shokrollahi, F. Zarghampour, S. Akbari, A. Salehi, Anal. Methods 7 (2015) 3551.
[34] A. Shokrollahi, E. Zare, J. Mol. Liq. 219 (2016) 1165. [35] A. Shokrollahi, F. Firoozbakht, Beni-Seuf Univ. J.
Appl. Sci. 5 (2016) 13.
[36] A. Abbaspour, M.A. Mehrgardi, A. Noori, M.A.
Kamyabi, A. Khalafi-Nezhad, M.N. Soltani Rad, Sens. Actuators, B 113 (2006) 857.