Towards Interactive Evolution: A Distributed
Optimiser for Multi
-objective Water Distribution
Network Design
David J. Walker
1, Matthew Johns
1, Ed Keedwell
1and Dragan Savi
ć
11 Centre for Water Systems, University of Exeter, Exeter, UK. EX4 4QF.
{D.J.Walker, M.B.Johns, E.C.Keedwell, D.Savic}@exeter.ac.uk
Abstract
It is well known that water distribution networks can be optimised by evolutionary algorithms. However, while such optimisation can result in mathematically optimal solutions, the ability of the algorithm to generate novelty can often lead to solutions that are not practical for implementation. This work describes a distributed optimisation platform that will enable the inclusion of a human decision maker in the optimisation process. The architecture of the platform is described, and examples of its execution on benchmark problems is described, using an automated client that interacts with the platform in lieu of a human decision maker.
1
Introduction
The use of evolutionary algorithms (EAs) to optimise water distribution network (WDN) designs is well known (Wang et al., 2014; Farmani et al., 2005). Variants of EAs, such as genetic algorithms, have been shown to offer solutions that are optimal against a mathematically defined objective function, or set of functions. Such solutions, though optimising the problem as defined by the functions, can be unsuitable for implementation in the real world; problem objectives might be ill-defined, incomplete, or change over time, and a problem might have constraints that have been ignored in its definition. An automatic optimisation problem will struggle to cope with scenarios such as this, whereas an engineer will be able to leverage their experience and be more able to adapt and take these considerations into account. To this end, this work explores an interactive optimisation approach combining an engineer and automated optimisation.
Interactive EAs (IEAs) (Takagi, 2001; Luque et al., 2011) include an expert – in this case, an engineer – to use their judgement or experience to guide the execution of an algorithm. Two common components of an automatic EA are the selection operator and the perturbation operator. An EA is an iterative process, running over a number of generations, and the selection operator is responsible for identifying which of a pool of candidate solutions should be used as the basis for new solutions in the
Engineering
Volume 3, 2018, Pages 2259–2267
next generation. The process is driven by the quantified objective values, such that those with better objective values are (or are more likely to be) retained in favour of those with poorer values. In IEAs an engineer is substituted for a selection operator by showing them various solutions and asking them to identify those that they prefer. Perturbation is the process by which changes are introduced into an existing solution – common perturbation operators are crossover and mutation. These can be replaced in IEAs with mechanisms that allow experts to change the solution themselves. In the case of WDN design, an interactive perturbation operator might allow the expert to select a new pipe diameter.
The HOWS (Human-Computer Optimisation for Water Systems Planning and Management)*
project seeks to explore the inclusion of a human decision maker in WDN design. One of the keys to interactive evolution is to make best use of the human element of the system, to reduce the possibility of user fatigue. This can be accomplished by providing tools to visualise solutions as intuitively as possible and allowing experts to consider solution quality in their own time on their own machine. These considerations therefore require a remote, distributed solution to the problem of water distribution network optimisation. Central to this is a server application that receives optimisation requests, generates and evaluates candidate solutions to the WDN design problem at hand, and returns them to the server. This paper describes the HOWS optimisation server achieves this, and demonstrates its use on with an automated client used to optimise two benchmark WDN networks – the New York Tunnels and Hanoi networks.
2
Background
The optimisation of WDNs using EAs is well understood, however the use of interaction has seen much less attention within hydroinformatics. The underlying idea behind interactive EAs (IEAs) is that by including an expert in the optimisation process, instead of using them to set up (a priori) an automatic optimisation procedure or select a final solution (a posteriori) from one, better solutions can be generated (Takagi, 2001; Luque et al., 2011; Tokui and Iba, 2000).
One approach to interactive evolution is to allow the decision maker to manipulate the solutions directly, giving them the ability to introduce changes and generate new offspring solutions (replacing crossover and mutation operators) themselves. A second approach is to require them to identify the best solution, or to rank a set of presented solutions (replacing the selection operator). A third approach is to combine elements of both to allow the user to modify and rank evolved solutions, although measures must also be taken to manage user fatigue in such situations (Takagi, 2001). To the authors’ knowledge, all of these approaches represent significant novelty in the design of WDNs. In this work, interactive solution generation is considered.
3
System Architecture
The HOWS framework is designed to allow expert users to interact remotely with partially optimised water distribution network models, and follows a client-server architecture. This paper is concerned with the server-side aspects of the framework, outlining the basic optimisation algorithm that has been implemented. The paper also describes the message passing procedures used to present results to the client side for visualisation and interaction.
* The HOWS project (“Human-Computer Optimisation for Water Systems Planning and Management”) is a
Figure 1:The HOWS framework. The server-side optimiser described herein is shown in red and green, with interaction provided by the HOWS visualisation engine (shown in yellow and blue).
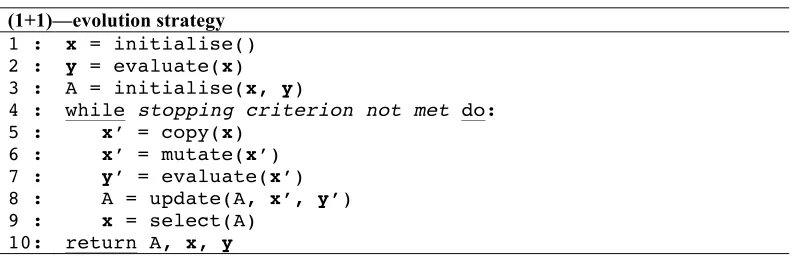
(1+1)—evolution strategy
1 : 2 : 3 : 4 : 5 : 6 : 7 : 8 : 9 : 10:
x = initialise()
y = evaluate(x) A = initialise(x, y)
while stopping criterion not met do: x’ = copy(x)
x’ = mutate(x’) y’ = evaluate(x’) A = update(A, x’, y’) x = select(A)
return A, x, y
Figure 2: Pseudocode describing the (1+1)—evolution strategy driving the optimisation process.
The server uses a multi-objective (1+1)—evolution strategy (Schwefel, 1965), described in Figure 2, to generate solutions to the problem at hand (currently a WDN design problem, however the system has been designed with flexibility to easily accommodate further algorithms and problems through a modular software development approach). The execution of the algorithm begins by generating an initial random solution to the problem, evaluating it under the problem objective functions, and using the resulting objective values to initialise an archive of solutions that will represent the algorithm’s current approximation to the true Pareto front.
At each generation, the current working (parent) solution is used to generate a single child solution. This is done by making a copy of the parent solution that can be mutated. Mutation is done using the so-called “creep mutation”, whereby the diameter of a randomly chosen pipe is increased or decreased to the next available diameter. This has been shown to produce competitive results when compared to other heuristics (Walker, et al., 2016), but, again, can easily be substituted within the framework for another heuristic (or sequence of heuristics). The objective functions of the new child are evaluated, and the archive is updated; any solutions dominated by the new child are removed from the archive, and if the solution is not dominated by any members of the archive then it is itself archived. At the end of the generation, the parent solution for the next generation is selected by choosing a member of the archive at random. The algorithm runs for a fixed budget of function evaluations. In this work, a budget of 50,000 function evaluations was used.
exchanging data online) (JSON Advocate Group, 2006) and transmitted across the Internet to the client, which can then present the information to the user. User interactions are then returned to the server, again using a JSON message, and a record of them is kept in a database.
The client communicates with the server using HTTP messages; four kinds of message can be processed by the server currently:
• A request for network information. The client sends a unique identifier for a WDN, which the server uses to retrieve the EPANET file describing the network before converting it into a JSON object and returning it to the client.
• A request for problem-specific information. The server uses the WDN identifier to return information relating to the optimisation problem (e.g., a list of legal pipe diameters).
• A request to start an optimisation session. An optimisation “session” (where a session is defined as beginning with a randomly initialised solution and ending with an optimised one) is assigned a unique key, so that information pertaining to the optimisation (e.g., which pipes have been mutated) process can be stored in a database and retrieved. The key is generated by requesting one (generated at random) from the server.
• A request to initiate a period of automated optimisation. The client encodes the current working solution (incorporating any modifications they have made to it) and the number of generations to optimise for. The server then optimises for that number of generations, before the JSON representation of the evolved network, its corresponding objective values, and the current archive are returned to the client. An example of the message sent from the client to the server is shown in Figure 3.
• The client can use a local search operator to exhaustively search the possibilities for a given pipe. A pipe ID is sent to the server, which considers all possible pipe diameters for that pipe. A JSON message is returned to the client containing all of the solutions, and their corresponding objective functions.
{"diameters": [{"id": "1", "diameter": 144.0}, {"id": "2", "diameter": 156.0}, {"id": "3", "diameter": 156.0}, {"id": "4", "diameter": 108.0}, {"id": "5", "diameter": 132.0}, {"id": "6", "diameter": 48.0}, {"id": "7", "diameter": 84.0}, {"id": "8", "diameter": 156.0}, {"id": "9", "diameter": 168.0}, {"id": "10", "diameter": 96.0}, {"id": "11", "diameter": 144.0}, {"id": "12", "diameter": 144.0}, {"id": "13", "diameter": 72.0}, {"id": "14", "diameter": 108.0}, {"id": "15", "diameter": 72.0}, {"id": "16", "diameter": 144.0}, {"id": "17", "diameter": 108.0}, {"id": "18", "diameter": 180.0}, {"id": "19", "diameter": 180.0}, {"id": "20", "diameter": 48.0}, {"id": "21", "diameter": 144.0}], "sessionId": "DBBT0R2JUV", "ngens": 50, "problemStr": "nyt"}
Figure 3: An example of the JSON message passed from the client to the server to initiate an optimisation of the New York Tunnels problem. The optimisation will run for 50 generations.
4
Experiments
New York Tunnels Hanoi
f
1=
(
1.1
d
k1.24×
l
k)
k=1∑
f
2=
(
(
h
ˆ
n−
h
n)
>
0
)
n=1∑
f
1=
(
1.1d
k1.5×
l
k)
k=1
∑
f
2=
(
(
h
ˆ
n−
h
n)
>
0
)
n=1
∑
Notation:
dk: diameter of the k-th pipe in the network.
lk: length of the k-th pipe.
ˆ
h
n: the target head deficit at the n-th node in the network.hn: the actual head deficit at the n-th node.
Table 1: Optimisation problem formulation for New York Tunnels and Hanoi.
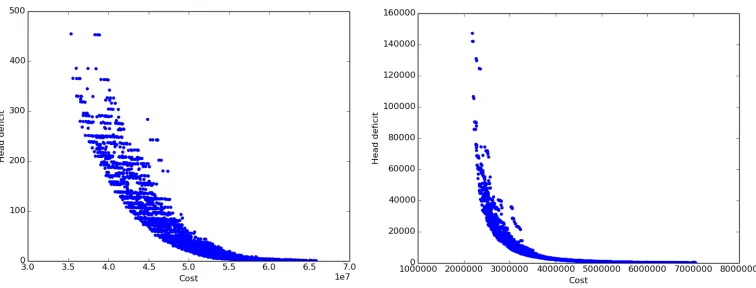
The objective functions are computed using EPANET (Rossman, 2000) to simulate the networks. The results of optimising the New York tunnels problem (Schaake and Lai, 1969) is shown in Figure 4, which illustrates the estimated Pareto front identified by the algorithm for that problem. Similar results were produced for the Hanoi problem, and are shown in Figure 5. As can be seen, the algorithm has generated a range of solutions across the front. Information about each of these networks was encoded by the server as a JSON object and transmitted to the client for visualisation; this contains structural information, including the topology of the network, as well as hydraulic information (such as the head deficit and water quality). The use of this information by the client is beyond the scope of this paper and is not discussed further.
Figure 4: A Pareto front generated by optimising the New York Tunnels (left) and Hanoi (right) problems with the server-side optimiser.
(identified by the client sending the session key) the archive can be easily retrieved. This means that optimisation could be restarted after any period, assuming that the key is retained.
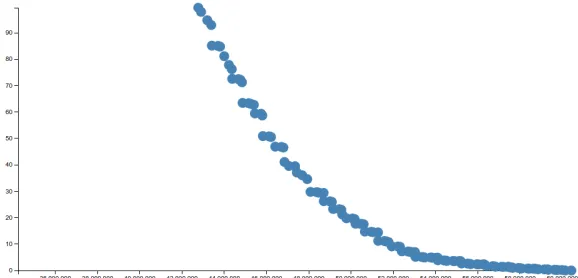
To demonstrate the flexibility of the server, an additional run was completed for the New York Tunnels problem using a different client. This client is JavaScript-based, and displays results in a web browser (Google Chrome was used herein, however the same approach would work in any modern web browser). Other client applications are currently under development, including one to provide a browser-based 3-dimensional view and one exploiting virtual reality technology. These are beyond the purview of this work and are not discussed herein.
Figure 5: Another estimated Pareto front for New York Tunnels; this was generated using the server, which was this time invoked from a client application running in a web browser and rendered using D3 (a JavaScript
visualisation framework).
5
Interaction
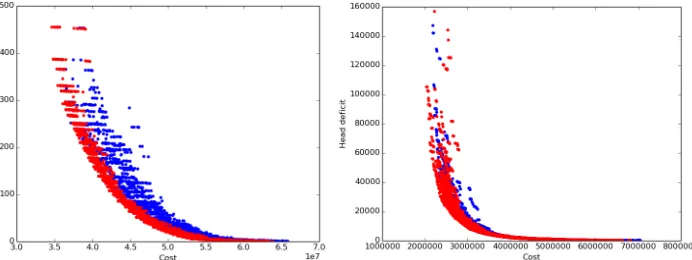
Figure 6: Pareto fronts for the New York Tunnels (left) and Hanoi (right) problems. The same fronts shown in Figure 4 are shown in blue, while the red points were generated by the “interactive” version. Neither “interactive” version is any worse than the fully automatic version, and incorporating the look-ahead technique
has improved the Pareto front distribution in both cases.
Figure 6 shows the result of using the look-ahead heuristic in addition to the fully automatic optimiser. For reference, the results from Figure 4 are repeated. In both cases, the inclusion of the additional heuristic has not had a detrimental effect on the results; the extent of the Pareto front in that the original results are not superior to those using the heuristic. In fact, the distribution of results for the New York Tunnel optimisation shows that solutions are more tightly grouped along the leading edge of the Pareto front, indicating that the additional local search has induced greater selection pressure into the optimisation process. In the case of Hanoi, the Pareto front has advanced beyond that of the fully automated version. This has resulted in the generation of solutions with a lower cost compared to the same head deficit score in the automated version.
The current version of the software developed under the HOWS project has included exposing the look-ahead operator through the user interface so that a human user can use it interactively. A known issue within the field of IEAs is that of user fatigue (Takagi, 2001). The user is engaged in a repetitive task, which they must work at for an extended period of time (recall, the MOEA was run for 50,000 function evaluations). While users begin by making informed decisions, over time it is likely (or even certain) that they will lose focus and begin to make decisions more at random. This has been observed in the WDN design task, where users were asked to take part in a “serious game” in which they design a WDN (Morley et al., 2017). An ongoing aspect of this work will seek to address this issue, looking at ways in which the human decision maker can be relieved of their work for a period of time by modelling their interactions with the system and developing a surrogate model to act for them. In the current framework, the surrogate model would take the place of the creep mutation operator, generating new solutions by following the basic “heuristic” approach the user has been following. To this end, all data relating to user interactions is being recorded in a database connected to the server.
6
Conclusion
This paper has presented a distributed optimisation platform for the optimisation of the WDN design problem. The platform comprises a server-based optimisation framework with which a range of client applications can communicate. Though at an early stage of development, the platform has been shown to be capable of optimising benchmark WDNs (New York Tunnels and Hanoi have been demonstrated) and initial investigation shows that interrupting the automatic optimisation process with an additional heuristic-based local search operator offers improved results. Experiments are currently being conducted that are replacing this operator with information provided by a human decision maker through an interactive interface, and is expected to yield fruitful results.
The design of the framework has been undertaken in a modular fashion, to promote the ease of modifying it as the project continues. The optimisation algorithm can be easily replaced; the results generated herein were produced using a (1+1)—ES, which operates without a search population. It is expected that improved mathematically superior (according to the problem objective functions) might be obtained by using a population-based EA, however this would introduce an additional level of complexity for the users of the interactive tool. Ongoing work is examining how this might be done without increasing the complexity of the tool to the point that any benefits to its use are negated by its difficulty. The modularity of the framework also makes it very straightforward to add different optimisation problems, both including more complex WDN design problems and entirely different optimisation problems encountered by the water industry (e.g., operational problems such as pump scheduling).
Ongoing work is extending the range of interactions available to the user to include selecting which of a set of candidate solutions from the archive should be used as the parent in the next generation. This implements a common type of interactive evolution, and allows the expert’s experience to steer the optimisation process.
7
Conclusion
This work was supported by the UK’s Engineering and Physical Sciences Research Council under grant EP/P009441/1.
References
Deb, K. Pratap, A., Agarwal, S. and Meyarivan, T. (2002). A fast and elitist multiobjective genetic algorithm: NSGA-II. IEEE Transactions on Evolutionary Computation 6(2):182-197, 2002.
Farmani, R., D. A. Savic, and G. A. Walters (2005). Evolutionary multi-objective optimization in water distribution network design. Engineering Optimization 37.2:167-183.
JSON Advocate Group. (2006). Introducing JSON: A lightweight data-interchange format. http://www.json.org.
Luque, M., Ruiz, F. and Miettinen, K. (2011) Global formulation for interactive multiobjective optimization. OR Spectrum 33(1):27-48.
Morley, M. S., Khoury, M. and Savić, D. (2017). Serious Game Approach to Water Distribution System Design and Rehabilitation Problems. Procedia Engineering 186:76-83.
Rossman, L. A. (2000). EPANET 2 Users Manual.
Schwefel, H.-P. (1965). Kybernetische Evolution als Strategie der experimentellen Forschung in der Strömungstechnik. Master’s thesis, Technical University of Berlin.
Takagi, H. (2001). Interactive evolutionary computation: Fusion of the capabilities of EC optimization and human evaluation. Proceedings of the IEEE, 89(9), 1275-1296.
Tokui, N., & Iba, H. (2000, December). Music composition with interactive evolutionary computation. In Proceedings of the 3rd international conference on generative art (Vol. 17, No. 2, pp. 215-226).
Walker, D. J., Keedwell, E. and Savić, D. (2016). Multi-objective Optimisation of a Water Distribution Network Using a Sequence-based Selection Hyper-heuristic. Proceedings of Computing and Control in the Water Industry (CCWI 2016), 2016.