IJPAR |Vol.7 | Issue 3 | July - Sep -2018 Journal Home page: www.ijpar.com
Research article Open Access
Development and pharmacokinetic evaluation of nebilolol solid dispersion
using novel polymers
A. Laxmi Raj*
1, Y. Shravan Kumar
21
Research Scholar, Mewar University, Chittorgarh, Rajasthan, India
2
Research Supervisor, Mewar University, Chittorgarh, Rajasthan, India
*Corresponding Author:A. Laxmi RajEmail: [email protected]
ABSTRACT
In the present investigation, fifteen Nebivolol solid dispersion formulations were prepared with 1:1:1, 1:5:2 and 1:3:1.5 ratios of drug: carrier: surfactant by solvent evaporation method. There was significant improvement in the rate of drug release from all 15 solid dispersions and the formulation (SD14) comprising Nebivolol: Kleptose HPB: SLS in 1:5:2 ratio has shown enhanced solubility about 42 folds and significant improvement in the rate of drug release i.e. From powder X-ray diffraction (p-XRD) and by scanning electron microscopy (SEM) studies it was evident that polymorphic form of Nebivolol has been converted into an amorphous form from crystalline within the solid dispersion formulation. From in vivo bioavailability studies, Cmax of the optimized formulation SD14 was 2.44±0.06ng /ml, was significantly higher as compared to pure drug suspension, i.e., 1.58±0.02ng/ml. Tmax of optimized formulation was decreased significantly when compared with pure drug (1.00±0.04hr, 2.00±0.03hr), AUC0-α and AUC0-t for optimized solid dispersion formulation was significantly higher (p<0.05) as compared to pure drug suspension. The present study demonstrated that formulation of Nebivolol solid dispersion by solvent evaporation technique is a highly effective strategy for enhancing the bioavailability of poorly water soluble Nebivolol.
Keywords:
Nebivolol, Solid dispersions, Hypertension, Kleptose HPB, In vivo, Bioavailability studiesINTRODUCTION
A solid dosage form is a comfortable and familiar means of taking medication. Hence, a patient compliance and drug treatment are usually more effective with orally administered medications than other routes of administration [1]. At least 40% of the new chemical molecules tested are drugs having
poor aqueous solubility. Many methods are available to improve dissolution rate, solubility characteristics, including salt formation, micronization, and addition of solvent or surface-active agents. Solid dispersion is one of these methods, which was most widely and successfully applied to improve the solubility,
dissolution rates and consequently the bioavailability of poorly soluble drugs [2].
Solid dispersion technology is one of the most promising and extensively performed approaches to improve the dissolution rate of insoluble compounds. Ease of scalability, its conversion to solid dosage forms such as capsules, tablets, taste masking strips and implants are some of the advantages offered by solid dispersion over other approaches [3].
Nebivolol hydrochloride is chemically known as α, α-[iminobis (methylene)] bis [6-flouro3,4-
dihydro-2H-1-benzopyran-2-methanol]hydrochloride. It is a highly selective β1-blocker with nitric oxide mediated vasodilatory actions and beneficial effects on vascular endothelial function. Nebivolol is used in the management of hypertension. It is given by mouth as the hydrochloride although doses are expressed in terms of base. The usual dose is 10mg and 5 mg daily. An initial dose of 2.5 mg daily is employed in the elderly and in patients with renal impairment [4].
The main objective of this work was to investigate the possibility of improving the solubility and dissolution rate of Nebivolo by preparing solid dispersions with various polymers such as Soluplus, Kolliphor P188, Kolliphor ELP, Labrafac CC and Kleptose HPB. The prepared solid dispersions were evaluated for solubility study, drug content, in-vitro dissolution rate studies.
MATERIALS AND METHODS
Materials
Nebivolol pure drug was generous gift from Aurobindo Pharma Ltd, Hyderabad, India. Kleptose HPB and PEG 6000 were obtained from BASF, Mumbai. Kolliphor P188, Labrafac CC, Kolliphor ELP were obtained from Signet Chemical Corp. Pvt. Ltd, Mumbai.Soluplus were gifted from BASF, Germany. PEG 400, Span 40, Tween 80, and PVP K-25 and were gifted from Dow Chemicals, USA. All other chemicals used were of analytical grade.
Preliminary solubility studies of Nebivolol
Solubility measurements of Nebivolol were performed according to a published method (Higuchi and Connors, 1965). An excess amount of Nebivolol was added to 25ml of aqueous solution of water soluble carriers like PEG 6000, Labrafac CC,
Kolliphor ELP, Soluplus, Kleptose HPB, Kolliphor P188, PEG 400, Span 40, Tween 80 and PVPK-25 in screw capped bottles. Samples were shaken for the 24 hours at room temperature. Subsequently, the suspensions were filtered through a Whatman filter paper no 1. Filtered solution was diluted properly with methanol. The diluted solution analyzed for the Nebivolol in UV 280 nm [5].
Preparation of Nebivolol solid dispersion by the
solvent evaporation method
The calculated amount of Nebivolol and the employed polymers of Soluplus, Kolliphor P188, Kolliphor ELP, Labrafac CC, Kleptose HPS and SLS in different drug, polymer and surfactant ratios of 1:1:1, 1:5:2 and 1:3:1.5) (Shown in Table 1) are weighed and mixed together in a porcelain dish. Fifteen different formulae were prepared by the solvent evaporation method. The mixture was dissolved in the least amount of methanol as a common solvent. Then the solvent was evaporated in oven at temperature 50ºC till complete evaporation. The solid dispersions prepared were pulverized in a mortar and sieved. The fraction of the powder that passed through 45 μm was stored in a desiccator and used for further investigations [6, 7].
Solubility studies of Nebivolol solid dispersion
by solvent evaporation method
Solubility measurements of Nebivolol were performed according to a published method. Samples were shaken for the 48 hours at room temperature. Subsequently, the suspensions were filtered through a Whatman filter paper no 1. Filtered solutions were analyzed for the Nebivolol UV 280 nm.
Evaluation of Nebivolol solid dispersions
Solid dispersions obtained from the above method were tested for their % Practical yield [8], Drug content and in-vitro release studies.
Drug content
Solid dispersions equivalent to 10 mg of Nebivolol was weighed accurately and dissolved in 100 ml of methanol. The solution was filtered, diluted suitable and drug content was analysed at λmax 280 nm against blank by UV spectrometer. The
Actual amount of drug in solid dispersion
% Drug content = --- X 100
Theoretical amount of drug in solid dispersion
In vitro
Dissolution study of solid dispersion
The USP dissolution test type II apparatus was used. Amount of samples equivalent to 10 mg of drug were dispersed into the dissolution vessel containing 900 mL of pH 6.8 PBS at 37°C and stirred at 50 rpm. Samples were withdrawn periodically, filtered and replaced with a fresh dissolution medium. After filtration through 0.45 μm microfilter, concentration of Nebivolol was determined spectrophotometrically at λ max 280 nm [10].
CHARACTERIZATION
FTIR studies
FTIR studies were performed according to the reported method [11].
Powder X-ray diffraction (XRD)
X-ray powder diffraction patterns were recorded on an X-ray powder diffraction system (Shimadzu, Japan) using copper target, a voltage of 40 Kv and a current of 30 mA. The scanning was done over 2_ range of 5º to 60º [12].
SEM (Scanning Electron microscope) studies
SEM studies were performed according to the reported method [13].
Stability studies
Prepared solid dispersions were placed inside sealed 40cc HDPE container with child resistant cap under controlled temperature environment inside stability chamber (Thermo Lab, India) with relative humidity of 75%±5%RH and temperature of 40 0C±20C for stability studies. Samples were removed after 1, 2 and 3 months and evaluated for % drug content and in vitro dissolution studies.
In vivo
bioavailability studies
Animal preparation
Healthy male Wistar rats were (weighing approximately 250±25 g) selected for this study, all the animals were healthy during the period of the experiment. All efforts were made to maintain the animals under controlled environmental conditions (Temperature 250C±20C, Relative Humidity 45%±5%RH and 12 h alternate light and dark cycle) with 100 % fresh air exchange in animal rooms, uninterrupted power and water supply. Rats were fed with standard diet and watered libitum.
Pharmacokinetic study
(Eun-Sol Ha, Gwang-Ho Choo, In-Hwan Baek and Min-Soo Kim. Formulation, Characterization, and in Vivo Evaluation of Celecoxib-PVP Solid Dispersion Nanoparticles Using Supercritical Antisolvent Process, Molecules 2014, 19, 20325-20339)
The pharmacokinetic characteristics for Nebivolol pure drug suspension 10 mg, optimized preparation of solid dispersion 10 mg were evaluated using twelve healthy Male Wister rats weighing 250±25g. Rats were divided in to two groups at random, each group containing six animals. First group was administered Nebivolol (as such) suspension was prepared in 0.5% w/w of HPMC 2.5cPs, second group was administered optimized preparation of solid dispersion suspension was prepared in 0.5% w/w of HPMC 2.5cPs by oral route at an equivalent dose of 10 mg/kg body weight.
About 500 µl of blood was withdrawn from retro orbital plexus at different time intervals such as 0.25, 0.50, 1.00, 1.50, 2.00, 2.50, 3.00, 4.00, 5.00, 6.00, 8.00, 12.00, 16.00, 20.00 and 24.00h. Blood samples were transferred into eppendorf tubes containing heparin in order to prevent blood clotting. The samples were centrifuged immediately at 4000 rpm and the plasma was stored in light-protected container at -20 0C till analysis.
Determination of Nebivolol in Rat plasma by
HPLC method
The chromatographic method was standardized using a HIQ sil C18 column (250×4.6 mm i.d., 5 µm particle size) with UV detection at 289 nm and flow rate of 1 ml/min. The mobile phase consisting of methanol: water (80:20 v/v) with addition of 0.1 percent 1-hexanesulfonic acid monohydrate sodium salt as an ion-pairing reagent was selected.
The retention times about 4 min for Nebivolol and 8.2 min for (Valsartan) IS.
Pharmacokinetic data analysis for optimized
preparation of solid dispersions and pure drug
suspension
The area under the drug concentration-time curve from zero to 24h (AUC) was calculated using the trapezoidal rule. The maximum plasma concentration of the drug (Cmax and the time to reach Cmax (Tmax) was obtained directly from the plasma profiles.
The pharmacokinetic parameters were performed by a non compartmental analysis using Win Nonlin 3.3® pharmacokinetic software (Pharsight Mountain View, CA USA). All values are expressed as the mean±SD. Statistical analysis was performed with Graph Pad InStat software (version 3.00, Graph Pad Software, San Diego, CA, USA) using one-way analysis of variance (ANOVA) followed by Tukey– Kramer multiple comparison test. Difference with p<0.05 was considered statistically significant.
The bioavailability of the optimized preparation of solid dispersion was evaluated using rats.
RESULTS AND DISCUSSION
Preliminary solubility studies of Nebivolol
In case of solid dispersions initially preliminary solubility analysis was carried out to select the appropriate water-soluble carriers for the preparation of solid dispersion in which pure drug solubility was found to be 0.0403 mg/ml (Table 2). From this study, drug and Kleptose HPB in the ratio of 1:1 shown highest drug solubility i.e. 0.886±0.04mg/ml, almost 22-fold increase compared to that of pure drug. For all the soluble carriers used in preliminary solubility studies PEG 6000, PVP k 25, PEG 400, Span 40, Tween 80 shown low solubility when compared with other carriers and did not included in the preparation of Nebivolol solid dispersions. The graphical representation of solubility studies of Nebivolol physical mixtures was shown in Figure 1.
Preparation of Nebivolol solid dispersions
Solid dispersions of Nebivolol were prepared by solvent evaporation method using different carriers like Soluplus, Kolliphor P188, Kolliphor ELP, Labrafac CC and Kleptose HPS in three different drug: polymer: surfactant (SLS) ratios of 1:1:1, 1:5:2 and 1:3:1.5 (Table 1). Total 15 formulations were prepared, the mixture was dissolved in the least amount of methanol as a common solvent. Then the solvent was evaporated in oven at temperature 50ºC till complete evaporation. The resultant solid dispersion was scraped out with a spatula. Solid dispersions were pulverized in a mortar and pestle and passed through a 45μm sieve before packing in an airtight container, stored in a desiccator and used for further investigations. All the solid dispersions prepared were found to be fine and free flowing powers.
Evaluation parameters
Solubility studies of Nebivolol solid dispersions
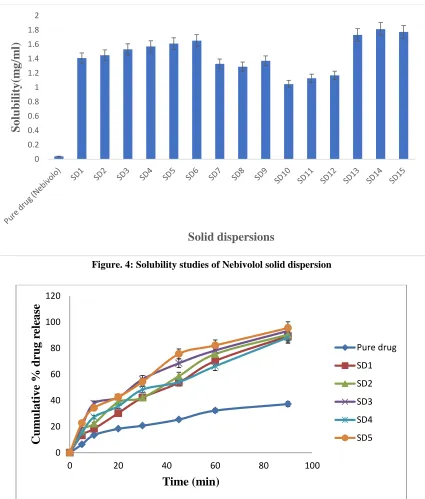
Different formulations of Nebivolol solid dispersions were prepared by solvent evaporation method with their respective carriers. After preparation of solid dispersion solubility analysis was carried out. The formulation (SD14) with Drug, Kleptose HPB and SLS in the ratio of 1:5:2 shown highest solubility i.e. 1.8135±0.07mg/ml, almost 45-fold compared to that of the pure drug (Pure drug solubility is 0.0403±0.04mg/ml). The results are tabulated in Table 3 and graphical representation was shown in Figure 2.
% Practical yield and drug content
The results of % practical yield and % drug content were summarized in Table 4. Formulation SD14 was found to be highest % practical yield and % drug content of 98.34±0.45% and 99.66±0.50 % respectively when compared with other formulations.
In vitro dissolution studies
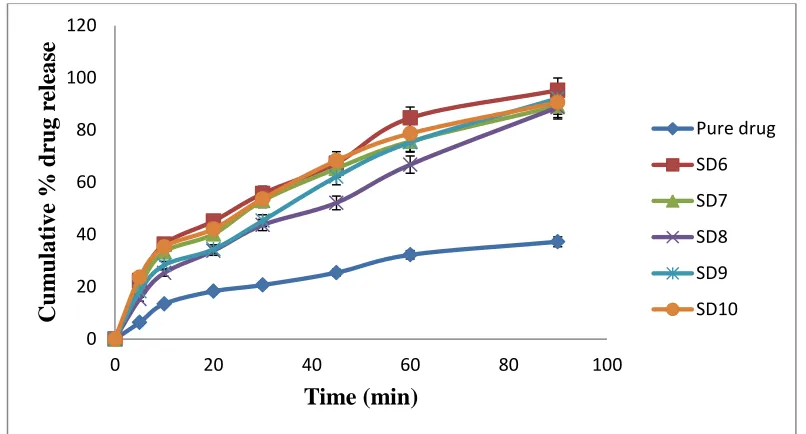
drug release profile, it can be seen that formulation SD14 containing Kleptose HPB and SLS (1:5:2 ratio of drug: Polymer with surfactant) shows higher dissolution rate i.e. 98.17±5.39% compared with other formulations. This may be attributed to the increase in drug wettability, conversion to amorphous form and solubilization of the drug due to hydrophilic carrier. The graphical representation of solid dispersions of SD1- SD15 with pure drug was depicted in Figures 5, 6 & 7
CHARACTERIZATION
FTIR studies
The FTIR spectra of pure Nebivolol, physical mixture and optimized formulation SD14 are shown in Figure 8, 9 and 10 respectively. It was observed that there were no significant changes in the position of characteristic peaks of the drug when mixed with carriers which indicated no incompatibility of excipients and the drug.
X-Ray Diffraction patterns
The Nebivolol solid dispersions were carried out to find out whether the solid dispersions of various drug polymer ratios are crystalline or amorphous. The presence of numerous distinct peaks in the XRD spectrum of pure Nebivolol indicates that it was present as a crystalline material. On the other hand, the spectrum of optimized formulation SD14 of solid dispersion was characterized by the complete absence of any diffraction peak, which is
characteristic of an amorphous compound (Figure 11). The enhancement in the dissolution rate of the drug from the drug- Kleptose HPB and SLS solid dispersion is because of the marked reduction in the crystallinity of the drug.
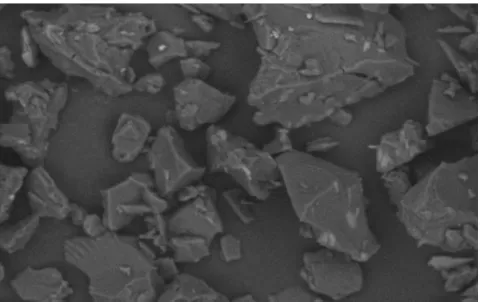
SEM Studies
SEM photographs for pure drug and optimized formulation SD13 are shown in Figures 12 &13. The drug crystals seemed to be smooth-surfaced, irregular in shape and size. In case of Solid dispersions, it was difficult to distinguish the presence of drug crystals. The drug surface in solid dispersion seems to be more porous in nature. Solid dispersions appeared as uniform and homogeneously mixed mass with wrinkled surface. Drug crystals appeared to be incorporated into the particles of the polymers. The solid dispersion looked like a matrix particle. The results could be attributed to dispersion of the drug in the molten mass of the polymer.
Stability studies
Optimized formulation (SD14) was selected for stability studies on the basis of high cumulative % drug release. Stability studies were conducted for drug content and In vitro drug release studies for 3 months at accelerated stability conditions according to ICH guidelines. The optimized formulation was stable during 3months period. From these results it was concluded that, optimized formulation (SD14) is stable and retained their original properties with minor differences.
Determination of Nebivolol in Pharmacokinetic parameters comparison for pure drug suspension and
optimized solid dispersions formulation
Table 1: Pharmacokinetic Parameters of Nebivololoptimized formulation and pure drug Pharmacokinetic Parameters Nebivolol pure drug Nebivolol optimized formulation
C max (ng/ml) 1.58±0.02 2.44±0.06
AUC 0-t (ng h/ml) 3.62±1.54 5.52±1.24
AUC 0-inf (ng h/ml) 5.85±1.17 8.05±1.54
T max (h) 2.00±0.01 1.00±0.05
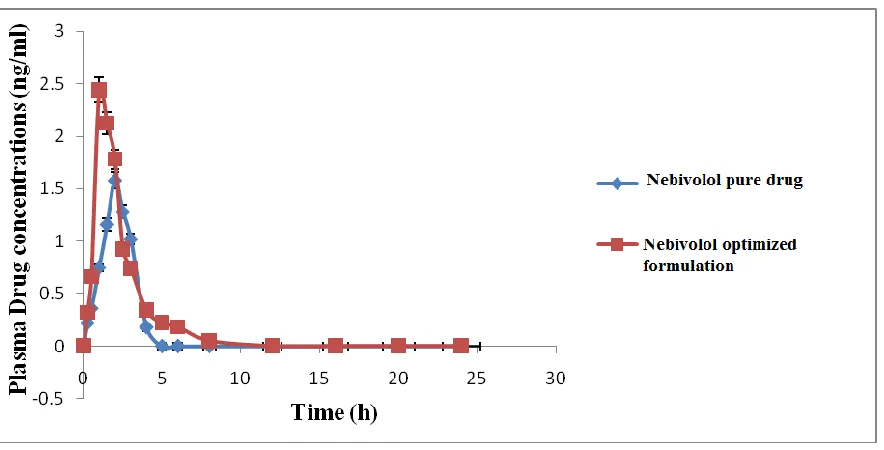
Figure 1 : Plasma concentration–time curves for the Nimodipine optimized formulation and pure drug suspension
The Nebivolol plasma concentrations in rats treated with optimized preparation of solid dispersion was significantly higher than those treated with pure drug suspension. Plasma pharmacokinetic parameters of Nebivolol after oral administration of the formulation to Wister rats are shown in Table. Based on the results, it was clearly evident that Nebivolol from a solid dispersion was significantly increased in comparison with that of the pure drug (Nebivolol suspension). Cmax of the optimized preparation of solid dispersion was 2.44±0.06ng /ml, was significantly higher as compared to Cmax of the pure drug suspension, i.e., 1.58±0.02 ng/ml. Tmax of optimized preparation of solid dispersion, pure drug suspension was 1.00±0.05hr, 2.00±0.01hr respectively, AUC is an important parameter in
evaluating bioavailability of drug from dosage form, as it represents the total integrated area under the blood concentration time profile and represents the total amount of drug reaching the systemic circulation after oral administration. AUC0-inf for optimized solid dispersion formulation was slightly higher (8.05±1.54ng h/ml) than significantly higher than AUC0-inf of the pure drug suspension 5.85±1.17ng h/ml. Statistically, AUC0-t of the optimized preparation of solid dispersion was significantly higher (p<0.05) as compared to pure drug suspension. Higher amount of drug concentration in blood indicated better systemic absorption of Nebivolol from optimized solid dispersion formulation as compared to the pure drug suspension.
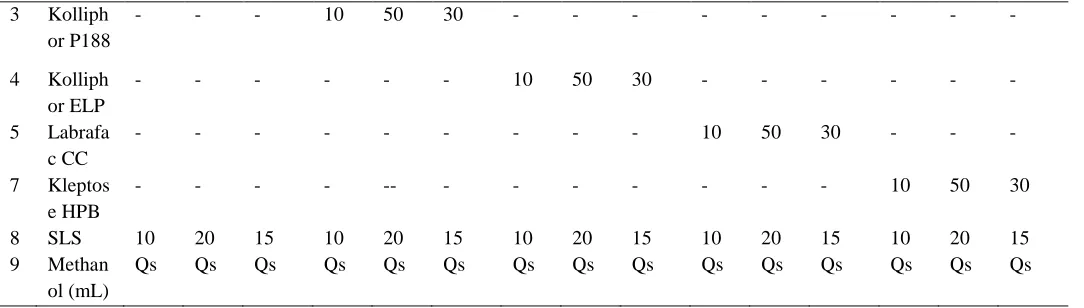
Table 2: Composition of Nebivolol solid dispersions S. N o Ingredi ents (Units) (in mgs) SD1 (1:1 :1) SD2 (1:5 :2) SD3 (1:3: 1.5) SD4 (1:1 :1) SD5 (1:5 :2) SD6 (1:3: 1.5) SD7 (1:1 :1) SD8 (1:5 :2) SD9 (1:3: 1.5) SD1 0 (1:1 :1) SD1 1 (1:5 :2) SD12 (1:3: 1.5) SD1 3 (1:1 :1) SD1 4 (1:5 :2) SD15 (1:3: 1.5)
1 Nebivol ol (mg)
10 10 10 10 10 10 10 10 10 10 10 10 10 10 10
2 Soluplu s
3 Kolliph or P188
- - - 10 50 30 - - - -
4 Kolliph or ELP
- - - 10 50 30 - - - -
5 Labrafa c CC
- - - 10 50 30 - - -
7 Kleptos e HPB
- - - - -- - - 10 50 30
8 SLS 10 20 15 10 20 15 10 20 15 10 20 15 10 20 15
9 Methan ol (mL)
Qs Qs Qs Qs Qs Qs Qs Qs Qs Qs Qs Qs Qs Qs Qs
Table 3: Preliminary solubility studies of Nebivolo in different polymers Physical Mixture (1:1) Solubility(mg/ml) *
Nebivolo (Pure Drug) 0.0403±0.04 Drug + PEG 400 0.644±0.003 Drug + Span 40 0.685±0.13 Drug + Soluplus 0.806±0.01 Drug + Tween 80 0.604±0.04 Drug + Kleptose HPB 0.886±0.05 Drug + Labrafac CC 0.725±0.07 Drug + PVP K 25 0.564±0.11 Drug + Kolliphor ELP 0.765±0.02 Drug + Kolliphor P188 0.846±0.12 Drug + PEG 6000 0.566±0.12
*n=SD±3
Table 4: % Practical yield and drug content for Nebivolo solid dispersions S. No Formulation % Practical Yield % Drug content
1 SD1 91.15±0.10 93.12±0.20
2 SD2 93.36±0.20 92.34±0.15
3 SD3 92.24±0.15 95.56±0.30
4 SD4 96.14±0.35 97.44±0.40
5 SD5 95.27±0.30 96.35±0.35
6 SD6 94.36±0.25 91.66±0.10
7 SD7 93.09±0.20 90.71±0.05
8 SD8 90.36±0.05 93.24±0.20
9 SD9 92.33±0.15 94.36±0.25
Figure 2: Preliminary solubility studies of Nebivolol physical mixture
Figure 3: Preparation of Nebivolol Solid Dispersions 0
0.1 0.2 0.3 0.4 0.5 0.6 0.7 0.8 0.9 1
S
olu
b
il
ity(
m
g/m
l)
Figure. 4: Solubility studies of Nebivolol solid dispersion
Figure 5: In vitro dissolution profile of pure drug and different formulations of Nebivolol solid dispersions (SD1-SD5)
0 0.2 0.4 0.6 0.8 1 1.2 1.4 1.6 1.8 2
S
ol
u
b
il
ity(m
g/
m
l)
Solid dispersions
0 20 40 60 80 100 120
0 20 40 60 80 100
Cum
u
lative
%
d
ru
g r
elease
Time (min)
Pure drug
SD1
SD2
SD3
SD4
Figure 6: In vitro dissolution profile of pure drug and different formulations of Nebivolol solid dispersions (SD6-SD10)
Figure 7: In vitro dissolution profile of pure drug and different formulations of Nebivolol solid dispersions (SD11-SD15)
0 20 40 60 80 100 120
0 20 40 60 80 100
Cum
u
lative
%
d
ru
g r
elease
Time (min)
Pure drug
SD6
SD7
SD8
SD9
SD10
0 20 40 60 80 100 120
0 20 40 60 80 100
Cum
u
lative
%
d
ru
g r
elease
Time (min)
Pure drug
SD11
SD12
SD13
SD14
Figure 8: FTIR Spectrum of Nebivolol pure drug
Figure 9: FTIR Spectrum of Physical mixture
Figure 11: X-Ray diffractograms of (A) Nebivolol pure drug, (B) Physical mixture, (C) Nebivolol Optimized formulation SD14
Figure 12: Pure drug of Nebivolol
CONCLUSION
The dissolution rate of Nebivolol was increased with solid dispersions prepared by solvent evaporation technique without any physical and chemical interaction. In the present study, fifteen formulations of solid dispersions were prepared with 1:1:1, 1:5:2 and 1:3:1.5 ratios of drug: carrier: surfactant by solvent evaporation method. There was significant improvement in the rate of drug release from all 15 solid dispersions and the formulation (SD14) comprising Nebivolol: Kleptose HPB: SLS in 1:5:2 ratio has shown enhanced solubility about 42 folds and significant improvement in the rate of drug release i.e 98.17 within 90 min when compared with pure drug of 37.24 upto 90min. From powder X-ray diffraction (p-XRD) and by scanning electron microscopy (SEM) studies it was evident that polymorphic
form of Nebivolol has been converted into an amorphous form from crystalline within the solid dispersion formulation. From in vivo bioavailability studies, Cmax of the optimized formulation SD14 was 2.44±0.06ng /ml, was significantly higher as compared to pure drug suspension, i.e., 1.58±0.02ng/ml. Tmax of optimized formulation was decreased significantly when compared with pure drug (1.00±0.04hr, 2.00±0.03hr), AUC0-α and AUC0-t for optimized solid dispersion formulation was significantly higher (p<0.05) as compared to pure drug suspension. The present study demonstrated that formulation of Nebivolol solid dispersion by solvent evaporation technique is a highly effective strategy for enhancing the bioavailability of poorly water soluble Nebivolol.
REFERENCE
[1]. Patil A, Sourabh K. Formulation and evaluation of solid dispersions of an anthelmintic drug for enhancement of dissolution rate: JIPBS. 4(3), 2017, 71-74.
[2]. Chowdhary R, Rubaiya A, Shafayet A S, Zahidur R, Tusnova S, Mamun O R. Formulation and Evaluation of Aceclofenac Solid Dispersion for Improving the Solubility and Dissolution Rate. 6, 2017, 30-34.
[3]. Arno A E, Priya D, Hariharan SRK, Vandita K. Formulation Characterization and Pharmacokinetic Evaluation of Telmisartan Solid Dispersions: J Mol Pharm Org Process Res. 4(1), 2016, 131.
[4]. Harshitha M. S, Senthil Kumar K, Gulzar A. Formulation and Evaluation of Fast Dissolving Tablets Of Nebivolo Hydrochloride: IJAPBR. 1(2), 2016, 78-86.
[5]. C.V.S. Subramanian. Textbook of Physical Pharmaceutics: Vallabh Prakashan. 2, 2009, 215-227. [6]. Higuchi T, Connors K. Phase-solubility techniques: Adv Anal Chem Instrum. 4, 1965, 117-212.
[7]. Dhirendra K, Lewis S, Udupa N. Solid Dispersions: A Review. Pak. J. Pharm. Sci. 22(2), 2009, 234-246. [8]. Lakshmi K, M. Pranav Kumar R, Rajesh K. Dissolution enhancement of Telmisartan by surface solid dispersion
technology: International Journal of Innovative Pharmaceutical Research. 3(4), 2012, 247-251.
[9]. Shingala K, Chetan S, Deepak D. Formulation development and evaluation of immediate release tablet of poorly soluble Nifedipine: Journal of Pharmaceutical science and Bio scientific Research. 3(2), 2013, 77-90.
[10]. Valizadeh H, Nokhodchi A, Qarakhani N. Physicochemical characterization of solid dispersions of nifedipine with PEG 6000, Myrj 52, lactose, sorbitol, dextrin, and Eudragit E100: Drug Dev Ind Pharm. 30(3), 2004, 303-17.
[11]. Yang M, Wang P, Huang CY et al. Solid dispersion of acetaminophen and poly (ethylene oxide) prepared by hot-melt mixing: Int J Pharm. 395(1-2), 2010, 53-61.
[12]. Shamma Rehab N, Basha M. Soluplus A novel polymeric solubilize for optimization of Carvedilol solid dispersions Formulation design and effect of method of preparation Powder Technology. 237, 2013, 406–414. [13]. Breitenbach J. Melt extrusion from process to drug delivery technology: Eur J Pharm Biopharm. 54, 2002, 107–