Development and Implementation of Load Cell in
Weight Measurement Application for Shear Force
C. Huang Shen
1, T. Shi Kee
1, Brenda C. T. Lee
2, and F. Y. C. Albert
11 Department of Electrical and Electronic Engineering, UCSI University, Cheras, 56000 Kuala Lumpur, Malaysia 2 Department of Civil Engineering, UCSI University, Cheras, 56000 Kuala Lumpur, Malaysia
Email: {Chuahs, Fongyc}@ucsiuniversity.edu.my, [email protected], [email protected]
Abstract—This paper is presented a simple and amateur prototype of shear force testing apparatus machine for the education training kit purpose. The prototype was based on the Wheatstone Bridge network principle and applies in S-Beam load cell. Shear force on the beam is calculated and obtained by processing the change range of output voltage of the load cell sensor via microcontroller (16F887). MPLAB XC8 compiler is used to compile the C code into machine code while PICKIT3 is used to load the machine file into microcontroller. INA128P amplifier op-amp is used to amplifier the signal due to the output of load cell is in millivolt. RC passive low-pass filter is used to filter the noise. Graphic User Interface (GUI) and LCD are used to display the total shear force for the verification. The experiment results have shown a significant polynomial second order linear in analogue output data proportional to the loads.
Index Terms—load cell, amplifier, shear force, Wheatstone Bridge, sketch up
I. INTRODUCTION
When a beam is subjected to external lateral loading, shearing forces are present in each section of the beam. Shear force acts in opposite directions on each side of a section. The apparatus investigated in this study is an instrumentation that measures the magnitude of shearing forces in a simply-supported beam. A load cell [1] is one of the devices able to measure shear force and bending movement for the overload protection [2]. It could be found that nowadays a lot of shear force apparatus was using a load cell as the main sensor. The load cell was evolution from a Wheatstone Bridge [3]. The structure design is using four resistors to become an electrical circuit. Wheatstone Bridge was popularized by an English physicist named Sir Charles Wheatstone in 1843. The load cell was a transducer that is used to create an electrical signal (voltage - normally in millivolt) whose magnitude is directly proportional to the force being measured.
A. Wheatstone Bridge Circuit
Transducer S-Bean is a device that converts mechanical stimulus into electrical signals for the applications in test and measurement. This transducer S-Bean is in a Wheatstone Bridge configuration as shown in Fig. 1.
Manuscript received February 16, 2017; revised June 29, 2017.
Figure 1. Wheatstone Bridge circuit configuration
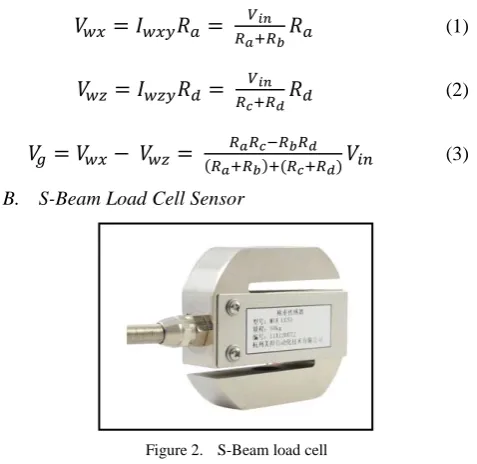
The Wheatstone Bridge circuit is given by the following equation:
𝑉
𝑤𝑥= 𝐼
𝑤𝑥𝑦𝑅
𝑎=
𝑅𝑉𝑖𝑛𝑎+𝑅𝑏
𝑅
𝑎(1)
𝑉
𝑤𝑧= 𝐼
𝑤𝑧𝑦𝑅
𝑑=
𝑅𝑉𝑖𝑛𝑐+𝑅𝑑
𝑅
𝑑(2)
𝑉
𝑔= 𝑉
𝑤𝑥− 𝑉
𝑤𝑧=
𝑅𝑎𝑅𝑐−𝑅𝑏𝑅𝑑(𝑅𝑎+𝑅𝑏)+(𝑅𝑐+𝑅𝑑)
𝑉
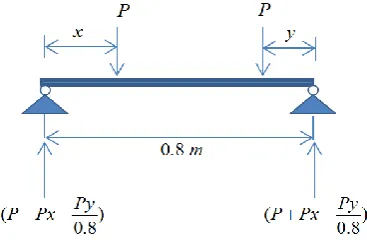
𝑖𝑛(3) B. S-Beam Load Cell Sensor
Figure 2. S-Beam load cell
threaded holes. The modal of the load cell is MIK-LCS1 from MEACON China.
C. Shear Force Measurement Apparatus
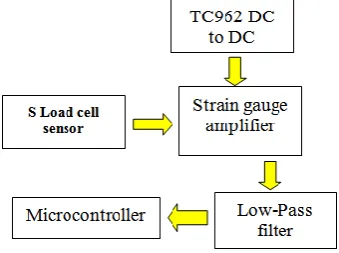
The shear force [5] measurement apparatus used in this study measures the resulting shearing forces in the mid-section of a 0.8 m long beam. The free body diagram of the forces acting on the beam is as shown in Fig. 3 below. Vertical loads of P are applied on two separate points on the beam. The resulting vertical reaction forces at the supports are also shown in the free body diagram.
Figure 3. Free body diagram of vertical forces on beam
The shear force in the mid-section of the beam on the apparatus is measured using a load-cell; where the shear resistance in the beam at that section is removed and replaced by a spring that connects the two parts of the beam (left and right).
II. METHODOLOGY
A. Strain Gauge Amplifier
The output voltage signal from load cell was in mV scale. This voltage is too low for microcontroller to recognize the different weight changes. The voltage has to be used an amplifier to boost up the extremely small output signal to high amplitude waveform. The INA128P [5] IC was an instrumentation amplifier as shown in Fig. 4. It was a type of differential amplifier with input buffer amplifiers, which eliminate the need for input impedance matching and thus make the amplifier particularly suitable for use in measurement and test equipment. The suitable value of the resistors and voltage, this equation below is needed be applied. The Rg is an ohm which is needed to refer to this document, SBOS051B − OCTOBER 1995 [6] to find the value of Ω to fit the amplifier gain which is needed in the application.
Figure 4. Strain gauge amplifier
𝐺𝑎𝑖𝑛 = 1 + Ω
𝑅𝐺 (4)
𝑉𝑜𝑢𝑡= (1 +2𝑅𝑅1 𝑔)
𝑅3
𝑅2(𝑉2− 𝑉1) (5) B. Design and Drawing Apparatus Platform
The shear force hardware platform is designed and draw by using the limited free 3D modeling software which is Google SketchUp [7] as shown in Fig. 5. The platform is based on the theory experiments. This hardware to be carried out for the lab practical section to verify and compare with the theory calculation. The located point shear force apparatus was designed to support testing purpose. The weight hook is located 0.33 (Px) meter away from the support beam (0.8m away from each other) at the leaf side. According to the equation of the free body diagram, the shear force is given by the following equation:
Shear force = 0.330.8 × Load in Newton unit (6)
Figure 5. SketchUp shear force platform
C. Hardware and Software Implementation
Microcontroller (16F887) is being used as a Central Processing Unit (CPU) to read, calculate, control, monitor the signals from the S-beam load cell. The C++ language code is written under MPLABX IDE [8] from Microchip Technology. MPLAB XC8 compilers is used to compile the C++ language into machine language. Finally, the machine language is loaded into microcontroller through the PICKIT3 as shown in Fig. 6. Microsoft Visual Studio was used to design the Graphic User Interface (GUI) to display the total shear force of the load. The data in between the computer and the hardware was communicated through the USB port using the USB to RS232 convertor. The completed GUI interface is shown in Fig. 7.
Figure 7. GUI interface
D. System Control Chart
The flowchart in Fig. 8 is draw according to the sequence of operations in the Visual Basic GUI interface. The user is required to choose the serial port number (COM port) and set the baud rate. Then, click the left-hand side button or right-left-hand side button on the GUI to perform the measurement of the load. The GUI’s setting that had finally been set. An acknowledgement signal is transmitted to the microcontroller. Thus, this signal allows the microcontroller to interact in between the GUI and the S-Beam load cell. Lastly, measurement result is displayed on the GUI and the LCD.
Figure 8. Overall system operation
E. Circuit Configuration and Development
The tension and compression measurement electrical output signal of the load cell is typically in the order of a few millivolts. Thus, it is requires amplification by the strain gauge amplifier.
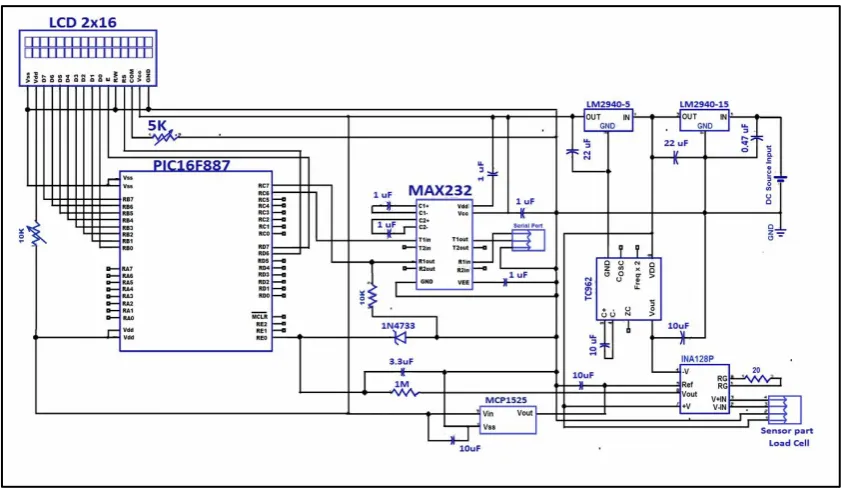
INA128 Instrumentation amplifier (built from three op-amps) is used in this circuit application, which has been designed for the input protection can support up to ±40V without damage. Current-feedback input provides a large bandwidth even at high gain such as 200 kHz at gain=100. TC962 has been added to the INA128 as switched capacitors to produce a negative voltage. TC962 is a high current DC to DC convertor to create a voltage in the range would be -18V to +18V. A simple RC low pass filter is used to remove low frequency noise from the signal (output of the INA128). The cut off frequency is 0.048 Hz. The operation of the amplifier block diagram is shown in Fig. 9. The whole schematic diagram has been developed for all of the components shown in Fig. 10. The LM2940-5 and LM2940-15 are voltage regulators, low dropout at 5V and 15V respectively. A Liquid Crystal Display (LCD) 16 Character x 2 Line is used to display the weight of the measurement. The
microcontroller 16F887 is used to read the load cell analogue data and converted into digital 10 bits data, then send to the data to computer (COM port) in the UART format. The weight is displayed on the LCD. The Schematic diagram and PCB board were drawn and routed using the diptrace software. Diptrace is free software and provide all features and libraries up to 300 pins and 2 layers. The Fig. 11 is shown the PCB layout design and fabrication. The completed hardware testing set up is shown in Fig. 12.
Figure 10. Complete hardware schematic diagram
Figure 11. Completed hardware schematic diagram designed circuit board in 3D view and PCB board development
Figure 12. Completed hardware testing set up
III. RESULTS
The load tests of shear force were carried out by 200g, 400g, 600g, 800g, 1000g, 1200g and 1400g on the left and right side. Experiments were performed in triplicate, and the results are shown in Tables I and II. Fig. 13 is shown that the display of the computer and the LCD after the load is applied at the shear beam.
Figure 13. Load shear force results
TABLE I. RIGHT HAND SIDE S-BEAM PROPERTIES OF ELECTRIC SIGNALS PRODUCED AT SELECTED LOAD
Load 0 gram
0.000N
200 g 1.962N
400 g 3.924N
600 g 5.886N
800 gram 7.848N
1000 gram 9.810N
1200 gram 11.772N
1400 gram 13.734N
Test 1 1.350V 1.471V 1.522 V 1.422 V 1.577V 1.600V 1.636V 1.653V
Test 2 1.320V 1.462V 1.527 V 1.410 V 1.561V 1.622V 1.625V 1.665V
Test 3 1.318V 1.444V 1.543 V 1.449 V 1.531V 1.611V 1.633V 1.655V
Average 1.329V 1.459V 1.531V 1.427V 1.556V 1.611V 1.631V 1.658V
TABLE II. LEFT HAND SIDE S-BEAM PROPERTIES OF ELECTRIC SIGNALS PRODUCED AT SELECTED LOAD
Load 0 gram 0.000N
200 g 1.962N
400 g 3.924N
600 g 5.886N
800 gram 7.848N
1000 gram 9.810N
1200 gram 11.772N
1400 gram 13.734N
Test 1 1.343 V 1.405V 1.380V 1.177V 1.298V 1.267V 1.019V 0.956V
Test 2 1.360 V 1.391V 1.373V 1.206V 1.299V 1.264V 1.059V 0.953V
Test 3 1.313 V 1.419V 1.383V 1.141V 1.329V 1.262V 1.056V 0.961V
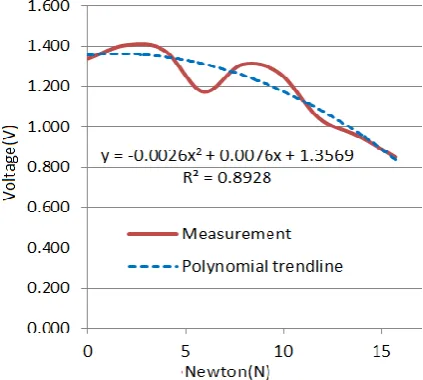
The plots for voltage signal vs. load are illustrated in Fig. 14 and 15.
Figure 14. Right hand side S-beam properties of electric signals
Figure 15. Left hand side S-beam properties of electric signals
IV. CONCLUSION
S-Beam load cell was performed at selected weight from 200 gram to 1400 gram in a shear force platform. The output voltage of the load cell sensor is in between 1.3 V to 1.67 V at right side, while the left hand side is in between 0.95 volts to 1.3 volts. The polynomial second order trend lines were plotted with interval of 87% and 90% which indicated the strength of values. The S-beam load cell equation is formulated and able to embed into microcontroller to perform the Newton calculation. Future testing should be investigated the role of its compression or tension load in order to mimic real load condition.
ACKNOWLEDGMENT
The authors would like to acknowledge the conference funding from UCSI University, Centre of Excellence for
Research, Value Innovation and Entrepreneurship (CERVIE).
REFERENCES
[1] A. Blakeborough, D. Clément, M. S. Williams, and N. Woodward, “Novel load cell for measuring axial force, shear force, and bending movement in large-scale structural experiments,”
Experimental Mechanics, vol. 42, no. 1, pp. 115-122, March 2002.
[2] F. Aghili, “Design of a load cell with large capacity,”
Transactions of the Canadian Society for Mechanical Engineering,
vol. 34, no. 3-4, 2010.
[3] W. Hernandez, “Improving the response of a load cell by using optimal filtering,” Sensors, vol. 6, pp. 697-711, 2006.
[4] Load Cell Handbook, a Technical Overview and Selection Guide.
PCB Load & Torque Division, A PCB Group Company, p. 5. [5] F. Beer, E. R. Johnston, J. DeWolf, and D. Mazurek, Mechanics of
Materials, Seven edition, McGraw Hill Education, 2015, ch. 5, p.
346.
[6] L. E. Bengtsson, “A microcontroller-based lock-in amplifier for sub-milliohm resistance measurements,” Review of Scientific
Instruments,vol. 83, 2012.
[7] S. Singh, Beginning Google Sketchup for
2010.
[8] MPLAB® X IDE User’s Guide, Microchip Technology Inc.,
2011-2014.
Huang Shen C. holds a Master of Science in
Electronics Engineering from the Queen’s University Belfast with a thesis on silicon and gallium arsenide bonding technologies. After a process engineer positions in the KESM Industries Berhad. He became a lecturer in Colleges and Universities College. He joined UCSI University in 2012 as a Lecturer, a Principal (PI) and Co-Principal Investigator on sponsored. Currently, he is pursuing his Ph.D. in the field of embedded systems with pyrolysis process for the renewable energy.
Brenda C. T. Lee completed her Ph.D. studies in computer simulation
at Swansea University. She spent five years in the academia teaching Structural and Finite Element Analysis. She is currently practicing in a consultant company to gain industrial experience in the field of her interest.
T. Shi Kee holds a BEng degree in Electrical and Electronics Engineering from UCSI University in 2016. His research interest includes Computer Networks and Embedded system design.
F. Y. C Albert received the B.Eng. degree (with honours) in electronic engineering majoring in robotics and automation from the Multimedia University, Melaka, Malaysia in 2008, the Master degree in engineering from the Universiti Tenaga, Malaysia, in 2010. Currently doing a Ph.D. degree in engineering at the Universiti Tenaga, Malaysia. In 2010, he joined the Department of Electrical & Electronics Engineering, UCSI University as a Lecturer position. Currently a Senior Lecturer at the UCSI University. His research interests cover the design and analysis of various electrical & electronics, power electronics, Instrumentation, control systems, robotics, automation and also renewable energy systems.