ISSN 0975-928X
Research Note
Morphological characterization and multivariate analysis in little millet
V. Manimozhi Selvi1* A. Nirmalakumari2 and A Subramanian3
1
Centre for Plant Breeding and Genetics, Tamil Nadu Agricultural University, Coimbatore 2
Centre of Excellence in Millets, Athiyandal, Tiruvannamalai 3
Coconut Research Station, Aliyarnagar Email: manimozhiagri2005@gmail.com
(Received: 16 Aug 2014; Accepted:19 Feb 2015)
Abstract
One hundred and ten little millet genotypes were evaluated for 12 morphological traits. When the Principal Component Analysis was performed, the first three PCs exhibited 60.74 per cent of the total variation shown by the 12 traits studied. The 110 genotypes were grouped into five basic groups. The results revealed that single plant grain yield, flag leaf length, thousand grain weight, days to 50 per cent flowering and plant height were the major traits contributing for the overall variability implying that these traits would meet the target of little millet improvement programme. Elucidation of morphological data to determine the pattern of variability within 110 little millet genotypes studied led to the recognition of four clusters. Cluster analysis indicated that little millet genotypes from different geographical regions were observed to group together. The reason could be either due to the fact that selection criteria for the specific traits might be similar particularly based on the adaptive nature of the environment or the same type of consumer preference. This approach would help to identify the traits of importance that possessed the maximum variability for evolving high yielding little millet genotypes.
Keywords
Little millet, Morphological traits, Principle Component Analysis, Cluster analysis
The alarming changes occurring in climatic conditions, particularly the erratic rainfall pattern, water scarcity and increasing temperature pose threat to agriculture and food security globally with special reference to arid and sub-arid regions. Small millets offer both nutritional and livelihood security for human beings and also feed and fodder security for poultry and livestock population in dryland regions of rural India (Pradhan et al., 2010). Among the small millets, littlemillet (Panicum sumatrense Roth. ex. Roem. and Schultz.) is an important indigenous and drought resistant crop. It is widely grown in the semiarid tropics of Asia and constitutes a vital source of protein, minerals and vitamins for people living in these areas. Littlemillet is also reported to have 38 per cent of dietary fiber and it has fat content which is higher in polyunsaturated fatty acids. It is the primary source of food in situations where other food grains generally could not be raised or unavailable. Being an eco-friendly crop, it is suitable for vulnerable agro-ecosystems and shall be a preferred crop for sustainable and green agriculture.
Principal Component Analysis (PCA) is a valuable technique from applied linear algebra which may be used to classify the relationships between the traits in multi- trait systems and for identifying the patterns of data by reducing the number of dimensions. An insight into the process contributing differences in yield among the genotypes is essential for identification and selection of top ranking genotypes out of diverse germplasm base.
Morphological studies provide information which could be used for practical genotype identification and hypothesizing phylogenetic relationships. The limited information available on many important and basic aspects of neglected and under- utilized crops such as littlemillet, hinder their development. Hence, the present study was planned to choose promising genotypes for their specific traits to be evolved as a high yielding variety or used in a crossing programme.
ISSN 0975-928X
each entry based on the descriptors for Panicum sumatrense (IBPGR, 1985). All the 12 quantitative traits were subjected to Principal Component Analysis using SPSS 16 software to identify the major contributing traits. The multivariate statistic was used for establishing relationships between the genotypes. The data matrix was used to calculate the correlation among various characters. The correlation coefficient matrix was subjected to eigenvector analysis. The eigenvectors derived were used to extract the first three most informative principal components as suggested by Johnson and Wichern (1988). Those three components were plotted in three dimentional mode in various combinations. The Principal Components with eigen values ≥ 1.0 were considered for selection. The observed data on 12 quantitative characters were analysed using NTSYS- Pc (version 2.0) statistical package for UGPMA dendrogram tree construction.
Quantitative assessment of genotypes: Morphological diversity of 110 littlemillet genotypes was studied in this investigation. The findings of quantitative assessment of these genotypes and key morphological variability observed for the 12 traits have been explained. The PCA performed on the 12 quantitative traits confirmed the existence of high genetic diversity in the littlemillet genotypes used for the experiment. The UPGMA dendrogram revealed four major clusters.
Contribution of characters towards principal component factors:The first three components accounted for 31.84, 50.66 and 60.74 per cent of cumulative variation progressively. The proportion of variation contributed by the individual PC1 and PC2 were 31.84 and 18.81 per cent respectively. The PC1, PC2, PC3 and PC4 alone had eigen values greater than one (Table.2 and Fig. 1a). As shown in table 3 the PC1 had high positive loadings for flag leaf width (0.878) followed by plant height (0.865), days to 50 per cent flowering (0.541), single plant dry fodder yield (0.475) and panicle length (0.468). This implied that these five traits were positively correlated with grain yield and selection should be exercised accordingly. On the other hand, it had high negative loading for culm branches per plant (-0.810) and thousand grain weight (-0.771). This in-turn expressed that these two characters were negatively correlated with grain yield. Hence, it is important to select genotypes having optimum plant height, medium duration, high biomass, lengthier panicles and medium test weight with non branching culms for high grain yield. The PC2 axis might be regarded as a yield vector having high factor loadings for single plant grain yield (0.828) along with flag leaf length (0.829), panicle length (0.593) and peduncle length (0.555). The PC3 could be considered as important with reference to
selection of plants having more number of basal tillers per plant.
The three dimentional spatial figuration showed six groups of the traits studied (Fig.1b). Group I had two traits viz., single plant grain yield and flag leaf length which were confirmed through PC2 also. Group II had three traits (flag leaf width, plant height and days to 50 % flowering) clustered together which were revealed in PC1. Three traits namely, basal tillers per plant, thousand grain weight and peduncle length were found clustered together in group III. The group IV had panicle exertion and single plant dry fodder yield and the group V had panicle length and culm branches per plant together. The trait, flag leaf length contributed more towards single plant grain yield whereas more number of basal tillers per plant contributed towards bold seeds and were clustered together. Several authors indicated that different morphological traits had contributed their role in overall variability observed among the germplasm resources (Lule et al., 2011 and Dagnachew Lule et al., 2012 in fingermillet).
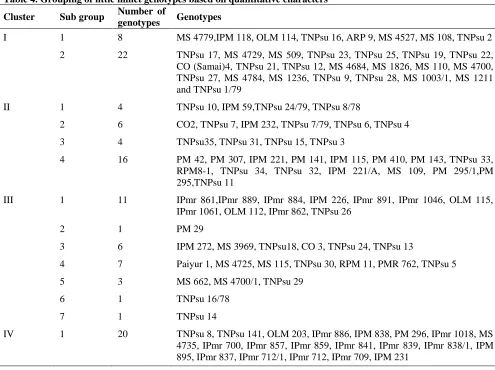
Grouping of genotypes through Cluster analysis:The UPGMA dendrogram revealed four major clusters (Table 4) and the cluster I consisted 30 genotypes. They were found divided into two separate sub groups. Sub group one comprised of eight genotypes, which had medium duration to flowering, optimum number of basal tillers, multi branched, average single plant grain yield and medium size seeds. The sub group two was composed of 22 genotypes which were characterized by high single plant grain yield. Both the sub groups differed from one another with respect to its single plant grain yield, though the genotypes in cluster I had been collected from Tamil Nadu only.
ISSN 0975-928X
Thirty genotypes placed together incluster III had seven sub groups. Group 1 contained the maximum number of individuals (11) followed by group 4 (7), group 3 (6), group 5(3) and group 2, group 6 and group 7 had a single genotype. Genotypes in sub group one were characterized by tall plant stature, medium flowering duration, non branched culms , broad leaves, average yield and small size seeds. The only one genotype PM 29 in sub group two differed from other genotypes by tall plant stature, late flowering, high yield and bold seeds. Six genotypes viz., IPM 272, MS 3969, TNPsu 18, CO 3, TNPsu 24 and TNPsu 13 together placed in sub group three were characterized by dwarf, early flowering, high yield and bold seeds. The sub group four composed of seven genotypes which had dwarf, early flowering, average yield and bold seeds. Genotypes, MS 662, MS 4700/1 and TNPsu 29 were placed in sub group five which were dwarf in plant stature, early flowering and low yielder with bold seeds while, sub group six had a single genotype, TNPsu 16/78, which was dwarf, early flowering and average yielder with medium seed size. Genotype, TNPsu 14 constituted sub group seven which had dwarf plant stature, medium flowering duration, average yield and small size seeds.
Cluster IV was formed by 20 individuals which were characterized by tall plant stature, late flowering, low tillering capacity, non branching culms, longer flag leaf, broad leaves, average grain yield and small size seeds. First and second sub groups of cluster I, first, second and third sub groups of cluster II and fifth, sixth and seventh sub groups of cluster III had accessions collected from Tamil Nadu only. These genotypes showed parallelism between geographical origin and genetic diversity. The reason for these accessions from geographical origin grouped into distinct clusters might be due to the identical genetic architecture among them. This is in agreement with the earlier findings of Nagarajan and Prasad (1980) and Manoharan and Sivasubramanian (1988) in prosomillet. Accessions of different geographical origins viz., Karnataka, Andhra Pradesh, Bihar and Madhya Pradesh were grouped together into fifth sub group of cluster II. This would be due to the similarity of objectives and conditions under which these genotypes were bred and domesticated in different localities.
First sub group of cluster III had accessions from Odisha and Andhra Pradesh, which indicated that these genotypes were evolved under similar selection pressure irrespective of their geographic origins. It is due to differential adaptation of various accessions belonging to same eco geographic region. Also the similarity could be either due to the fact that farmer’s selection criteria for a given trait might be similar particularly based on
primary parental seed source could be the same. However, early and quick seed exchange might also be an additional reason for grouping of genotypes from different regions into one cluster. Such supportive results were reported by Reddy et al. (2009) and Andualem Wolie and Ketema Belete (2013) in fingermillet.
Conclusion: From this experiment, it is observed that the first three principal components contributed the maximum variability by more number of characters to aid selection and this could in-turn be effectively used for further breeding programmes. In addition, the results implied that the important traits such as, single plant grain yield, thousand grain weight, flag leaf length, plant height and panicle length were the important contributors for the variability. Hence, selection should be exercised for grain yield enhancement using these traits.
Acknowledgement:The authors would like to acknowledge PPV & FRA, Ministry of Agriculture, GOI, New Delhi and the Project coordinator, AICSMIP for funding the research work.
References
Andualem Wolie and Ketema Belete. 2013. Genetic divergence and variability studies in some Ethiopian finger millet germplasm collections. J. Agric. Sci.,
3(4): 110-113.
Dagnachew Lule, Kassahun Tesfaye, Masresha Fetene, and Santie de Villiers. (2012). Multivariate analysis for quantitative traits in finger millet population collected from Eastern and South eastern Africa :
Detection for patterns of genetic diversity7(6) : 303
– 314
IBPGR (1985). Descriptors for Panicum miliaceum and
Panicum. sumatrense, (1985). Rome, Italy: International Board for Plant Genet. Resources, 14 pp
Johnson, R.A. and D.W. Wichern. 1988. Applied Multivariate Statistical Analysis. Prentice- Hall, Englewood Cliffs, N.J.
Lule, D. Bekele, E. and Ayana, H. (2011). The extent and pattern of genetic diversity for quantitative traits in tef landrace populations Proc. Conf. Crop Sci. Soc. Ethiop., 13 : 183 – 195.
Manoharan, V. and V. Sivasubramanian. 1988. An appraisal of genetic diversity in proso millet. Madras Agric. J., 75(9-10): 323-330.
Nagarajan, K. and M.N. Prasad. 1980. Studies on variability, correlation and path analysis in foxtail millet (Setaria italica (L.) Beauv.). Madras Agric. J., 67(4): 220-227. Pradhan, A.S., K. Nag and S. K. Patil. 2010. Dietry
management of fingermillet controls diabetes.
Current Sci.,98 (6): 763 – 765.
ISSN 0975-928X
ISSN 0975-928X
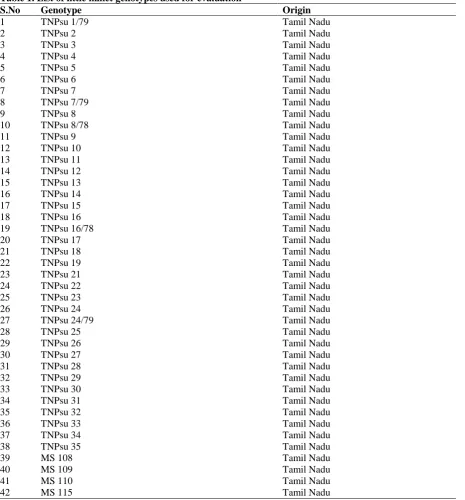
Table 1. List of little millet genotypes used for evaluation
S.No Genotype Origin
1 TNPsu 1/79 Tamil Nadu
2 TNPsu 2 Tamil Nadu
3 TNPsu 3 Tamil Nadu
4 TNPsu 4 Tamil Nadu
5 TNPsu 5 Tamil Nadu
6 TNPsu 6 Tamil Nadu
7 TNPsu 7 Tamil Nadu
8 TNPsu 7/79 Tamil Nadu
9 TNPsu 8 Tamil Nadu
10 TNPsu 8/78 Tamil Nadu
11 TNPsu 9 Tamil Nadu
12 TNPsu 10 Tamil Nadu
13 TNPsu 11 Tamil Nadu
14 TNPsu 12 Tamil Nadu
15 TNPsu 13 Tamil Nadu
16 TNPsu 14 Tamil Nadu
17 TNPsu 15 Tamil Nadu
18 TNPsu 16 Tamil Nadu
19 TNPsu 16/78 Tamil Nadu
20 TNPsu 17 Tamil Nadu
21 TNPsu 18 Tamil Nadu
22 TNPsu 19 Tamil Nadu
23 TNPsu 21 Tamil Nadu
24 TNPsu 22 Tamil Nadu
25 TNPsu 23 Tamil Nadu
26 TNPsu 24 Tamil Nadu
27 TNPsu 24/79 Tamil Nadu
28 TNPsu 25 Tamil Nadu
29 TNPsu 26 Tamil Nadu
30 TNPsu 27 Tamil Nadu
31 TNPsu 28 Tamil Nadu
32 TNPsu 29 Tamil Nadu
33 TNPsu 30 Tamil Nadu
34 TNPsu 31 Tamil Nadu
35 TNPsu 32 Tamil Nadu
36 TNPsu 33 Tamil Nadu
37 TNPsu 34 Tamil Nadu
38 TNPsu 35 Tamil Nadu
39 MS 108 Tamil Nadu
40 MS 109 Tamil Nadu
41 MS 110 Tamil Nadu
ISSN 0975-928X
Table 1. Contd..
S.No Genotype Origin
43 MS 509 Tamil Nadu
44 MS 662 Tamil Nadu
45 MS 1003/1 Tamil Nadu
46 MS 1211 Tamil Nadu
47 MS 1236 Tamil Nadu
48 MS 1826 Tamil Nadu
49 MS 3969 Tamil Nadu
50 MS 4527 Tamil Nadu
51 MS 4684 Tamil Nadu
52 MS 4700 Tamil Nadu
53 MS 4700/1 Tamil Nadu
54 MS 4725 Tamil Nadu
55 MS 4729 Tamil Nadu
56 MS 4735 Tamil Nadu
57 MS 4779 Tamil Nadu
58 MS 4784 Tamil Nadu
59 PM 29 Madhya Pradesh
60 PM 42 Bihar
61 PM 141 Madhya Pradesh
62 PM 143 Karnataka
63 PM 295 Andhra Pradesh
64 PM 295/1 Madhya Pradesh
65 PM 296 Bihar
66 PM 307 Andhra Pradesh
67 PM 410 Karnataka
68 IPM 59 Patancheru, Andhra Pradesh
69 IPM 115 Patancheru, Andhra Pradesh
70 IPM 118 Patancheru, Andhra Pradesh
71 IPM 221 Patancheru, Andhra Pradesh
72 IPM 221/A Patancheru, Andhra Pradesh
73 IPM 226 Patancheru, Andhra Pradesh
74 IPM 231 Patancheru, Andhra Pradesh
75 IPM 232 Patancheru, Andhra Pradesh
76 IPM 272 Patancheru, Andhra Pradesh
77 IPM 838 Patancheru, Andhra Pradesh
78 IPM 884 Patancheru, Andhra Pradesh
79 IPM 895 Patancheru, Andhra Pradesh
80 IPmr 700 New Delhi
81 IPmr 709 New Delhi
82 IPmr 712 New Delhi
83 IPmr 712/1 New Delhi
84 IPmr 837 New Delhi
85 IPmr 838/1 New Delhi
86 IPmr 839 New Delhi
87 IPmr 841 New Delhi
ISSN 0975-928X
Table 1. Contd..
S.No Genotype Origin
89 IPmr 859 New Delhi
90 IPmr 861 New Delhi
91 IPmr 862 New Delhi
92 IPmr 886 New Delhi
93 IPmr 889 New Delhi
94 IPmr 891 New Delhi
95 IPmr 1018 New Delhi
96 IPmr 1046 New Delhi
97 IPmr 1061 New Delhi
98 PMR 762 Banglore, Karnataka
99 RPM 8-1 Madhya Pradesh
100 RPM 11 Madhya Pradesh
101 ARP 9 Tamil Nadu
102 OLM 112 Odisha
103 OLM 114 Odisha
104 OLM 115 Odisha
105 TNPsu 141 Tamil Nadu
106 Paiyur 1 Tamil Nadu
107 CO 2 Tamil Nadu
108 CO 3 Tamil Nadu
109 CO(Samai) 4 Tamil Nadu
110 OLM 203 Odisha
Table. 2 Eigen values and the proportion of total variability among little millet genotypes as explained by the Principal Components
Principal Component Eigen value Proportion of variation (%)
Total variation explained across axis (%)
1 3.82 31.84 31.85
2 2.26 18.81 50.66
3 1.21 10.08 60.74
4 1.03 8.56 69.30
5 0.93 7.71 77.01
6 0.74 6.19 83.20
7 0.58 4.88 88.08
8 0.45 3.76 91.84
9 0.37 3.11 94.95
10 0.23 1.92 96.87
11 0.21 1.80 98.67
ISSN 0975-928X
Table 3. Eigen value, factor scores and contribution of the first five principal component axes to variation in littlemillet genotypes
Characters Principal components
PC1 PC2 PC3 PC4 PC5
Plant height (cm) 0.865 0.200 0.056 0.026 0.140
Days to 50 % flowering 0.541 -0.135 -0.463 -0.342 0.076
Basal tillers per plant -0.368 0.216 0.622 -0.238 0.273
Culm branches per plant -0.810 -0.061 -0.116 0.122 0.081
Peduncle length (cm) -0.118 0.555 -0.429 0.503 0.221
Panicle length (cm) 0.468 0.593 -0.176 0.103 0.446
Panicle exertion (cm) 0.338 -0.091 0.408 0.715 -0.240
Flag leaf length (cm) -0.157 0.829 -0.008 -0.090 -0.397
Flag leaf width (cm) 0.878 -0.023 0.030 -0.016 -0.177
Single plant dry fodder yield (g) 0.475 0.296 0.455 -0.104 0.336
Thousand grain weight (g) -0.771 0.140 0.008 0.052 0.288
Single plant grain yield (g) -0.162 0.828 0.043 -0.205 -0.358
Table 4. Grouping of little millet genotypes based on quantitative characters Cluster Sub group Number of
genotypes Genotypes
I 1 8 MS 4779,IPM 118, OLM 114, TNPsu 16, ARP 9, MS 4527, MS 108, TNPsu 2 2 22 TNPsu 17, MS 4729, MS 509, TNPsu 23, TNPsu 25, TNPsu 19, TNPsu 22, CO (Samai)4, TNPsu 21, TNPsu 12, MS 4684, MS 1826, MS 110, MS 4700, TNPsu 27, MS 4784, MS 1236, TNPsu 9, TNPsu 28, MS 1003/1, MS 1211 and TNPsu 1/79
II 1 4 TNPsu 10, IPM 59,TNPsu 24/79, TNPsu 8/78
2 6 CO2, TNPsu 7, IPM 232, TNPsu 7/79, TNPsu 6, TNPsu 4
3 4 TNPsu35, TNPsu 31, TNPsu 15, TNPsu 3
4 16 PM 42, PM 307, IPM 221, PM 141, IPM 115, PM 410, PM 143, TNPsu 33, RPM8-1, TNPsu 34, TNPsu 32, IPM 221/A, MS 109, PM 295/1,PM 295,TNPsu 11
III 1 11 IPmr 861,IPmr 889, IPmr 884, IPM 226, IPmr 891, IPmr 1046, OLM 115, IPmr 1061, OLM 112, IPmr 862, TNPsu 26
2 1 PM 29
3 6 IPM 272, MS 3969, TNPsu18, CO 3, TNPsu 24, TNPsu 13
4 7 Paiyur 1, MS 4725, MS 115, TNPsu 30, RPM 11, PMR 762, TNPsu 5
5 3 MS 662, MS 4700/1, TNPsu 29
6 1 TNPsu 16/78
7 1 TNPsu 14
ISSN 0975-928X