ISSN 0975-928X
http://sites.google.com/site/ejplantbreeding Peer Reviewed Journal 392
Research Notes
D
2analysis of rice germplasm for some quantitative and quality traits
S. Vennila, Y. Anbuselvam and K. Palaniraja*
Faculty of Agriculture, Department of Genetics and Plant Breeding, Annamalai University, Annamalai Nagar – 608 002 India.
*Email: [email protected]
(Received:09 Aug 2011; Accepted:28 Aug 2011)
Abstract:
An investigation was carried out with 41 rice genotypes to identify diverse genotypes. They were evaluated for nine yield and yield attributing characters using Mahalanobis D2 statistics. The analysis of variance revealed significant differences
among the genotypes for all the characters studied. Based on the genetic distance all the 41 genotypes were grouped under thirteen different clusters. The mode of distribution of genotypes from different eco-regions into various clusters was at random indicating that geographical diversity and genetic diversity were not related. The maximum inter -cluster distance was recorded between clusters III and XIII and the maximum intra-cluster distance was found in cluster XI followed by VI. The characters like number of grains per panicle, plant height, grain length and grain breadth contributed maximum towards genetic diversity. Hence these characters could be given due importance for selection of genotypes for further crop improvement programme.
Key words: Rice, genetic diversity, germplasm.
Rice (Oryza sativa L.) is the prime food crop of the world for more than half of the global populations. India is the second largest producer and consumer of rice next to China. As the population is increasing alarmingly, it is projected that the demand of rice in 2025 A.D. would be 140mt as against the production of about 131.9 mt. Hence, in order to meet the indispensable demand, improvement through genetic manipulation is the only way. The success of breeding programme lies on the fact that the parents involved in any particular cross should be genetically divergent (Daniel, 2000). Even though self pollinated crops are highly homozygous there is every possibility of genetic variation among the parents collected from different eco-geographical regions. In the present study, an attempt was made to assess the genetic divergence using Mahalanobis D2 statistics and different clustering procedures, based on yield and quality characters and assessing the relative contribution of different components to total divergence. Genetic divergence among the genotypes plays an important role in the selection of parents having wider variability for different yield and quality characters (Sarawgi and Rita Binse, 2007)
The material taken for this study consisted of 41 rice genotypes from different rice eco-geographical regions of India. All the genotypes were grown in randomized block design with three replications
during 2008-2009. The seedlings were transplanted to main field 20cm apart between rows and 15cm within the row. Recommended agronomic practices and need based plant protection measures were taken up. Observations were recorded on nine traits including biometrical and quality characters viz.,
days to first flower, plant height, number of productive tillers per plant, number of grains per panicle, thousand grain weight, grain length, grain breadth, grain L/B ratio and grain yield per plant. Genetic diversity analysis was done following the D2 statistics proposed by Mahalanobis (1936).
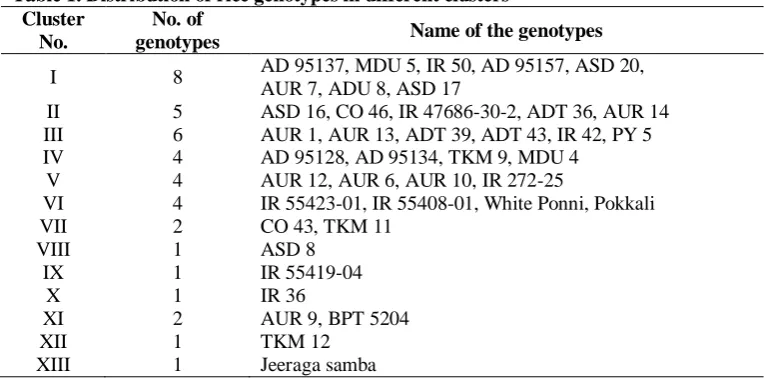
The analysis of variance revealed significant differences among the genotypes for all the characters indicating existence of variability among the genotypes for the characters studied. Based on the relative magnitude of D2 values, 41 genotypes were grouped into thirteen clusters (Table 1). The cluster I was the biggest consisting of 8 genotypes followed by 6 in cluster III, 5 in cluster II, 4 in clusters IV, V and VI, 2 in clusters VII and XI. The clustering pattern of genotypes revealed that there was no parallelism between clustering pattern and geographical distribution of genotypes. Similar results were observed by Vanaja et al. (2003) and Nayak et al. (2004).
http://sites.google.com/site/ejplantbreeding Peer Reviewed Journal 393 genotypes representing these clusters (Table 2).
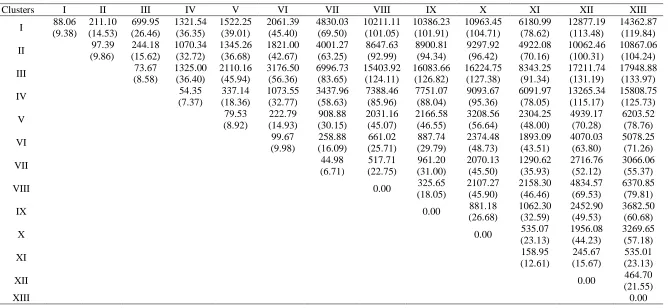
The clusters VIII, IX, X, XII, XIII (0.00) consisted of only one genotype hence, they lack intra -cluster distance (0.00). The relative divergence of each cluster from other cluster (inter-cluster distance) indicated greater divergence between cluster III and XIII (17948.88), followed by cluster III and XII (17211.74). The minimum inter-cluster distance was recorded between cluster I and II (211.10). The selection of divergent genotypes from above cluster would produce a broad spectrum of variability for yield and quality traits, which may enable further selection and genetic improvement.
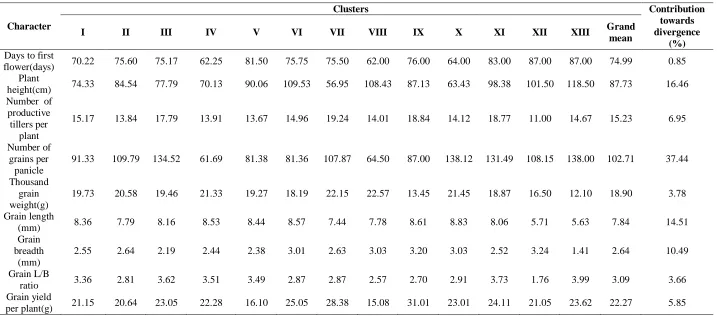
The average cluster wise mean values for different characters are presented in Table 3 which can be used to assess the superiority of clusters, which could be considered in the improvement of various characters through hybridization programme. Cluster VIII showed early flowering and desirable mean for thousand grain weight. Cluster VII recorded shortest plant stature with highest number of productive tillers per plant. Cluster X had the desirable mean for number of grains per panicle. Cluster IX exhibited superior mean performance for grain length and grain yield per plant. Cluster XIII showed the lowest grain breadth and highest value for grain L/B ratio.
Among the nine characters studied, number of grains per panicle contributed maximum of 37.44 per cent, followed by plant height (16.46 per cent), grain length (14.51 per cent), grain breadth (10.49 per cent) towards genetic diversity. Similar result was observed by Sandhyakishore et al., 2007. Hence, these characters could be given due importance for selection of genotypes for further improvement (Table 3).
References
Daniel, R.R. 2000. Future challenges in food production in India. Curr. Sci., 79(8): 1051-1053.
Mahalanobis, P.C. 1936. On the generalized distance in statistic. Proc. Nat. Inst. Soc., India. 2: 49-55. Nayak, A.R., Chaudhary, D. and Reddy, J.N. 2004.
Genetic divergence in scented rice. Oryza, 41(3&4): 79-82.
Sarawgi, A.K. and Rita Binse. 2007. Studies on genetic divergence of aromatic rice germplasm for agro-morphological and quality characters. Oryza, 44(1): 74-76.
Sandhyakishore, N., Ravindrababu, V., Ansari, N.A. and Ravichandran. 2007. Genetic divergence analysis using yield and quality traits in rice (Oryza sativa L.).Crop Improv., 34(1): 12-15. Vanaja, T., Babu, L.C., Radhakrishnan, V.V. and
ISSN 0975-928X
http://sites.google.com/site/ejplantbreeding Peer Reviewed Journal
394 Table 1. Distribution of rice genotypes in different clusters
Cluster No.
No. of
genotypes Name of the genotypes
I 8 AD 95137, MDU 5, IR 50, AD 95157, ASD 20, AUR 7, ADU 8, ASD 17
II 5 ASD 16, CO 46, IR 47686-30-2, ADT 36, AUR 14 III 6 AUR 1, AUR 13, ADT 39, ADT 43, IR 42, PY 5 IV 4 AD 95128, AD 95134, TKM 9, MDU 4
V 4 AUR 12, AUR 6, AUR 10, IR 272-25
VI 4 IR 55423-01, IR 55408-01, White Ponni, Pokkali VII 2 CO 43, TKM 11
VIII 1 ASD 8
IX 1 IR 55419-04
X 1 IR 36
XI 2 AUR 9, BPT 5204
XII 1 TKM 12
http://sites.google.com/site/ejplantbreeding Peer Reviewed Journal
395 Table 2. Average intra and inter cluster distance of various clusters in rice
Clusters I II III IV V VI VII VIII IX X XI XII XIII
I 88.06 (9.38) 211.10 (14.53) 699.95 (26.46) 1321.54 (36.35) 1522.25 (39.01) 2061.39 (45.40) 4830.03 (69.50) 10211.11 (101.05) 10386.23 (101.91) 10963.45 (104.71) 6180.99 (78.62) 12877.19 (113.48) 14362.87 (119.84)
II 97.39
(9.86) 244.18 (15.62) 1070.34 (32.72) 1345.26 (36.68) 1821.00 (42.67) 4001.27 (63.25) 8647.63 (92.99) 8900.81 (94.34) 9297.92 (96.42) 4922.08 (70.16) 10062.46 (100.31) 10867.06 (104.24)
III 73.67
(8.58) 1325.00 (36.40) 2110.16 (45.94) 3176.50 (56.36) 6996.73 (83.65) 15403.92 (124.11) 16083.66 (126.82) 16224.75 (127.38) 8343.25 (91.34) 17211.74 (131.19) 17948.88 (133.97)
IV 54.35
(7.37) 337.14 (18.36) 1073.55 (32.77) 3437.96 (58.63) 7388.46 (85.96) 7751.07 (88.04) 9093.67 (95.36) 6091.97 (78.05) 13265.34 (115.17) 15808.75 (125.73)
V 79.53
(8.92) 222.79 (14.93) 908.88 (30.15) 2031.16 (45.07) 2166.58 (46.55) 3208.56 (56.64) 2304.25 (48.00) 4939.17 (70.28) 6203.52 (78.76)
VI 99.67
(9.98) 258.88 (16.09) 661.02 (25.71) 887.74 (29.79) 2374.48 (48.73) 1893.09 (43.51) 4070.03 (63.80) 5078.25 (71.26)
VII 44.98
(6.71) 517.71 (22.75) 961.20 (31.00) 2070.13 (45.50) 1290.62 (35.93) 2716.76 (52.12) 3066.06 (55.37)
VIII 0.00 325.65
(18.05) 2107.27 (45.90) 2158.30 (46.46) 4834.57 (69.53) 6370.85 (79.81)
IX 0.00 881.18
(26.68) 1062.30 (32.59) 2452.90 (49.53) 3682.50 (60.68)
X 0.00 535.07
(23.13)
1956.08 (44.23)
3269.65 (57.18)
XI 158.95
(12.61)
245.67 (15.67)
535.01 (23.13)
XII 0.00 464.70
(21.55)
ISSN 0975-928X
http://sites.google.com/site/ejplantbreeding Peer Reviewed Journal
396 Table 3 . Cluster mean and contribution of various characters towards diversity in rice
Character
Clusters Contribution
towards divergence
(%) I II III IV V VI VII VIII IX X XI XII XIII Grand
mean
Days to first
flower(days) 70.22 75.60 75.17 62.25 81.50 75.75 75.50 62.00 76.00 64.00 83.00 87.00 87.00 74.99 0.85 Plant
height(cm) 74.33 84.54 77.79 70.13 90.06 109.53 56.95 108.43 87.13 63.43 98.38 101.50 118.50 87.73 16.46 Number of
productive tillers per
plant
15.17 13.84 17.79 13.91 13.67 14.96 19.24 14.01 18.84 14.12 18.77 11.00 14.67 15.23 6.95
Number of grains per
panicle
91.33 109.79 134.52 61.69 81.38 81.36 107.87 64.50 87.00 138.12 131.49 108.15 138.00 102.71 37.44
Thousand grain weight(g)
19.73 20.58 19.46 21.33 19.27 18.19 22.15 22.57 13.45 21.45 18.87 16.50 12.10 18.90 3.78
Grain length
(mm) 8.36 7.79 8.16 8.53 8.44 8.57 7.44 7.78 8.61 8.83 8.06 5.71 5.63 7.84 14.51 Grain
breadth (mm)
2.55 2.64 2.19 2.44 2.38 3.01 2.63 3.03 3.20 3.03 2.52 3.24 1.41 2.64 10.49
Grain L/B
ratio 3.36 2.81 3.62 3.51 3.49 2.87 2.87 2.57 2.70 2.91 3.73 1.76 3.99 3.09 3.66 Grain yield