Vol.7 (2017) No. 6
ISSN: 2088-5334
Bending Failure Analysis at HPFRC Plates with Various Depth and
Loading Program
Krisnamurti
#*, Agoes Soehardjono
*, Achfas Zacoeb
*, Ari Wibowo
* #Civil Engineering Department, Faculty of Engineering, University of Jember, Jember, 68121, Indonesia E-mail: [email protected]
*
Civil Engineering Department, Faculty of Engineering, University of Brawijaya, Malang, 65145, Indonesia E-mail: [email protected], [email protected], [email protected], [email protected]
Abstract— Load and plate geometry of the bridge structure have form and nature vary. In the finite element modeling, plate weight
and the load are converted to point load at the joint of the element. Research to describe plate failure is always carried out through analysis and testing in the laboratory. The aim of this research is to develop methods of analysis and testing High-Performance Fiber-Reinforced Concrete (HPFRC) plate in accordance with geometry and loading program so that the results of laboratory tests can approach the bending behavior of the actual plate element. Analysis carried out by the 2-D isoparametric finite element method, with the approach of plane strain condition. Variations performed on the supporting type, load pattern and the plate depth. Validation performed on plate specimen in the laboratory with a span length of 600 mm, width 300 mm and thickness vary from 30 mm up to 60 mm. HPFRC compressive strength is 93.045 MPa, and a splitting tensile strength is 6.018 MPa. Test performed with four-point bending pattern at a distance of 1/3 span length. Comparison results of analysis and laboratory test can be concluded that the failure of bending plate HPFRC can be described satisfactorily through finite element analysis.
Keywords— isoparametric element; bending behavior; high-performance fiber-reinforced concrete
I. INTRODUCTION
In the world of construction, concrete technology is increasing both in terms of quality and in terms of quantity. One of them is HPFRC implementation in the bridge structure. On the bridge structure, HPFRC has a major role as a beam or plate elements. A plate is a flat structural element for which the thickness is small compared with the surface dimensions.
Load and plate geometry of the bridge structure have form and nature vary. The tensile stress-strain response of an HPFRC dominates the performance under many loading conditions and applications [1]. In finite element modeling, plate weight and the load are converted to point load at the joint of the element. Plate’s bridge structure will receive a load from the material self-weight, the environmental load, and passing vehicles, according to the geometry of the structure and function. Bending moments occur in a member supported at the discrete point and subjected to loads that are transverse to the longitudinal axis of the member. Members, such as beams and plates, which are subjected to bending moments, will develop flexural cracks when the stresses in the tension zone exceed the bending strength of plain HPFRC [2].
Among the procedures applied in the determination of concrete strength under tension, both for research purposes and in routine tests, the most generally used is that based on testing the effect of bending on the square or rectangular specimen. However, when it comes to reproducing the true tensile strength value, for a certain given concrete class, this procedure is far from being accurate. The conventional strength to bending stresses is established with Navier’s expression (the hypothesis of the elastic body)
fcb = M/W = 6 M/bh2 (1)
The test specimen in plain concrete being bent by a concentrated load applied in the middle of the span. The tensile strength to bending value fcb is much higher than
either concrete tensile strength fct, as determined on test
specimen submitted to centric tensile stress, or concrete is splitting tensile strength fcs, as determined through splitting
HPFRC is a heterogeneous material made up of cement, aggregates, water, fiber, and superplasticizer. The response of unreinforced HPFRC to mechanical loading must be described to understand how the elements react [4]. The combined effects of different variables must be evaluated such as curing regime, aggregate type, steel fiber volume fraction, and w/b ratio on the mechanical properties of HPFRC [5]. In order to precisely analyze the response of HPFRC elements subjected to tension or flexure, a realistic tensile model including fiber bridging and matrix softening curves are required [6]. The behavior of HPFRC structures is distinctly nonlinear, because of several factors: (1) nonlinear material behavior of HPFRC; (2) cracking of HPFRC; and (3) time-dependent effects such as creep, shrinkage, temperature and load history. Fracture and Crack propagation in HPFRC depend on a large extent on the material properties in tension and the post-cracking behavior [7]. In the analysis of HPFRC plates structures, plane strain problems can be used in practical cases.
The aim of this research is to develop methods of analysis and testing High-Performance Fiber-Reinforced Concrete (HPFRC) plate in accordance with geometry and loading program so that the results of laboratory tests can approach the bending behavior of the actual plate elements.
II. MATERIAL AND METHOD
In this section, the finite element method and an experimental program will be discussed. The finite element method in this study used layered finite element procedures.
A. Finite Element Modeling
With reference to static structural problems, the systematic procedure of the finite element method can be stated as follows: 1) Divide structure into discrete elements. 2) Select a proper interpolation or displacement model. 3) Derive element stiffness matrices and load vectors. 4) Assemble element equations to obtain the overall equilibrium equations. 5) Solve for the unknown nodal displacements. 6) Compute element strains and stresses [8].
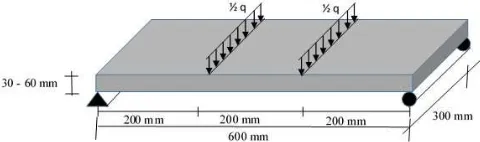
The HPFRC specimen plate test with 600 mm pure test length span and 300 mm wide was modeled as shown in Fig. 1. The thickness of HPFRC plates has a variable depth of 30 mm to 60 mm. The developed FEM was run for identical data. In the 2D-isoparametric element model of the FEM, the cross-section of HPFRC plate meshed into 60 HPFRC isoparametric elements: 12 in the direction of the X-axes, 5 in the direction of the Y-axes. Every 12 elements in the direction of X-axes is a group of 1 mesh layer. The mesh configuration for the 2-dimensional isoparametric element of HPFRC plate is shown in Fig. 2, and the load-deflection was calculated at mid-span.
Fig. 1 Geometry, loading and supporting of a numerical and experimental model of HPFRC plates.
Fig. 2 Finite element idealization of HPFRC plate
Layered finite element procedure has been used by engineering expert for analysis of concrete beams and slabs. Scanlon and Murray [9] have used layered rectangular slab elements, which could be cracked layer progressively by layer and assumed that cracks propagate only parallel and perpendicular to orthogonal reinforcement. Kwak and Filippou [7] using the layered finite element to describe the behavior of the composite reinforced concrete material. Sezer and Tekin [4] used a layered composite material model (LCMM) in the nonlinear finite element analysis of reinforced concrete plates under incremental loading up to failure load. Oliveira et al. [10] used a layered finite element for analysis of reinforced concrete beam with bond-slip effects. Zaidir [11] using finite layer element method in order to investigate the pre-cracked reinforced concrete beams repaired with sealant injection method to evaluate the flexural and shear capacity of the repaired beams.
Several other researchers used finite element methods for different research purposes and laboratory specimens. Genikomsou & Polak [12] used nonlinear finite element analysis to investigate the failure modes of reinforced concrete slab-column connections under static and pseudo-dynamic loadings in terms of ultimate load and cracking patterns. Tysman et al. [13] presented an adaptation of the Concrete Damaged Plasticity (CDP) model, based on uniaxial tensile test data, for the numerical simulation of high-performance fibre-reinforced cement composites and their inherent nonlinear behavior including strain hardening. Roundi & Elgharad [14] investigated the fatigue behavior of the aluminum alloy 6082 by a finite element analysis (FEA). The tests are released for various specimens subjected to cyclic tensile loading in order to characterize the damage evolution and the fatigue strength of the aluminum alloy 6082.
Fig. 3 Loading program arrangement of HPFRC plates
For stress combinations inside the initial yield surface, HPFRC plate is assumed to be homogeneous, linear isotropic material. The stress-strain relation for plane strain problems has the simple form [7]:
1
0
1
0
0
0
where E is the modulus of elasticity (Young’s) of HPFRC and ν is Poisson's ratio. The relationships for principal stresses in two dimensions are:
!"
#
$%!"
#
$&'At the beginning of the analysis, all mesh layers are assumed to be uncracked. The elastic constants take the values for plane HPFRC, in which case, δ = 1, so the elastic constants δE = 38,925 MPa and the material may be considered to be isotropic. At a subsequent stage in the iterative procedure, the principal stresses σ1 and σ2 are computed for the layer using elastic constants associated with the δ established in the previous cycle. The principal stresses are compared with the limiting tensile stress σTi corresponding to δ = i. If the limiting tensile stress σTi is exceeded by either σ1 and σ2, the constitutive relations for the mesh layer are modified to reflect the reduced stiffness due to cracking [9]. Cracks that occur in the plate will reduce the effective height of the cross-section and further decreases the section’s moment of inertia (I) [15]. However, after cracking the overall stiffness is reduced because of the inability of the concrete to transfer tensile stresses across a crack. For each iteration cycle, the elastic constants are examined in each mesh layer of each element. The correct cracked configuration is attained when no further modification of elastic constants takes place [9].
B. Experimental Program
Bending test performed on a simple supported HPFRC plate specimen with 600 mm span length, 300 mm wide and variation of depth are 30 mm to 60 mm. Loading program no. 4 as shown in Fig. 3 is used in the four-point bending plate with a distance of workload is 1/3 of span plate. Fine sand from Mount Semeru and gravel-crushed stone with a
diameter less than 10 mm are used to make HPFRC material. Master Glenium SKY 8851 is used as superplasticizer. The wire used as a fiber because it has a measured tensile strength of testing according to the results of Aulia [16] research. Adding fibers to concrete matrix has been long recognized as a way to enhance the energy absorption capacity and crack resistance of the plain concrete [17].
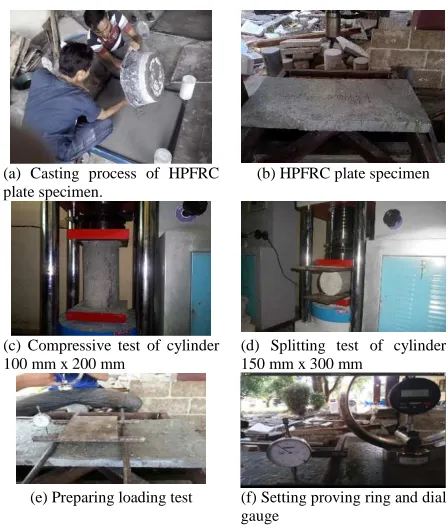
After several mix design testing of HPFRC, the material in this study consist of material constituent with the composition of weighing cement material: 1 cement: 0.1 silica fume: 0.1 Silica powder: 0.7 sand and gravel: 0.4 water: 0.22 superplasticizer: 0.15 tie wire. Three pieces of HPRFC plate specimen are made for each thickness. Every mixing process, one HPFRC cylinder with diameter 100 mm x 200 mm also made for testing compressive strength as shown in Fig. 4(c) in accordance with the results of research Graybeal [18] and Habel [19] for high-performance concrete, and one cylinder diameter 150 mm x 300 mm for testing the tensile strength as shown in Fig. 4(d).
The average cylinder compressive strength was about 93.045 MPa, and tensile strength dimpled 6.018 MPa. The average modulus of elasticity was about 38,925 MPa. Modulus of elasticity HPFRC calculated by the equation:
( 3320 +,-′ 6900 123
according to the ACI 363R equation as studied in the research of Graybeal [20] and Noguchi [21]. E and fc’ in
MPa. In this model, the loads applied were increased simultaneously by displacement control at the upper middle point of the plate.
III.RESULTS AND DISCUSSION
In the analysis of the HPFRC plate by the finite element method, the amount of elastic constant value δE, which was used for each value of the principal stresses, can be shown in
(a) Casting process of HPFRC plate specimen.
(b) HPFRC plate specimen
(c) Compressive test of cylinder 100 mm x 200 mm
(d) Splitting test of cylinder 150 mm x 300 mm
(e) Preparing loading test (f) Setting proving ring and dial gauge
Fig. 4 Preparing and testing HPFRC cylinder and plates P
l
Loading Program 1 Loading Program 2 Loading Program 3
Loading Program 4 Loading Program 5
½ P
1/6 l
½ P
l
½ P
1/4 l
½ P
l
½ P
1/3 l
½ P
l
½ P
1/2 l
½ P
l
(2)
(3)
(4)
Table 1. Decrease elastic constants performed on each element in accordance with its mesh layer. At the time of the principal stresses has exceeded tensile strength with values 6.018 MPa, the value of the elastic constants will be constant. The calculation of the analysis was stopped after the maximum load is reached or the stress value in the 5th mesh layer approaches the maximum compressive stress corresponding to experimental results, namely 93.045 MPa.
A. Effect of Plate Supported Type
The influence of the plate-supported type was shown by analyzing the behavior of the plate, which supported by pinned supported and the plate with pinned-rollers supported. Plate elements that are using both of pinned supported or pinned-rollers supported types were commonly referred as the simply supported plate. A pin support only transfers loads in two orthogonal directions, typically X and Y coordinates. A roller support only transmits loads in one direction, typically Y-axis. The plate thicknesses are 50 mm, and the arrangement of each load ½ P is at a distance of 1/3 span in the middle of the plate.
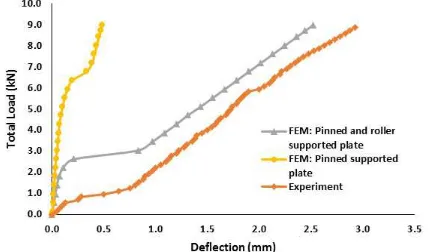
Plates with pinned supported indicate the smaller deflection than the plates with pinned-rollers supported as shown in Fig. 5. The deflection that occurs at the plate with pinned supported only reached a value of 0.194 mm for the total load of 6.361 kN. After that, the deflection raises to 0.480 mm when the total load is 8.988 kN. The different results occurred on a plate with pinned-rollers supported. When the total load is 2.627 kN, the deflection value is 0.209 mm. After that, with a small increase in the total load, large deflection occurs until reaching a value of 0.828 mm when the total load increases up to 3.042 KN. The addition of a total load of up to 8.988 KN cause deflection enlarged to collapse in the deflection value of 2.518 mm. Deflection of the plate with pinned supported at both end only 19% of the deflection at the plate with pinned-rollers supported. This means the rigidity of plate with pinned supported at the end of the plate is higher. However, when compared with the results of laboratory testing with a maximum total load of 8.850 kN and a deflection that occurred was 2.930 mm, it appears that the behavior of the actual plate is more appropriate when performed analyzed plate with joint support-roller types.
Similarly, the principal stresses which occur in each mesh layer on a pinned supported plate showed a smaller value as shown in the Fig. 6 when compared with a plate which supported by pinned-rollers in Fig. 11. On the tensile layer,
plates have reached the tensile failure state when the principal stress value reaches 6.018 MPa. The compressive, flexural failure occurs when the principal stress reaches the approximate value of 93.045 MPa. The results of the analysis HPFRC with pinned supported at both ends only reached the principal compressive stress value of -11.206 MPa when the total load is 8.988 kN. HPFRC plate with pinned-rollers supported can reach the principal compressive stress value of -60.528 MPa when a total load is 8.988 kN. This means the results of the analysis of the pinned-rollers supported type closer to the experimental test results.
Fig. 5 Load-deflection correlation of HPFRC plate with different supported type
Correlation of principal stress and the total load in Fig. 6 shows the non-linear behavior that occurs in each mesh layer of HPFRC plates with pinned supported at both ends. Non-linear behavior started since the total load is increased until 6.361 kN with the principal stress of the plates layer with pinned supported type is from the 1st layer to the 4th layer have the tensile stress value of 11.882 MPa, 7.390 MPa, 7.387 MPa, 5.518 MPa and compressive stress value at the 5th layer of -4.526 MPa. Furthermore, the bending behavior will turn to linear when the total load is 7.190 kN with a tensile stress in the 1st layer until a 4th layer is 23.497 MPa, 14.627 MPa, 14.630 MPa, 10.931 MPa and the compressive stress is -8.964 MPa at the 5th layer. This linear behavior will end when total load reached 8.988 kN with principal tensile stress in the 1st layer until a 4th layer is 29.397 MPa, 18.285 MPa, 18.288 MPa, 13.665 MPa, and the principal compressive stress at the 5th layer is -11.206 MPa. This condition shows that the flexural failure is not reached when HPFRC plate is analyzed using the assumption of pinned supported type at both ends of the plate.
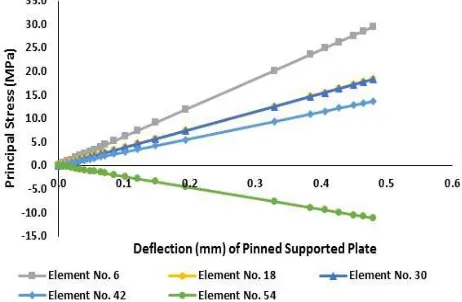
Fig. 6 Stress-load correlation at the mesh layer of pinned supported HPFRC plate
TABLEI
REDUCING VALUE OF ELASTIC CONSTANTS ACCORDING TO
PRINCIPAL STRESS FOR MESH LAYER
No.
Principal Stress (MPa)
Elastic Constants δδδδE (MPa) of Plate Depth
60 mm 50 mm 40 mm 30 mm
1 0.000 38,925 38,925 38,925 38,925
2 1.018 32,525 32,525 32,525 32,525
3 2.018 26,125 26,125 26,125 26,125
4 3.018 19,725 19,725 19,725 19,725
5 4.018 13,325 13,325 13,325 13,325
6 5.018 6,925 6,925 6,925 6,925
Unlike the correlation of principal stress and total load, the correlation between the principal stresses and the deflection caused by loading on both of the plate supporting type shows a linear type. Each increased deflection, then there is also an increase in principal stresses. This shown in Fig. 7 and Fig. 10. In Figure 7, when the deflection is 0.480 mm, the principal tensile stress value in the 1st layer until the 4th layer of HPFRC plates with pinned supported at both ends are 29.397 MPa, 18.285 MPa, 18.288 MPa, 13.665 MPa, and the principal compressive stress value is -11.206 MPa for the 5th layer.
Fig. 7 Stress-deflection correlation at the mesh layer of pinned supported HPFRC plate
B. Effect of Loading Program Variation
The effect of variation loading program conducted by using a loading arrangement as shown in Fig. 3. The analysis was performed on the plate with a thickness of 50 mm and pinned-rollers supported. Plain HPFRC members loaded to bending always collapse through cracking which takes place within the tensile zone and develops elastoplastic strains in the loading stage next to fracture; the compressed concrete has an elastic behavior till fracture since stresses developed within its mass is low [3]. As a result of the cracking process, there was a nonlinear behavior in the load-deflection correlation of HPFRC plates with a thickness of 50 mm as shown in Fig. 8 and the stress-load correlation in Fig. 9.
For the same span and cross-sectional dimension, both of the experimental results and the analysis results show that the behavior of flexural cracks that occur on the HPFRC plates also depends on the loading arrangement. The influence of the loading arrangement on the HPFRC plate model that analyzed can be arranged in the form of coefficients as shown in Table 2.
TABLEII
COMPARISON EFFECT OF LOADING ARRANGEMENT ON THE TENSILE
STRESS OF A LOADED HPFRC PLATES MODEL
Loading Program 1
Loading Program 2
Loading Program 3
Loading Program 4
Loading Program 5
1.00 0.95 0.90 0.80 0.66
Fig. 10 shows a stress-deflection correlation of the HPFRC plates due to the loading program no. 4 with the pinned-rollers supported. Increased deflection which happens will be proportional to the increased stress that
occurs. When deflection reached 2.518 mm, the principal tensile stress has exceeded the value of 93.045 MPa for the 1st mesh layer until 3rd mesh layer, and the value of 71.378 MPa for the 4th mesh layer and the principal compressive stress of -60.528 MPa for the 5th mesh layer.
Fig. 8 Load-deflection correlation of HPFRC plates with different loading program
Fig. 9 Load-stress correlation of HPFRC plates with different loading program
Fig. 10 Stress-deflection correlation at the mesh layer of HPFRC plate with loading program no. 4
tensile stress at the plate with pinned supported at the 1st layer until the 5th layer is 6.382 MPa, 3.948 MPa, 3.949 MPa, 2.966 MPa, and the principal compressive stress is -2.494 MPa. Furthermore, the bending behavior will transform to a linear when the total load is 3.042 kN with a principal tensile stress at the 1st layer until the 4th layer is 11.887 MPa, 7.353 MPa, 7.356 MPa, 5.529 MPa, and a principal compressive stress at the 5th layer is -4.664 MPa. This linear behavior will end when the total load reached 8.988 kN with a principal tensile stress on each mesh layer of the 1st layer until the 4th layer is 93.045 MPa, 76.133 MPa, 76.203 MPa, 57.377 MPa, and a principal compressive stress of the 5th layer is reached -48.725 MPa. The magnitude of the principal stress is shown that the flexural failure of HPFRC plates can be achieved if the plate is analyzed using pinned-rollers supported type.
Fig. 11 Stress-load correlation at the mesh layer of HPFRC plate with loading program No. 4
C. The Plate Depth Variation
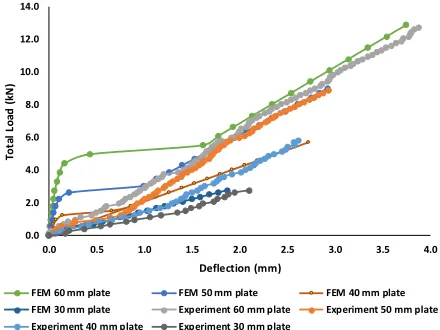
Plate thickness variation is analyzed and tested using the loading program no. 4, with a load of ½ P, placed separately at a distance of 1/3 of the plate span. Analysis and testing carried out on HPFRC plates with a thickness of 30 mm to 60 mm. The cracks pattern that occurs on each plate thickness can be shown in Fig. 12. Refer to cracking that occurs at the midspan of all HPFRC plate thickness, this indicates the flexural failure occurs. While the load-displacement correlation that occurs on each plate as well as on the analysis results or on the experimental results can be seen in Fig. 13. The diagram is shown that plates with a thickness of 30 mm are able to restrain loads up to 2.765 kN when deflection reaches 1.872 mm. Plates with a thickness of 40 mm collapsed when the load reaches 5.669 kN, and the deflection is 2.721 mm. Plates with a thickness of 50 mm collapse when the load is 8.988 kN and the deflection is 2.927 mm. And plates with a thickness of 60 mm collapsed when the load reaches 12.859 kN, and the deflection is 3.745 mm. It can be seen, changes in the plate geometry in the form of an increase in slab thickness affect the ability of high-performance fiber-reinforced concrete slab in receiving load and deflection.
HPFRC plates show non-linear behavior for the correlation of stress and total load as shown in Fig. 6, Fig. 9 and Fig. 11. Similarly, the correlation between total load and deflection also show the non-linear behavior as shown in Fig. 5, Fig. 8 and Fig. 13. For the same loading arrangement (for instance, a force concentrated separately with a distance of
1/3 span length in the middle of the plate) and the same shape of the cross-section (in this study, rectangular), the breakdown of the HPFRC tensile zone is also a function of the cross-sectional size, and the thickness of HPFRC Plate, in particular.
The results of the analysis and experiments on the HPFRC plate specimen indicates that changes in the plate thickness, loading programs, and supported type have a significant impact on the behavior of HPFRC plate while receiving the workload. The changes of plate thickness will impact directly on the rigidity of HPFRC plate. This can occur because of changes in the thickness variables of the HPFRC plates will change the section’s moment of inertia of the plate by the equation I = bh3. Thus the rigidity of HPFRC plates also change.
Fig. 13 Load-deflection correlation of HPFRC plate with different plate thickness
The changes of the supported type will change the HPFRC plate ability to withstand the workload, which looks at the value of the principal stresses. The configuration of loading program also gives effect to the flexural deflection value and tensile stress of HPFRC plates. This is happened because of the deformation changing due to flexural and shear. For the loading program with the three-point bending
0.0 2.0 4.0 6.0 8.0 10.0 12.0 14.0
0.0 0.5 1.0 1.5 2.0 2.5 3.0 3.5 4.0
T
o
ta
l
L
o
a
d
(
k
N
)
Deflection (mm)
FEM 60 mm plate FEM 50 mm plate FEM 40 mm plate
FEM 30 mm plate Experiment 60 mm plate Experiment 50 mm plate
Experiment 40 mm plate Experiment 30 mm plate
(a) Plate of 30 mm depth (b) Plate of 40 mm depth
(c) Plate of 50 mm depth (d) Plate of 60 mm depth
analysis, the entire deformation of HPFRC plates is caused by bending of the plates. For the loading program with the four-point bending, the greater of the distance between each of the workload will cause the deformation be smaller. From the configuration of loading can be shown comparison effect of loading arrangement to the tensile stress of the HPFRC plate’s models.
IV.CONCLUSIONS
In this study, nonlinear finite-element modeling procedure of HPFRC plates is presented. It is assumed that the behavior of HPFRC plates can be described by a plane strain field. HPFRC is assumed as an isotropic linear elastic material at the stress or strain states which lie inside the initial yield surface. For the same load arrangement, the thickness of the plate will give effect to the behavior of the HPFRC plate bending failure. Likewise, for the same plate dimensions, loading arrangement will have an impact on the behavior of the HPFRC plate bending failure. The results of the calculations in the modeling with the 2-D isoparametric finite element method shows that modeling by utilizing impairment elastic constants and the effects of cracks in each layer mesh HPFRC plate can be used to analyze the relationship between the load-deflection of HPFRC plate subjected to monotonic loading. Comparison results of analysis and laboratory test can be concluded that the failure of bending plate HPFRC can be described satisfactorily through finite element analysis.
NOMENCLATURE
E modulus of elasticity MPa
I moment of inertia mm4
M bending moment N-mm
P concentrated workload N
W section modulus mm3
b cross-section width mm
fcb tensile strength to bending MPa
fc’ concrete compressive strength MPa
fct concrete tensile strength MPa
fcs concrete splitting tensile strength MPa
h cross-section height mm
l specimen span length mm
Greek letters
δ memory function for cracking analysis
εx, εy the normal strain
γxy the shear strain
σ1, σ2 principal stresses MPa
σTi limiting tensile stress in the branch i of the stepped stress-strain diagram
MPa
σx, σy the normal stresses MPa
τxy the shear stress MPa
ν Poisson's ratio Subscripts
1, 2 the direction of axes of orthotropy
b bending
c concrete or compression
t tension
ACKNOWLEDGMENT
This research can be established with a grant program of BPPDN University of Brawijaya, Malang, Indonesia, for programming process and the research grant program of The Ministry of Research, Technology and Higher Education of the Republic of Indonesia at the University of Jember for a laboratory experiment.
REFERENCES
[1] B. Mobasher, M. Bakhshi, and C. Barsby, “Backcalculation of residual tensile strength of regular and high-performance fiber reinforced concrete from flexural tests,” Construction and Building Materials, vol. 70, pp. 243-253, 2014.
[2] N. J. Carino and J. R. Clifton, “Prediction of Cracking in Reinforced Concrete Structures,” Gaithersburg, 1995.
[3] C. Avram, I. Facaoaru, O. Mirsu, I. Filimon and I. Tertea, Concrete Strength and Strains, Developments in Civil Engineering, vol. 3, Amsterdam: Elsevier Scientific Publishing Company, 1981, pp. 255-268.
[4] R. Sezer and M. D. Tekin, “Nonlinear Finite Element Analysis of Reinforced Concrete Plates Modeled by Layered Composites,” Scientific Research and Essays, vol. Vol. 6, no. 15, pp. 3281-3289, 2011.
[5] M. M. Tufekci and A. Gokce, “Development of heavyweight high-performance fiber reinforced cementitious composites (HPFRCC) - Part I: Mechanical properties,” Construction and Building Materials, vol. 148, pp. 559-570, 2017.
[6] D. Y. Yoo, N. Banthia, and Y. S. Yoo, “Predicting the flexural behavior of ultra-high-performance,” Cement and Concrete Composites, pp. 1-39, 2016.
[7] H. G. Kwak and F. C. Filippou, “Finite Element Analysis of Reinforced Concrete Structures under Monotonic Loads,” Berkeley, California, 1990.
[8] S. S. Rao, The Finite Element Method in Engineering, 5th ed., Butterworth-Heinemann, Burlington: Elsevier Inc, 2011, pp. 119-156. [9] A. Scanlon and D. W. Murray, “Time-dependent deflections of
reinforced concrete slabs,” National Research Council of Canada NRC-A5307, Edmonton, Canada, 1971.
[10] R. S. Oliveira, M. A. Ramalho, and M. R. Correa, “A Layered Finite Element for Reinforced Concrete Beams with Bond-Slip Effects,” Cement & Concrete Composites, no. 30, pp. 245-252, 2008. [11] Zaidir, R. Thamrin, and E. Dalmantias, “Evaluation of the
Pre-Cracked RC Beams Repaired with Sealant Injection Method,” International Journal on Advanced Science Engineering Information Technology, vol. 7, no. 2, pp. 380-386, 2017.
[12] A. S. Genikomsou and M. A. Polak, “Finite element analysis of punching shear of concrete slabs using damaged plasticity model in ABAQUS,” Engineering Structures, vol. 98, pp. 38-48, 2015. [13] T. Tysmans, M. Wozniak, O. Remy, and J. Vantomme, “Finite
element modeling of the biaxial behavior of high-performance fiber reinforced cement composites (HPFRCC) using Concrete Damage Plasticity,” Finite Elements in Analysis and Design, vol. 100, pp. 47-53, 2015.
[14] W. Roundi and A. Elgharad, “Assessment of Fatigue Behavior and Effects of Crack Growth in Aluminium Alloys 6082 under Various Stress Ratios,” International Journal on Advanced Science Engineering Information Technology, vol. 6, no. 5, pp. 582-587, 2016.
[15] S. Tudjono, A. S. Pamungkas and H. A. Lie, “Modelling The Relationship of The Flexural Rigidity Factor and Reinforcement Ratio by Numerical Simulation,” in Procedia Engineering, 2014. [16] T. B. Aulia and Rinaldi, “Bending capacity analysis of high-strength
reinforced concrete beams using environmentally friendly synthetic fiber composites,” in The 5th International Conference of Euro Asia Civil Engineering Forum (EACEF-5), 2015.
[17] G. Ferro, J. Tulliani, P. Jagdale and L. Restuccia, “New Concepts for Next Generation of High-Performance Concretes,” Procedia Materials Science, vol. 3, pp. 1760-1766, 2014.
[19] K. Habel, M. Viviani, E. Denarie and E. Bruhwiler, “Development of the Mechanical Properties of an Ultra-High Performance Fiber Reinforced Concrete (UHPFRC),” Cement and Concrete Research, vol. 36, pp. 1362-1370, 2006.
[20] B. Graybeal, “Compressive Behavior of Ultra-High-Performance Fiber-Reinforced Concrete,” ACI Materials Journal, 2007.