THE HOUSEHOLD BUDGET SURVEY DATA TELL US?
Danijel NESTIÆ DSc Article*
Institute of Economics, Zagreb UDC 330.56(497.5)
JEL D31
Abstract
The paper analyses income distribution in Croatia using the Household Budget Survey data. The results point to a mild increase in inequality during the 1998-2002 period. A non-linear increase in pensions in 2001 in favour of the better-off households has contributed to the rising inequality. In the meantime, other social transfers have become better targeted towards the poor suppressing overall inequality increase. Wages and salaries have become increasingly important and more unequally distributed sources of income. The income share of the poorest decile has shrunk due to its lower share in wages and pensions. The paper concludes with a proposal for introducing a panel survey of households in order to improve monitoring of poverty and inequality.
Key words: income distribution, inequality, Croatia
1. Introduction
Research on the distribution of income, especially that based on quantitative indi-cators, was highly neglected in Croatia right up until the end of the 1990s. Instead, judgements on income inequality were founded on a subjective feeling, or on simple sta-tistical comparisons made by a few authors. One of the causes for this state of affairs was the absence of appropriate statistical data, primarily those relating to the distribu-tion of total income and those capable of representing the whole populadistribu-tion. However, in 1998 the Croatian Bureau of Statistics (CBS/DZS) started the regular administration of the Household Budget Survey, thus collecting information about overall income and
various forms of household expenditure. This survey became the main source of infor-mation for calculations of inequality and poverty in Croatia (e.g, World Bank, 2000; Nestiæ, 2003; DZS, 2004).
The Household Budget Survey [the Survey] is a basically suitable and the only rel-evant source of data for the analysis of total income in Croatia. Hence this paper will show the basic features of the distribution of income in the 1998-2002 period. The dis-tribution is analysed in terms of income per household member according to grouped CBS data on the distribution by deciles.
The paper is structured in the following way. After the introduction, Section 2 consid-ers the basic statistical data about income that can be extracted from the Household Budget Survey. Section 3 shows changes in the structure of household income and presents calcu-lations of income inequality. The contribution of individual components of income to total inequality is also derived, and attention is drawn to the trends in the last few years. The fourth part of the paper shows the main determinants of the distribution of incomes across decile groups. In Section 5, income shares of the poorest households regarding different types of income are considered, particularly those connected with government transfers. The sixth part contains a summary of the main findings and a proposal for the improvement of the statistical sources for the monitoring of inequality and poverty in Croatia.
2. Household Budget Survey - basic data on income
This paper used the working tables of the CBS concerning the distribution of house-hold income by decile group. The distribution is analysed in terms of the average income per household member in the 1998-2002 period analysed (DZS 1998; 1999; 2000; 2001; 2002). These data are not yet officially released, since the CBS prefers to publish data related to the distribution of total household income (DZS, 2003a), or the distribution of income per equivalent adult member (DZS, 2004). In this paper we slightly modify the scope of income as compared with the official statistical coverage so as to make income comparable over the whole of the period under observation or to make income definition more in line with international practice (e.g., financing items such as revenues from the sale of assets or loans are excluded from income aggregate). All the calculations are made upon the available grouped data, and not according to indi-vidual survey data. Irrespective of these modifications of original CBS data, we believe that the analysis based on them provide useful information concerning the main features of the distribution of income in Croatia.
mem-ber (income per capita). In other words, each household is characterised by amount of income per capita, and all the statistical data prepared and distribution analysis refer to income so defined.
Table 1, in the upper part, shows trends in average income per household member in the period 1998-2002 according to data from the Household Budget Survey (HBS). Average income per member rises in the whole of the period under observation (except in 2001) and in 2002 came to something over 21,000 kuna per year, or about 1,750 kuna per month. As against 1998, the average income per member was about 18% higher. However, if the rise in income is corrected by the rate of inflation (or, more accurately, by the rise in the cost of living index) then it appears that rise in real income was much less. Thus in 2002 the average income per household member was in real terms only slightly higher than in 1998. Oscillations in real income from year to year were impor-tant, with a particularly marked fall in 2001.
The trends in average income calculated according to the HBS differ notably from the trends of similar indices of well being taken from other data sources. The lower part of Table 1 gives data concerning changes of the level of real household consumption pursuant to data from the national accounts that are used in the calculation of GDP. Although the aggregate of consumption is different from that of income, it can be expected that during a period of several years we can observe similar trends in both aggregates. However, household consumption according to data from the national accounts shows a constant rise after 1999, while the average real income calculated from the HBS shows major oscillations and a much lower level in comparison with 1998 than is the case with consumption. The fact that in one case the total (consumption) is being considered, and in the other in an average (income) should not have significant influ-ence on the result, considering the stability of the population size in Croatia during the past few years.
Table 1 Household income 1998-2002
1998 1999 2000 2001 2002
Household income (HBS)
Average income per member,
per year (kuna) 18,085 19,585 21,403 20,384 21,294
Nominal income
per member (1998=100) 100.0 108.3 118.3 112.7 117.7
Real income
per member (1998=100) 100.0 104.6 108.6 98.7 101.2
Other indicators of well being
Volume/scope of real household
consumption (1998=100) 100.0 97.1 101.2 105.8 112.8
Average real net wage (1998=100) 100.0 110.1 113.9 115.7 119.2
Note: Household income in the HBS does not include imputed housing rent. The scope of income is slightly modified as compared with the official scope used by the CBS so as to make the data comparable in the whole of the period under observation.
Experience from many other countries shows that data from household budget and expenditure surveys display a substantially lower rise in income and expenditure than data from the national accounts, particularly in developing countries, so that the differ-ence noted for Croatia is not untypical. Often such a differdiffer-ence is attributed to the eva-sion of answers concerning incomes from the grey economy, the underreporting of con-sumption that is not considered socially acceptable (alcohol, tobacco, betting) or failure to comprehend the highest incomes, which often rise the fastest in the take-off phase of developing countries.
The trend in income calculated on the basis of the HBS can be compared with the trend in a similar indicator – average real net wages, the indices of which are shown in the bottom part of Table 1. Wages constitute the major part of total income, so that it is to be expected that there will be a high degree of correlation with the trend in overall income. However, the average real wage, according to CBS statistics from establish-ment surveys, shows a very dynamic year-by-year rise. In 2002 it was 20% higher than in 1998, while at the same time data about real income according to the HBS showed a level almost unchanged from 1998. The fact that in the meantime there was a slight fall in employment in legal entities (enterprises), of about 1%, does not have any substantial impact on the discrepancies in the trends observed.
How can such different results be explained? First of all, it could be mentioned that the HBS was carried out in a time when it was objectively difficult to ensure a high degree of representativeness because of uncertainties related to the size of population. At the end of the 1990s, when the first surveys were administered, the population data necessary for suitable sampling procedure could only be found in the censuses of 1991. Unfortunately, that census could hardly provide an accurate picture of the population in late 1990s considering the turbulent times and great migrations of population. The sam-ple frame for the first surveys, those of 1998 and 1999, was based on the census of 1991, but supplemented with a separate, specially designed, pre-census of occupied dwellings in selected areas. In 2000 a change occurred in the sample frame for the HBS, which was that year and on the following years based on the register of the Croatian Electricity Company about electricity meters. Since almost all households in Croatia are supplied with electricity, it was considered that this register could be used as the frame for the selection of the sample. From 2002 onwards the sample frame has been based on the 2001 census. Apart from changes in the sample frame, during the period in which the survey was carried out there were changes in the questionnaires, as well as in the calcu-lation of the statistical weights. Then the very nature of the sampling in the HBS, where the sample of private households in each year is separately defined (i.e., there is no over-lap in the sample from year to year), increases the instability of the results if they are observed year by year.
of the paper will consider data for each other (even) year, for 1998, 2000 and 2002, and compared with the situation in pre-transitional 1988.1
3. Income composition and income inequality
Changes in the structure of household income in Croatia reflect fairly well a time of vigorous economic changes in the last fifteen years, which can be seen from the data presented in Table 2. Just before the beginning of the transition, 1988, wages made up about 55% of total household income; pensions, and other government transfers made up 14%; while income from self-employed work and income in kind made up 12% of total income. Ten years later wages made up a much smaller part of total income; a fall of ten percentage points having occurred. At the same time the proportion of pensions and social transfers had increased by the same amount. Such trends in the1988-1998 period can be linked with a reduction in the rate of employment, the ageing of the pop-ulation and the increase in the pension and welfare rights related to the Homeland War. The welfare role of the state clearly remained very strong even after the collapse of the socialist system, with the proviso that it was shifted from the labour market (that is, from the maintenance of over-employment in the socialist firms) to the sphere of retirement and social policy. Income in kind as proportion of total income was reduced, which is an expected consequence of the strengthening of the market economy. And the increase in the proportion of income from self-employment by about 3 percentage points could be attributed to the same cause.
Table 2 Income composition and income inequality
1988 1998 2000 2002
Household income (share in %)
Wages 55.1 45.3 51.2 50.6
Self-employment income 11.5 14.5 12.5 13.7
Pensions and government transfers 13.9 24.0 24.5 27.4
Other monetary income 7.6 8.7 6.7 3.7
Income in kind 11.9 7.5 5.1 4.7
Inequality indices
Gini coefficient 0.276 0.290 0.298 0.298
Theil entropy index 0.137 0.146 0.156 0.154
Decile ratio d9/d1 – 3.64 4.01 4.09
Note: The distribution of income per member of the household is considered. Income does not include imputed housing rent. Definition and classification of income is slightly modified from what is officially used by the CBS so that the data should be comparable in the period under observation. Income from self-employment includes money income of individual farmers, craftsmen and free-lances, while the value of consumption of goods from own land is included in income in kind. See more about the scope of income in the text (Chapter 2).
Source: Author’s estimates based on SZS (1990) and DZS (1998; 2000; 2002).
1This decision is made also because of the lack of appropriate information about distribution of income per
From 1998 to 2002 a rise in the income share of wages was noticeable, as well as a further rise in the income share of pensions. This could be related to the progress in the transition towards market economy where work efforts are rewarded more strongly than in previous socialist economy. However, income from self-employment did not increase its share, but in 2002 amounted to a smaller proportion than in 1998. This can be attrib-uted to a decline in small individual farming, but also to the increased competition that unincorporated sector had to meet, both from imports and from the domestic sector of firms. The rise in the share of pensions, particularly between 2000 and 2003 is mostly to be connected with the rise in pensions in 2001 according to the Increase in Pensions for the Sake of Obviating Differences in the Level of Pensions Disbursed in Different Periods Law (NN, 127/00). The proportion of in-kind income in total income continued to fall, which is in accordance with the strengthening of the market economy.
According to available figures concerning the distribution of income per household member several inequality indicators were estimated.2The results are shown in the bot-tom half of Table 2. The Gini coefficient points to moderate growth of inequality between 1988 and 1998, from 0.28 to 0.29, which is something of a surprise, for a much greater growth in inequality had been expected during the decade-long transition peri-od. However, the welfare role of the state had also increased, particularly in the domain of pensions via the opportunities for early retirement, and the maintenance of relatively high employment in the public sector in which a moderate inequality in the distribution of wages was maintained. These factors might explain the slight rise in inequality in the distribution of overall income. From 1998 to 2002 there was a further moderate rise in inequality as measured by the Gini coefficient, from 0.29 to 0.30. The Theil entropy index and the d9/d1 decile ratio show similar tendencies in the trends in inequality.3 They also suggest a slight rise in inequality between 1998 and 2002.
Income structure and inequality in distribution within individual components (sources) of income are important determinants of inequality of total income. One of the ways of estimating the contribution of given income components to total inequality is the decomposition of the Gini coefficient according to the method proposed by Fei, Ranis and Kuo (1978). Thus inequality measured by the Gini coefficient can be expressed as a weighted average of Gini coefficients of concentration of the individual components, where the shares of each component of income in the total income are used as weights:
(1)
Here G stands for the Gini coefficient, Gk*is the Gini coefficient of concentration for the c’s component of income, µkis the average of the c’s component, and µis the average of total income, with λk= µk /µ. The Gini coefficient of concentration is an
indi-∑
∑
= =
=
= K
k
K
k k k k
k
G G
G
1 1 * * λ
µ µ
2On the calculation of standard inequality indicators such as the Gini coefficient and the Theil entropy index,
see e.g. Cowell (1995).
3The decile ratio d9/d1 is defined as the ratio of the income of the poorest persons among the 10% of the richest
cator similar to the original Gini coefficient, except that in the calculation of it the pop-ulation is ordered according to total income, and not according to the individual com-ponent for which the coefficient is being calculated. The coefficient of concentration captures both an internal inequality in the distribution of a given kind of income, and the correlation of it with total income. This coefficient can take on values from -1, when the whole amount of the given income component is received by the poorest person in the distribution of total income, to 1, when the entire amount is received by the overall rich-est person. The relative contribution of the ccomponent of income to the total inequal-ity (sk) is calculated as:
(2)
In other words, for an estimation of the relative contribution of each component of income to total inequality what is important is; (i) its share in total income, and (ii) its coefficient of concentration. Since the coefficient of concentration can take on values from -1 to 1, the relative contribution of an individual component can be positive or neg-ative. A positive sign of the relative contribution of the c component of income indicates a situation in which a distribution of that component contributes to an increase in inequality of total income. Or, if the ccomponent of income, instead of the existing dis-tribution, were equally distributed among households, ceteris paribus, then the inequal-ity in the distribution of total income would be lower. Thus the fact that the c compo-nent of income is distributed in the existing manner, and not equally, has contributed to increased inequality. And vice versa, the negative relative contribution indicates a situ-ation in which the c component of income contributes to a reduction of total inequality. In an equal distribution of such a component of income instead of the existing distribu-tion, in conjunction with an unchanged distribution in the other income components, there would be an increase in overall inequality. This would mean that the existing dis-tribution of the ccomponent of income, as compared with the situation in which it was equally distributed, goes to a reduction in overall inequality. The relative contributions of all components of total income are summed in one.
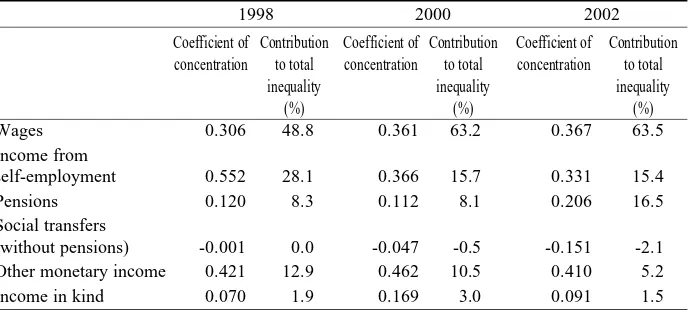
The results of this decomposition for Croatia for 1998, 2000 and 2002 are shown in Table 3. In all three years, wages made the greatest contribution to total inequality, because of the high proportion of overall income that they constitute, and also because of a coefficient of concentration of wages which was somewhat higher than the Gini coef-ficient for total income (which can be seen in a comparison with data in Table 2). The concentration of wages in households with higher total incomes was increased in 2000 and 2002, as compared with 1998, which, together with an increase in the proportion that wages accounted for in total income, led to an increase in the contribution of wages to total inequality. In 2002, inequality in distribution of wages “explains” more than 60% of the inequality in the distribution of overall income. The contribution of income from self-employment however moved in the opposite direction. From 1998 to 2002 the concen-tration of income from self-employment was markedly reduced. This made the distribu-tion of these incomes much more like the distribudistribu-tion of the wages of employed persons.
1 ,
1 *
=
=
∑
= K
k k k
k
k s
Apart from that, the share of income from self-employment declined, so that the contri-bution of this income component to overall inequality was considerably reduced.
The contribution made by pensions to total inequality increased between 2000 and 2002, because of the increased concentration of pensions among the richer households, and because of the increased income share of pensions. Inequality in the distribution of pensions in 2002 explained more than 16% of overall inequality, which is double the amount of two years earlier. Such a change can primarily be explained by the non-lin-ear increase in pensions in 2001 pursuant to the Increase in Pensions for the Sake of Obviating Differences in the Level of Pensions Disbursed in Different Periods Law (NN 127/00), by which the Government wanted to implement the Constitutional Court Decision concerning the so-called “debt to pensioners”.4
Table 3 Contribution to total inequality by income components (decomposition of the Gini coefficient)
1998 2000 2002
Coefficient of Contribution Coefficient of Contribution Coefficient of Contribution concentration to total concentration to total concentration to total
inequality inequality inequality
(%) (%) (%)
Wages 0.306 48.8 0.361 63.2 0.367 63.5
Income from
self-employment 0.552 28.1 0.366 15.7 0.331 15.4
Pensions 0.120 8.3 0.112 8.1 0.206 16.5
Social transfers
(without pensions) -0.001 0.0 -0.047 -0.5 -0.151 -2.1
Other monetary income 0.421 12.9 0.462 10.5 0.410 5.2
Income in kind 0.070 1.9 0.169 3.0 0.091 1.5
Source: Author’s estimate based on DZS (1998; 2000; 2002).
The rise in pensions was unequal. Pensions that were taken up to 1995 were increased the most (up to 20%), while pensions taken after that were as a rule increased by a smaller amount. The pensions rise was related to basic pensions. However, the exis-tence of the minimum pension regulation, where the amount of minimum pension did not change, resulted in the total receipts of many pensioners, those with the lowest basic pensions, not rising at all. For if the basic pension was lower than the minimum the pen-sioner would receive a supplement up to the level of the minimum pension. In a situa-tion in which the basic pension was increased in line with the Law, it would happen that the amount of the pension after the increase was still lower than the minimum pension, meaning that the total receipts of these pensioners did not change – they still received a
4Actually, the Law specifically alludes to this in Article 1: “This Law governs the manner of raising pensions
sum amounting to the minimum pension. Furthermore, in this increase in pensions per-sons in receipt of pensions pursuant to the individual farmers insurance were not includ-ed at all, and it is this category of pensioners that has exceptionally low pensions. For this reasons it follows that pensioners with the lowest pensions continued to have no increase in their receipts, while the increase in receipts was unequally distributed among pensioners with higher pensions. A considerably enlarged coefficient of concentration of pensions in 2002 clearly shows that the repayment of the debt to pensioners led to an increase in the inequality of pensions, favouring thereby better off households. Thereby, distribution of pension contributed to an increase in total inequality.5
Welfare transfers (benefits for unemployment, sick leave and dependent children and welfare benefits) usually tended to reduce total inequality. They are dominantly concentrated in the worst-off households, which is suggested by the negative coefficient of concentration of social transfers seen in Table 3. What is more, concentration of these transfers amongst the poorest households increased in the 1998-2002 period. However, a relatively small contribution to the reduction of overall inequality of 2% in 2002 can be ascribed to the small share of such transfers in the total income. Thus social transfers (without pensions) in 2002 made up 4% of the total income of a household, and in 1998 4.3%. In such a situation an increase in the amount of social transfers could have a fair-ly effective impact on the reduction of overall inequality, because these transfers are quite well targeted towards the poorest households.
The contribution of the distribution of other monetary income (mostly incomes from property) to total inequality fell in the 1998-2002 period, primarily because of the reduction in such income as proportion of overall income, while the concentration of this kind of income in the period remained stable. The same thing goes for in-kind income, the proportion of which in overall income fell, and hence its effect on overall inequality was also reduced.
4. Income distribution by decile groups
An additional insight into the distribution of income is given by a comparison of income shares of various decile groups. Figure 1 shows a comparison of the decile shares in total income in 1998 and 2002. The comparison proves that the decile groups in the bottom part of the distribution in 2002 had a smaller share than in 1998, while there was an increase in the income share of the decile groups in the upper end, with the exception of the final decile. This is one more illustration of the increase in inequality that occurred in the period under observation. Thus the share of the first decile group (which covers the 10% of the poorest households according to the income per household member criterion) fell from 3.5 to 3.1%.6Similarly, the income shares of the second and
5It should not, however, be neglected that pensions of most pensioners were actually increased, that is, that
there was substantial rise in the average pension. This can be seen as the increased proportion of pensions and other social transfers in total income household in Table 2.
6It should be mentioned in the date we used the decile groups were already formed by CBS. Each decile group
third deciles fell. Ten percent of the richest households in Croatia had received about 23% of the total income. This share was the same in 2002 and 1998.
Figure 1 Income share by deciles in 1998 and 2002 (in %)
0 5 10 15 20 25
1 2 3 4 5 6 7 8 9 10
1998 2002
Source: Author’s estimate based on DZS (1998; 2002).
Table 4 Income composition by decile group, 2002
Decile Wages Income Pensions Other Other Income Total
from self- social monetary in kind income employment transfers income
1 25.3 15.4 26.1 20.2 3.3 9.7 100
2 37.5 13.7 28.0 9.4 3.8 7.6 100
3 44.0 12.5 26.3 7.1 3.7 6.4 100
4 44.6 13.7 27.6 5.7 2.4 6.0 100
5 47.6 12.7 27.4 4.7 2.2 5.4 100
6 49.9 10.9 28.1 2.9 2.8 5.5 100
7 54.6 11.0 24.1 2.7 2.8 4.8 100
8 51.4 13.0 25.2 3.4 2.6 4.4 100
9 57.4 11.7 22.4 1.5 3.7 3.4 100
10 57.3 19.0 13.9 1.0 6.7 2.2 100
Note: Income does not include imputed housing rent. The distribution of income per member of household is considered.
Source: Author’s estimation based on HBS (1988; 1999; 2000; and 2002).
distribution (households with higher incomes). Table 4 illustrates this with a portrayal of the structure of income per decile group in 2002. For the first decile, that is, for the poorest 10% of households, pensions were the major source of income, accounting for about 26%. Wages account for about 25% of total income. Social transfers (without pen-sions) account for a substantial proportion of the incomes of the first decile, about 20%, and in-kind income also has a significant share, of about 10%. Wages in general are a dominant source of income for all deciles, with the proviso that in the incomes of high-er deciles as a rule wages come to a highhigh-er proportion of total income. In the last two decile groups, wages constituted 57% of total income.
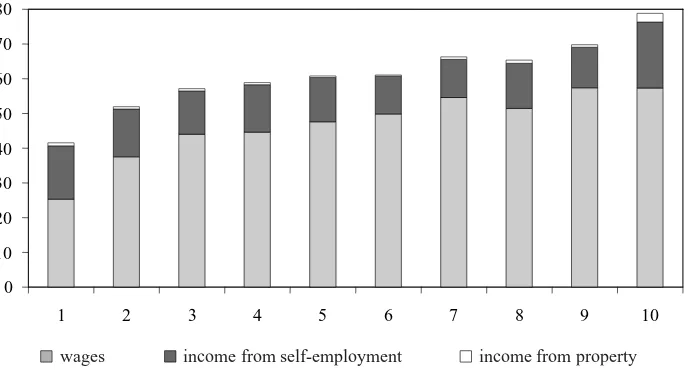
Income from self-employment has a relatively high importance in the first and last deciles. However, the nature of such income is essentially different in these two deciles. While in the first decile it is mainly a matter of income from small individual farming, income from a trade (a free-lance occupation) is dominant in the tenth decile. In all the deciles the income share of pensions is on the whole the same constituting as a rule a bit over a quarter of total income, except in the last two deciles, where this percentage is smaller. The reduction in the share of pensions in the last decile is particularly apparent, for it comes to about 14%. Other social transfers (unemployment, sick leave, home nurs-ing benefits, child benefits, welfare assistance) are of some importance only in the poor-est households, while in the other parts of the distribution they are an almost negligible source of income. Other monetary income (mainly property income) constitutes a stable 3% of total income in all deciles, except in the tenth, where the proportion of it in total income is a bit higher, about 7%. Incomes in kind, mainly the value of goods from own farm, yard or trade used, are represented more strongly in the poorer households. Figure 2 Aggregate shares of market income by deciles, 2002 (in %)
0 10 20 30 40 50 60 70 80
1 2 3 4 5 6 7 8 9 10
wages income from self-employment income from property
According to this kind of structure of income per decile group it is already possible to observe that the incomes of the richer households are to a much higher extent depen-dent on the market activity. This is confirmed by Figure 2. If we define wages, income from self-employment and income from property as market incomes, then it follows that in the poorest decile, it amounts to less than a half of their total income. It has already been mentioned that the poorest households to a very great extent rely on government transfers and income in kind. Market income, as a proportion of total income is larger in the higher deciles (i.e., in households with higher incomes). The richest 10% of house-holds obtain almost 80% of their income directly on the market. Hence it can be con-cluded that participation in the market (above all the labour market), i.e., the opportunity to find employment, and hence the ability to generate income from work, is extremely important for an improvement of the material position of the poorest households.
5. The distribution of income – how much the poorest receive
It has already been shown that there are differences in the sources of income between the richest and the poorest groups. It is desirable to consider the shares of the poorest households in given kinds of income, primarily in social transfers, so as to obtain an insight into the targeting of given forms of income towards the poorer households.
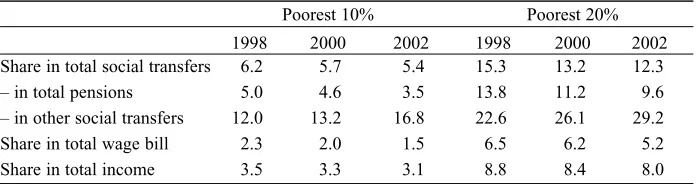
It can be seen from the figures in Table 5 that the poorest 10% of households are taking part less and less in the distribution of overall social transfers – their share has reduced from 6.2% in 1998 to 5.4% in 2002. This holds too if the poorest quintile is con-sidered. The trend observed was nevertheless dominantly impacted by the distribution of pensions, with the poorest in recent years obtaining an ever-smaller share. In 2002 the poorest 10% of households received 3.5% of the sum total of pensions. At the same time the degree of targeting of other social transfers rose. While in 1998 the poorest decile obtained 12% of social transfers not including pensions, in 2002 this proportion rose to about 17%. The poorest quintile of the population received about 30% of all social trans-fers not including pensions in 2002.
Table 5 Income shares of the poorest households (%)
Poorest 10% Poorest 20%
1998 2000 2002 1998 2000 2002
Share in total social transfers 6.2 5.7 5.4 15.3 13.2 12.3
– in total pensions 5.0 4.6 3.5 13.8 11.2 9.6
– in other social transfers 12.0 13.2 16.8 22.6 26.1 29.2
Share in total wage bill 2.3 2.0 1.5 6.5 6.2 5.2
Share in total income 3.5 3.3 3.1 8.8 8.4 8.0
Note: Other social transfers include welfare benefits, unemployment benefits and government transfers related to children and the family.
It has already been shown that a greater share of market income is associated with a higher level of total household income. It would seem that in this segment an ever-increasing exclusion of the poor is occurring. The share of poor households in the dis-tribution of wages has fallen. In 2002 the poorest 10% of households received only 1.5% of total wages (as compared with 6.5% in 1998). Declining wage share of the poorest households was caused that their share in total income is also falling. In consequence, income inequality in the 1998-2002 period was increased, as already indicated via a number of aggregate measures of inequality.
6. Conclusion
The results of the examination of the income distribution on the basis of the Household Budget Survey in the 1998-2002 period can be summed up in a few findings: (i) the inequality in the distribution of overall income is slightly on the rise; (ii) wages are becoming an increasingly important source of income, and at the same time they are being increasingly concentrated in the richer households; (iii) the non-linear increase in pensions in 2001 (paying back the debt to the retirees) contributed to an increase in inequality; (iv) the targeting of social transfers to the poorer households has been increased, which has prevented an even greater rise in inequality and (v) poor house-holds obtain a relatively small part of their income directly on the market, and rely more upon welfare receipts and income in kind.
According to the last two observations, two recommendations might be made for an improvement of the plight of the poorest households. Firstly, considering the well-tar-geted social transfers (unemployment, sick leave and child benefits and welfare assis-tance) towards the poor, it can be expected that an increase in the amount of such trans-fers would contribute to an increase in the income of the poorest, and hence to the reduc-tion in inequality. Secondly, the exclusion of the poor from the labour market is one of the causes of their poor material conditions, so that an increase in the opportunities for work and increased employability of this group of citizens would be effective measures for the poverty reduction.
survey, which is actually designed in such a way as to give periodic snapshots, not a reli-able time series.
For statistical requirements that are so diverse it would be desirable to have num-bers of different surveys. For the purpose of calculating social indicators it would be a good idea to have a panel survey, in which the same household would be monitored sev-eral years running. This would improve the temporal comparability of the indicators of inequality and poverty, and enable an insight into the social mobility of the population. Thus it would be possible to track which segments of the population are improving their material situation, and who the losers are, how much poverty is rooted (how long peo-ple stay in poverty) and which mechanisms give better results in the fight against pover-ty. The design of such a survey should be related to EU experience, but could be sup-plemented with questions important for the purpose of managing domestic economic and social policies. In the EU, the EU-SILC (European Statistics on Income and Living Conditions) panel survey is being developed rapidly; many EU members have carried out pilot projects, and in 2005 – 2006 it is expected to be fully introduced into most of the member states. Hence it would seem necessary in Croatia too to undertake measures for the swift introduction of such a survey, adjusted to take account of both European statistical standards and domestic policy purposes.
LITERATURE
Cowell, F. A., 1995. Measuring Inequality. London: Prentice Hall : Harvester Wheatsheaf.
DZS, 1998. Anketa o potrošnji kuæanstava 1998. Baza podataka Dravnog zavoda za statistiku Republike Hrvatske.
DZS, 1999. Anketa o potrošnji kuæanstava 1999 - ukupno raspoloiva sredstva kuæanstva po decilima. Neobjavljene radne tablice Dravnog zavoda za statistiku Republike Hrvatske.
DZS, 2000. Anketa o potrošnji kuæanstava 2000 - ukupno raspoloiva sredstva kuæanstva po decilima – prosjek po èlanu kuæanstva. Neobjavljene radne tablice Dravnog zavoda za statistiku Republike Hrvatske.
DZS, 2001. Anketa o potrošnji kuæanstava 2001 - ukupno raspoloiva sredstva kuæanstva po decilima – prosjek po èlanu kuæanstva. Neobjavljene radne tablice Dravnog zavoda za statistiku Republike Hrvatske.
DZS, 2002. Anketa o potrošnji kuæanstava 2002 - ukupno raspoloiva sredstva kuæanstva po decilima – prosjek po èlanu kuæanstva. Neobjavljene radne tablice Dravnog zavoda za statistiku Republike Hrvatske.
DZS, 2003a. “Anketa o potrošnji kuæanstava – osnovne karakteristike potrošnje i primanja kuæanstava od 2000. do 2002.” Priopæenje,13.2.1. Zagreb: Dravni zavod za statistiku.
DZS, 2004. “Pokazatelji siromaštva od 2001. do 2003.” Priopæenje, (13.2.2). Zagreb: Dravni zavod za statistiku.
Fei, J. C. H., Ranis, G. and Kuo, S. W. Y., 1978. “Growth and family distribution of income by factor components”. Quarterly Journal of Economics, (92), 17-53.
Nestiæ, D., 2002. “Ekonomske nejednakosti u Hrvatskoj 1973-1998”. Financijska teorija i praksa, 26 (3), 595-613.
SZS, 1990. “Anketa o potrošnji domaæinstava u 1988 – raspoloiva i upotrebljena sredstva – prosek po èlanu domaæinstva”. Statistièki bilten, (1851). Beograd: Savezni zavod za statistiku.
World Bank, 2000. Croatia: Economic Vulnerability and Welfare Study, Volume II: Technical Papers. Washington D.C.: World Bank, Poverty Reduction and Economic Management Unit, Europe and Central Asia Region.