Vol.7 (2017) No. 2
ISSN: 2088-5334
Development of Electronic Nose with Highly Stable Sample Heater to
Classify Quality Levels of Local Black Tea
Danang Lelono
*#, Kuwat Triyana
*$, Sri Hartati
#, Jazi E. Istiyanto
#*Department of Physics, Universitas Gadjah Mada, Yogyakarta, 55281, Indonesia #
Department of Computer Science and Electronics Instrumentation, Universitas Gadjah Mada, Yogyakarta, 55281, Indonesia E-mail: [email protected]
$
Halal Research Group Universitas Gadjah Mada, Yogyakarta, 55281, Indonesia E-mail: [email protected] (corresponding author)
Abstract— an electronic nose (e-nose) based on a gas sensor array equipped with a stable temperature controller has been successfully developed by applying proportional–integral–derivative (PID) controller. This study was motivated due to the dependence of sensor response on the temperature of a sample. Here, the temperature influences the volatile organic compounds (VOC) of the sample. The performance of the e-nose was then evaluated to classify the quality levels of black tea (Q1, Q2, and Q3). The black tea samples were purchased from Tambi Tea Industry in Central Java, Indonesia. Here, the quality is based on the information from the factory. For each quality level, the measurement was repeated 31 times. Therefore, the total of measurements is 93, and only six sensors, i.e. MQ-7, TGS 813, TGS 2602, TGS 826, TGS 2620 and TGS 825 have the high influence on the patterns differentiation. It is found that the e-nose is not able to distinguish the three quality levels of black tea correctly when applying without heating treatment. In this condition, only 88.9% of cross-validated grouped are correctly classified. On the other hand, for the black tea sample with unstable heating, the performance of the e-nose has been improved. In this case, 92.5% of cross-validated grouped are correctly classified. Moreover, for the black tea sample with stable heating treatment, all samples are separated where 97.8% of cross-validated grouped are correctly classified. The results indicated that the e-nose with the highly stable heater was capable of detecting the quality of black tea.
Keywords— black tea; electronic nose; gas sensor array; LDA; PCA; PID; quality level
I. INTRODUCTION
Black tea or Camellia Sinensis is a variant of tea which is very popular in the world. This tea is widely sought by the consumers so that its quality has a commercial value in the international market. The quality of the black tea can be determined based on its aroma, taste, color, and chemical compounds [1].
Based on its aroma, the quality of black tea is often determined by a tea tester expert. Even though this method is the most realistic to the quality of black tea, there are still several problems such as standardization of measurements, stability, reproducibility, and subjective in nature [2]. Meanwhile, the standard analytical methods like high-performance liquid chromatography (HPLC), gas chromatography (GC) and capillary electrophoresis (CE) show a high performance, but these are difficult to be applied directly, in particular for fast assessment [3]. It is because these analytical instruments are usually complicated and must be operated and analyzed by experts [4], [5].
In this paper, we report our improvement of the e-nose system by stabilizing the temperature of the sample heater using PID controller. For a certain temperature setting, the temperature tolerant has been improved from ± 3 °C (using
ON/OFF controller) to ± 0.2 °C (using PID controller). Furthermore, principal component analysis (PCA) and linear
discriminant analysis (LDA) methods were used to obtain the capability of the e-nose to distinguish quality levels of black tea. Effect of the sample temperature was investigated
for the sample without heating (treatment I), unstable heating (treatment II), and stable heating (treatment III).
II. MATERIALS AND METHOD
A. Materials
The black tea samples with three quality levels used in this study were purchased from Tambi Tea Industry in Central Java, Indonesia. The information of the quality levels from the highest (Q1) to medium (Q2), and lowest (Q3) was obtained from the factory. Based on the factory, Q1 is broken orange pekoe (BOP). It is the black tea with a fine powder made from leaf tea, and Q2 is broken pekoe II (BP-II), made from tea leaves and stems slightly coarse in powder form. Meanwhile, Q3 is the Bohea that dominated by the rod-shaped tea coarse powder.
Twelve types of metal oxide semiconductor (MOS) commercial gas sensors purchased from different manufacturers (MQ7, TGS8XX, and TGS26XX series). Each sensor exhibits global selectivity as summarized in TABLE [12], [13]. These twelve gas sensors were then separated into four boards as the number of holes in the sensor chamber. The sensor chamber was made from Dural
aluminum with a volume of 170 mL. Each board of sensor array was mounted facing each other to minimize the effect of non-homogeneous aroma in the chamber.
B. E-nose System
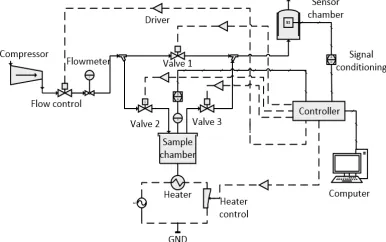
The schematic diagram of the e-nose system developed in this study is shown in Fig. 1. It consists of (1) main controller, (2) sensor chamber including the sensor array inside, (3) air flow system, (4) air flow speed regulator, (5) sample chamber, and (6) heater controller. The detail of this instrumentation system is described as follows.
1) Main Controller
Fig. 3 Schematic diagram of temperature controller in the sample chamber
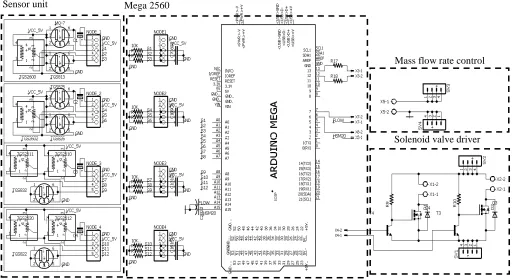
The main controller is the Mega 2560 from Arduino®. This contains 10-bit ADC, 16 analog inputs, 54 digital input/output which is 15 of them are used as pulse width modulation (PWM). Furthermore, the output of the analog voltage can be obtained by manipulating the duty cycle of the PWM via the digital output. Each gas sensor of the 12-gas sensor array is connected to the microcontroller via the terminal node shield to reduce noises. Fig. 2 shows the electronic circuit diagram of the e-nose system.
Fig. 2 Electronic circuit diagram of the e-nose system
Sensor unit Mega 2560
TABLEI
LIST OF GAS SENSORS INSTALLED IN THE E-NOSE [12,][13]
Group Sensor Response to
No type
A 1 MQ 7 CO, hydrogen, LPG, methane,
alcohol, air
2 TGS2600 Methane, CO, Isobutane, ethanol,
hydrogen, pollutant gasses
3 TGS813 Methane, propane, butane,
flammable gasses
B 4 TGS825 Hydrogen sulfide
5 TGS2602 Hydrogen sulfide, ammonia,
ethanol, toluene
6 TGS826 Ammonia, isobutane, hydrogen,
ethanol, air
C 7 TGS2610 Liquid petroleum gas, propane,
isobutane, metane, ethanol, hydrogen, air
8 TGS 2611 Methane, ethanol, hydrogen,
isobutane, air.
9 TGS832 Freon, ethanol, air.
D 10 TGS2612 Methane, liquid petroleum gasses,
ethanol, isobutane, propane
11 TGS 2620 Alcohol, hydrogen, isobutane, CO,
methane, air
12 TGS822 Alcohol, n-hexane, benzene,
methane, CO, isobutane, acetone.
2) Air Flow System (AFS) and Sample Chamber
The air flow system (AFS) was used to handle and delivered odor by using dried air as carried gas during purging and sensing stage. In this system, the solenoid valve alternately switched between the headspace vapor sample and dried air.
serves as an electronic switch, while the 2N2222 transistor serves as a MOSFET amplifier.
In AFS, purging occurs when valves 2 and 3 are closed, while valve 1 is opened. This condition causes air pressure flowing to the sensor chamber. Oppositely, sensing occurs when valve 1 is closed, and valve 2, 3 are opened so that air pressure enters the sample chamber for pushing aroma to sensor chamber.
The sample chamber, on the other hand, was made from stainless steel with a volume of about 500 mL. It was equipped with a stabilized heater (see Fig.
3
) using a proportional–integral–derivative controller (PID controller). The heater is controlled by adjusting the pulse width as the output of the microcontroller. Then, the pulse width resulted from the conversion of the difference between the read temperature, and the setpoint is converted into PWM to activate the triac (BT136). The flow rate of air or aroma of the sample can be adjusted using mass flow control (MFC) of SLA 7950S. It can be conducted by varying the orifice of MFC using the PWM.C. Sample Preparation and E-nose Measurement
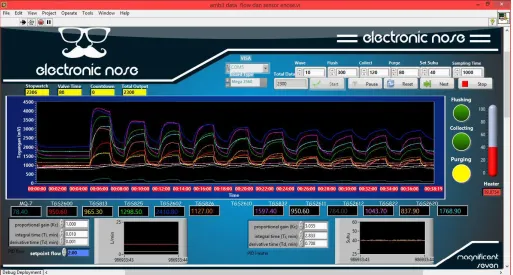
sensor chamber for signal collecting by the sensor array. Meanwhile, the purging process was taken place by blowing the dried air into sensor chamber to recovery the baseline response. Each sample was measured for ten cycles and repeated for 31 times. Fig. 4 shows GUI containing sensor responses for ten cycles.
D. Data Analysis
For each cycle of sniffing process, a preprocessing signal was applied to obtain the relevant information and prepare the data for multivariate statistical analysis. This process consisted of manipulating the response of the signal on the baseline using a fractional method [15]. Furthermore, the feature extraction was carried out to obtain the robust information that represents a unique pattern of each sample. The feature of the signal was the maximum value of the response curve [16].
Due to using 12 gas sensors in the e-nose, the high dimension matrix (order of 930 × 12) resulted in the feature extraction of all measurements. Finally, to investigate whether e-nose was able to distinguish among different quality levels of the black tea, PCA and LDA analysis were applied. All these multivariate analyses were applied to the collected data, using Minitab 16 software package for PCA, and SPSS v. 21.0 for LDA. PCA extracts the discrimination of sample types, while LDA maximizes the variance between sample categories (quality levels).
III.RESULTS AND DISCUSSION
A. Temperature Controller
An important requirement of the heating system is stability because of the high sensitivity of the aroma to the temperature. Fig. 5 shows the performance of the heater control system. For the set point of 40 °C, it takes about 600 s. The coefficient of PID controller roles in reaching the time stability of the heater. Overshoot (inset in Fig. 5a) arise due to a mismatch in the coefficient of PID controller which in turn will lead to instability headspace. Oppositely, when the damping occurs (without overshoot), it causes the longer response time (> 700 s) of the heater to reach the set point value (inset in Fig. 5b).
Fig. 5 A typical of the temperature controller performance when the set point is 40 °C. Inset is the time response a) less than 600 s, b) more than 700 s
B. Temperature Testing Stabilization
As shown in Fig.
6
, the aroma intensity of black tea can be increased by heating the sample. In this experiment, the tea sample burns if the temperature of the chamber is more than 50 °C. It means that the heater should be controlled to obtain the optimum condition.Fig. 6 Increasing the sensor response due to increasing the temperature of the sample
C. Stability of Sensor Array
The stability test of the heating system was conducted to determine the performance of the system related to the sensor response.
Fig.
7
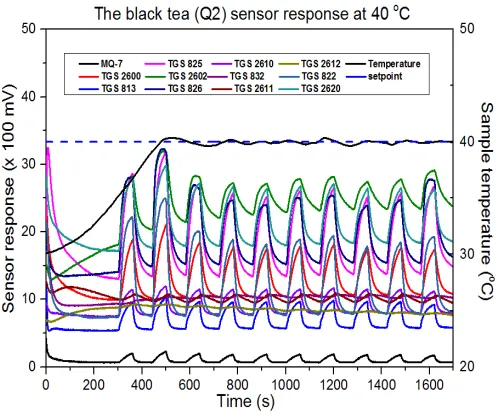
shows the raw responses of 12 sensors for ten cycles of sensing and purging under a stable temperature of 40 °C.As shown inFig.
7
, the first two cycles (less than 600 s) show relatively unstable compared to the others.Fig. 7 Sensor responses generated at the set point of 40 °C
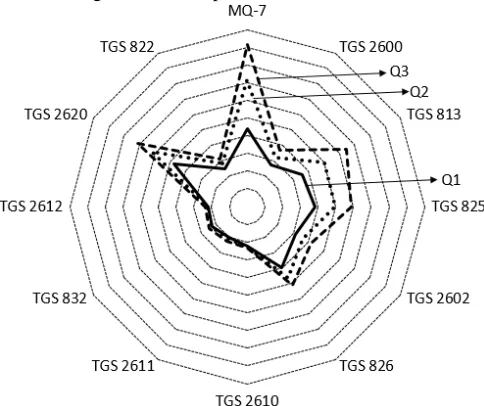
pattern classification. It is also shown that the lower quality level, the higher sensor response.
Fig. 8 Radar plot of the extracted patterns for Q1, Q2, and Q3 at the set point of 40 °C
D. Principal Component Analysis (PCA)
Prior to classification, a feature selection must be performed. It is the process of selecting relevant sensors that significantly contribute to the sample classification.The loading plot (see Fig. 9) representatives from all quality levels of the black tea samples. It also shows the relationship between the e-nose variables and how they influence the system. Here, the MQ-7, TGS 813, TGS 2602, TGS 826, TGS 2620 and TGS 825 sensors have the high influence in the pattern file. This result is in accordance with Fig. 8.
Before feature extraction, manipulating the response of the signal using the fractional method has been carried out because of quite high differences on both signals in the sensor responses. For example, the difference of the sensor response curve (see
Fig.
7
) of MQ7 (191.1 mV) and TGS 826 (2695.0 mV) is very high, and it can be reduced using this method.Fig. 9 Loading plot of the sensor array election in the e-nose system
Next, the feature extraction is then carried out by taking the maximum value of the sensor response. The score plots of PCA for three quality levels are shown in Fig. 10(a-c), where TQx represents the test sample of Qx.
Fig. 10(a) shows the score plot for the black tea sample
Fig. 10 Score plot of PCA for three quality levels of dried black tea. (a) without heating or treatment I, (b) with unstable heating or treatment II, and (c) with stable heating or treatment III. TQx is the test sample of Qx
On the other hand, by applying uncontrolled heating treatment (Fig. 10), the capability of the e-nose to classify the quality levels is much worse compared to that of without heating treatment. In this case, the score plot reveals that separation along PC1 accounted for only 70.3% of the variation in the sample set, whereas separation along PC2 accounted for 17.9% of the variation in the sample set.
Error! Reference source not found. shows score plot of
PCA for three quality levels of dried black tea with stabilized heating treatment at 40 °C using PID heater controller. Each quality level, one set of measurement was repeated ten times using the same condition. One set of measurement was repeated ten times using the same condition. The processed data show a regular shift of different quality levels along PC1, which explains 90.3% of the total variance with value 95.6%. The PC2 explains 5.1% of the variation and shows no particular trend with quality levels. The three quality levels of black tea, including the test data (TQ1, TQ2, and TQ3), were clearly distinguished from each group. From Figs. 10(a-c), the stability of the sample temperature is an important parameter to obtain high classification rate.
E. Linear Discriminant Analysis (LDA)
PCA is known as an unsupervised recognition system, while LDA is a supervised recognition system. Fig. 11(a) shows the LDA plot for the black tea sample without heating (treatment I). Q1 is separated from others while some samples from Q2 and Q3 are overlapped. As listed in Table 2, only 88.9% of original grouped and 88.9% of cross-validated grouped are correctly classified. On the other hand, for the black tea sample with unstable heating (treatment II), the performance of the e-nose is improved as indicated by Fig. 11(b). Most samples are separated where 95.7% of original grouped and 92.5% of cross-validated grouped are correctly classified. Finally, for the black tea sample with stable heating (treatment III), the performance of the e-nose shows more improvement as indicated by Fig. 11(c). All samples are separated where 97.8% of original grouped and 97.8% of cross-validated grouped are correctly classified.
TABLEII
CROSS-VALIDATION OBTAINED BY LDA FOR THREE QUALITY LEVELS OF DRIED BLACK TEA WITH STABILIZED HEATING TREATMENT AT 40°C
USING PIDHEATER CONTROLLER
Predicted Membership (%) Treatment Desired
Output
Q1 Q2 Q3 Total
(I) Q1 87.1 3.2 9.7 100.0
Q2 3.2 93.5 3.2 100.0
Q3 14.3 0.0 85.7 100.0
(II) Q1 96.8 3.2 0.0 100.0
Q2 3.2 87.1 9.7 100.0
Q3 0.0 6.5 93.5 100.0
(III) Q1 100.0 0.0 0.0 100.0
Q2 0.0 100.0 0.0 100.0
Fig. 11 LDA plot for three quality levels of dried black tea. (a) without heating or treatment I, (b) with unstable heating or treatment II, and (c) with stable heating or treatment III
IV.CONCLUSIONS
The e-nose with highly stable and controllable sample heater system was successfully developed by applying PID controller. The sensor response exhibits significantly dependent on the temperature of the sample. Without heating treatment, the e-nose is not able to distinguish the three quality levels of black tea correctly. By applying the unstable heating treatment, the performance of the e-nose was improved significantly. When using the stable and controllable sample heater, all samples are separated clearly, where 97.8% of original grouped and 97.8% of cross-validated grouped are correctly classified.
ACKNOWLEDGMENT
Part of this work was supported by the Research Grant of “Penelitian Disertasi Doktor 2016” and “PUPT UGM” (No. 015/SP2H/LT/DRPM/II/2016) by Ministry of Research, Technology and Higher Education, the Republic of Indonesia.
REFERENCES
[1] N. Bhattacharyya, B. Tudu, R. Bandyopadhyay, M. Bhuyan, and R. Mudi, “Aroma characterization of orthodox black tea with electronic nose,” in TENCON 2004. 2004 IEEE Region 10 Conference, 2004, vol. B, p. 427–430 Vol. 2.
[2] R. Banerjee, P. Chattopadhyay, R. Rani, B. Tudu, R. Bandyopadhyay, and N. Bhattacharyya, Discrimination of black tea using electronic
nose and electronic tongue: A Bayesian classifier approach. IEEE,
2011, pp. 13–17.
[3] T. Sinha, “Discrimination of tea quality by polymer membrane electrode based potentiometric taste sensor,” pp. 781–784, Dec. 2012. [4] B. Banerjee, “Tea Production and Processing.” Oxford and IBH Publ.
Co. Private Limited, New Delhi, India, p. 2, 1993.
[5] M. Ghasemi-Varnamkhasti, S. S. Mohtasebi, M. L. Rodriguez-Mendez, J. Lozano, S. H. Razavi, and H. Ahmadi, “Potential application of electronic nose technology in brewery,” Trends Food
Sci. Technol., vol. 22, no. 4, pp. 165–174, 2011.
[6] Z. Zhao, F. Tian, H. Liao, X. Yin, Y. Liu, and B. Yu, “Sensors and Actuators B : Chemical A novel spectrum analysis technique for odor-sensing in the optical electronic nose,” Sensors Actuators B.
Chem., vol. 222, pp. 769–779, 2016.
[7] K. Yan and D. Zhang, “Calibration transfer and drift compensation of e-noses via coupled task learning,” Sensors Actuators B Chem., vol. 225, pp. 288–297, 2016.
[8] D. Ha, Q. Sun, K. Su, H. Wan, H. Li, N. Xu, F. Sun, L. Zhuang, N. Hu, and P. Wang, “Recent achievements in electronic tongue and bioelectronic tongue as taste sensors,” Sensors Actuators B Chem., vol. 207, pp. 1136–1146, 2015.
[9] S. Qiu, J. Wang, and L. Gao, “Qualification and quantisation of processed strawberry juice based on electronic nose and tongue,”
LWT - Food Sci. Technol., vol. 60, no. 1, pp. 115–123, 2015.
[10] L. Lvova, R. Pudi, P. Galloni, V. Lippolis, C. Di Natale, I. Lundström, and R. Paolesse, “Multi-transduction sensing films for Electronic Tongue applications,” Sensors Actuators B Chem., vol. 207, pp. 1076–1086, 2015.
[11] B. Tudu, A. Jana, A. Metla, D. Ghosh, N. Bhattacharyya, and R. Bandyopadhyay, “Electronic nose for black tea quality evaluation by an incremental RBF network,” Sensors Actuators, B Chem., vol. 138, no. 1, pp. 90–95, 2009.
[12] H. Nanto and J. R. Stetter, “Introduction to Chemosensors,” in
Handbook of Machine Olfaction, Wiley-VCH Verlag GmbH & Co.
KGaA, 2004, pp. 79–104.
[13] W. Yan, Z. Tang, G. Wei, J. Yang, L. Province, and S. Province, “An Electronic Nose Recognition Algorithm Based on PCA-ICA Preprocessing and Fuzzy Neural Network,” pp. 1227–1230, 2012. [14] Figaro, “PRODUCT INFORMATION TGS 2600 - for the detection
of Air Contaminants,” 2001.
[15] D. Lelono, K. Triyana, S. Hartati, and J. E. Istiyanto, “principal component analysis Classification of Indonesia Black Teas Based on Quality by Using Electronic Nose and Principal Component Analysis,” in AIP Conference Proceedings, 2016, vol. 1755, pp. 20003–1.