Stress-strain response of sheared wheat granular material stored
in silos using triaxial compression tests**
Changnv Zeng1, He Gu1, and Yuke Wang2,3*
1College of Civil Engineering and Architecture, Henan University of Technology, Zhengzhou, 450001, China 2College of Water Conservancy Engineering, Zhengzhou University, Zhengzhou, 450001, China
3Collaborative Innovation Center of Water Conservancy and Transportation Infrastructure Safety Protection, Henan Province, Zhengzhou University, Zhengzhou, 450001, China
Received May 17, 2019; accepted January 3, 2020
*Corresponding author e-mail: ykewang@163.com
**This work was substantially supported by the Plan for Youth Core Teachers of Henan University of Technology (2015004), the Provincial Key Laboratory for Grain and Oil Storage Facility & Safety, Henan University of Technology (2016KF-B03)
(2016-2019), Key Scientific Research Project Plan of Colleges
and Universities in Henan Province (19A560009; 20A56002) (2019-2021), and China Postdoctoral Science Foundation
(2019M662533) (2019-2021). © 2020 Institute of Agrophysics, Polish Academy of Sciences A b s t r a c t. Wheat granular material stored in silos usually
suf-fers shearing loads, which induces complex stress-strain response
during the silo filling and discharging process. In order to guar -antee the safe storage of these granular materials, it is necessary to investigate the shearing behaviour of wheat granular material in silos. In this paper, a series of triaxial tests were conducted on
wheat granular material by using a modified double cell triaxial
system. The stress-strain responses including the volumetric strain behaviour were examined considering the effect of the initial void
ratio, confining pressure and shearing velocity. Different shearing
states were discussed to obtain their strength parameters in vari-ous conditions. The results show that the shearing characteristics
of wheat granular material are influenced by the shearing velocity.
The friction angles increase with the decreasing void ratio at
dif-ferent states. The final volumetric strain decreases with increasing confining pressure, and the dilation is diminished. The dilatancy behaviour was quantitatively evaluated based on Row’s theory for
wheat granular material. The stress-strain relationship of wheat granular material was then determined.
K e y w o r d s: wheat granular, void ratio, confining pressure,
shearing velocity, strength, dilatancy
INTRODUCTION
Wheat granular materials are usually stored in silos, which are used in many industries including chemical, agriculture, mining, food processing, and electric power
generation (Rotter et al., 2009; Dogangun et al., 2009;
Zeng et al., 2019a). The load from the stored material is
a critical point in the practical design of a silo, and one, which frequently induces failure in silos (Carson, 2001; Ayuga et al., 2005; Carson et al., 2015). There still exists some uncertainty in the selection of the appropria- te mechanical parameters for technicians. It has been de-
duced that mass flow discharge pressures may be caused
by the dilatancy of dense sheared material in silos (Zhang and Britton, 2003). Therefore, it is of great importance to achieve a better understanding of the shear behaviour of wheat granular material stored in silos.
As the density, flow and friction properties of agricul -tural materials vary widely, the loads applied on a silo are complex considering that the conditions of storage vary (Nielsen, 1977; Puri, 2002; Moya et al., 2002; Ramirez et al., 2009; Stasiak et al., 2010; Liu et al., 2014; Horabikand Molenda, 2017). The traditional triaxial apparatus cannot simulate the complex condition in actual engineering (Wang
et al., 2017, 2018, 2019).The numerical method may
accu-rately model the complex shear behaviour of stored wheat
granular material (Ramirez et al., 2010; Ruiz et al., 2012;
Rotter et al., 1998; Ayuga et al., 2001; Guaita et al., 2003; Zhao et al., 2013; Zhang et al., 2014; Kobyłka et al., 2017). In these cases, the stress-strain behaviour is particularly of
the most major concern (Goodey et al., 2017).
The conventional triaxial compression apparatus was
ventional triaxial system was modified to be used in testing
granular material. A series of triaxial tests were carried out to investigate the volumetric properties and strength
response. The effects of the void ratio, confining pressure
and shearing velocity on the stress-strain response were examined. The purpose of this investigation was to better understand the effect of different parameters on the triaxial behaviour of wheat.
to soil, the grains stored in silos behave like unsaturated or dry granular soil. Therefore, the double cell system may be used to test granular materials. In order to obtain such
measurements, the double cell system was modified based
on the traditional common triaxial system.
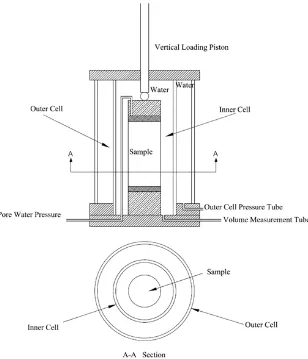
The biggest difference between the modified and tradi -tional triaxial system is the double cell, which consists of a double cell connected to the volume measure transducer
(Fig. 1). Specifically, the double cell was formed by top
and bottom flanges, fixed and sealed to a double transparent
plexiglass cylinder by screws. Both the inner and the outer
container are connected with top and bottom flanges. The
apparatus could be dismantled to allow for the installation and removal of specimens.
The outer cell has an internal diameter of 160 mm, a height of 250 mm, and a wall thickness of 5 mm (Fig. 1). The internal diameter, height, and wall thickness of the inner cell is 100, 250, and 5 mm, respectively. The standard size for a specimen is a diameter of 61.8 mm and a height of 125 mm. The inner container and the outer cell were both
filled with de-aired water during the tests. There was a vol -ume measurement tube connected with the inner cell. The cell pressure was applied using water in the outer container, while the vertical applied load system was the same as that used in the common triaxial system.
In order to monitor the sample volume change, we referred to the readings of the volume transducer connected to the inner cell. The water volume contained in the inner cell was the initial water volume. The volume changes of
the specimen were measured by monitoring the water flow
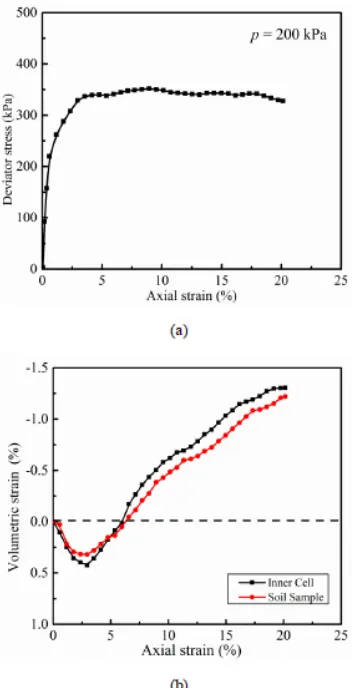
-ing out of (or into) the inner cell us-ing a volume transducer. Saturated silt soil was used to verify the system. The
basic properties of the silt soil were the specific gravity Gs = 2.69, plastic index Ip = 6.8, and initial water content wn = 24.6%, the initial void ratio was 0.852. The specimen
was saturated, consolidated and sheared, respectively. There were two methods used to verify the volume measurement. Method A involved measuring the volume of water coming out (or into) of the saturated specimen, while for Method B the water volume change of the inner cell was measured. The results of volume changes with axial strain were obtained at a cell pressure of 200 kPa with a constant axial strain rate of 1 mm min-1 and all drainage
valves opened (Fig. 2a, b). The curves of volumetric strain obtained using the two methods were very similar. The vol-ume measured using the inner cell (Method B) was slightly smaller than that measured using Method A. This error may be acceptable for the tests.
In order to study the mechanical properties of wheat grain, it must be taken into account that a kernel of grain is not an inert material like most particles of soil. A ker-nel of grain is composed of a large number of different types of cells, which respond to the process of osmosis when exposed to moisture. In the lower moisture content range (below 16.0%), the grains are hard, brittle and have a smooth surface. The wheat used for the investigations was a winter wheat, grown in Henan Province, China. The fol-lowing physical properties were described.
1. Particle shape and particle size distribution curve
The particle shapes were quantified by the lengths of the major and minor axes (Fig. 3). The average major axis
(named as a) and minor axis (named as the average of b1
and b2) of twenty grains was 6.05 and 3.48 mm,
respective-ly. Consequently, the ratio of a/b ranges from 1.67 to 1.86.
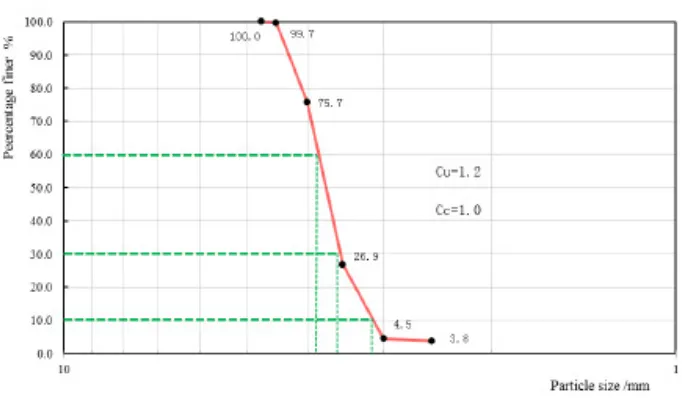
In terms of geotechnical engineering, the grading curve was a graphical representation of the particle-size distri- bution and was therefore useful in itself as a means of de- scribing the soil. By referring to soil, the particle-size distribution tests for the wheat granular material were con-ducted. The size of the cereal particles that constituted the wheat granular material were large enough to be inspected with the naked eye (Fig. 3). They constituted the coarse fractions of the wheat granular material. In the case of the coarse granular material, the usual process is a sieve analy-sis. It has been found that the size of most of the grains in the aggregate of wheat particles is within the limits given for only one fraction. The particle-size distribution curve was plotted as a semilogarithmic curve (Fig. 4). The general slope and shape of the distribution curve can be described
by means of the coefficient of uniformity (Cu) and the coef-ficient of gradation (Cc), which may be calculated from Eqs
(1) and (2), respectively. The results of the a/b ratio and particle-size distribution curve showed that the wheat was very uniform:
(1) Fig. 2. (a) Deviator stress versus the axial strain under pressure
(2)
where: D60 is the diameter of the wheat particles at which
60% of the particles are smaller, D30 is the diameter of the
wheat particles at which 30% of the particles are smaller, and D10 is the diameter of the wheat particles at which 10%
of the particles are smaller. 2. Bulk density tests
A mass of wheat grain consists of solid kernels of grain,
which contain water in their cells, and void spaces filled
with air. Changes in their packing pattern will further affect the bulk density and shear strength.
The granular mass is commonly considered to consist of a network of solid particles, enclosing voids of varying sizes. The void ratio of the samples is described by Eq. (3).
(3)
where: the specific gravity of wheat Gs is 1.31, which is
obtained by using the pycnometer method (Zeng et al., 2019), ρ is the density of the wheat mass, e is the void ratio, ρw= 1g cm-3. It should be noted that only the void
ratio of the wheat, which was usually present in the silos is discussed, particularly the medium dense to dense wheat discussed in this paper.
3. Moisture content measurement
In the study of wheat grain, the condition of free water is supposed never to encounter in the pore spaces of the grain mass. The moisture content in the wheat kernel is obtained.
According to ASAE S352.2 APR1988 (R2017), 10 g of
a representative wheat sample was placed in a dish, which was dried at 130oCin an oven for at least 19 h. The percent-age of moisture (wet basis) was calculated by dividing the loss in weight due to heating by the weight of the original sample and multiplying by 100. In this paper, the moisture content (wet basis) was 10.6% (w.b.), the moisture content (dry basis) of test sample was 11.9% (d.b.).
Fig. 3. Samples used in this paper (a); size of wheat grain (b).
A total of 21 triaxial compression tests were performed
using the modified triaxial apparatus. The strain-controlled tests were conducted with constant confining pressure dur
-ing each test. Cylindrical specimens were first consolidated under three confining pressures p of 50, 100, and 200 kPa and sheared at different shearing velocities v of 0.05, 0.1, 0.2, 0.5, and 1 mm min-1. The initial void ratio e
0 changed
by 0.465, 0.525, and 0.566. The detailed descriptions are shown in Table 1. When the axial strain reaches nearly 20%, the tests should be terminated.
Specimens were prepared by pouring a calculated mass of wheat into the mould, by addition with a spoon for loose
samples, five times for each specimen, each time the mate -rial was tamped using a steel rammer for dense samples but without destroying the grain particles. The density of
the wheat at a specified initial void ratio may be calculated
using Eq. (3), thus the calculated mass of wheat may be obtained.
During the tests, the axial load, axial displacement,
volume change and cell pressure were measured using different types of transducers, including load cell,
lin-ear variable differential transducers (LVDT) and volume change transducers. Both the LVDT for the axial displace -ment measure-ment and the load cell were mounted outside the triaxial chamber. All data were acquired automatically by a computer-controlled data acquisition system.
EXPERIMENTAL RESULTS
The typical experimental results are presented for wheat
with different void ratios under a confining pressure of
50 kPa (Fig. 5). The development of axial deviator stress-es and volumetric strains versus axial strain is prstress-esented (Fig. 5a). When larger strains are applied, the deviator stress increases quickly at the value of axial strain of 2.5% and Table 1. Test scheme
Test ID. Shearing velocity v (mm min-1)
Confining
pressure p (kPa)
Void ratio e0
A1(A2,A3) 0.05 50, 100, 200 0.465
B1(B2,B3) 0.1 50, 100, 200 0.465
C1(C2,C3) 0.2 50, 100, 200 0.465
C4(C5,C6) 0.2 50, 100, 200 0.525
C7(C8,C9) 0.2 50, 100, 200 0.566
D1(D2,D3) 0.5 50, 100, 200 0.465
E1(E2,E3) 1.0 50, 100, 200 0.465
Fig. 5. Stress-strain response at 50 kPa: (a) stress-strain curve; (b)
then tends to reach a steady value. The maximum devia-tor stress at the plateau strain increases with the decreasing void ratio, and the value ranges from 5 to 10%.
Moreover, a similar dilative pattern of wheat is
devel-oped with increasing axial strain (Fig. 5b). During the
shearing procedure, the increasing axial strain or deviator stress changes the dilation pattern from the initial contrac-tion to dilacontrac-tion. The initial contraccontrac-tion is marginal, an axial strain of only 1-2% occurs, and it is closely followed by dilation at a larger axial strain (greater than 3% axial strain).
The effects of the void ratio, confining pressure and
shearing velocity on the stress-strain response were also examined. The shear strength and volumetric strain decreases slightly with the increasing void ratio value
under a fixed shearing velocity (Figs 5-7). It showed that
with the initial void ratio decreasing from 0.566 to 0.465,
the negative volumetric strain increased significantly from -2.6 to -4.7% at the end of tests under a confining pressure
of 50 kPa. For samples with the same initial void ratio, the
final volumetric strain decreases with each increase in con
-fining pressure, and then the dilation is diminished (Fig. 8),
In order to discuss the shear resistance of wheat, the peak strength and the corresponding internal friction angle are discussed. The peak strength was evaluated using the maximum value of q/p, where p represents the confining
pressure, q represents the deviator stress defined as q = (σ1-σ3)/2. The maximum q/p value ranges from 1.268 to
1.655. Based on the experimental results, the ratio of q/p is
affected by the void ratio, confining pressure and shearing
velocities. The relationships between q/p, initial void ratio
e0 and shearing velocity may be elucidated (Fig. 9a, b). It
may be observed that the strength value is approximate-ly the same under different initial void ratio and shearing velocity values when p = 50 kPa and p = 100kPa, while the value of q/p is a bit lower under p = 200 kPa. It may be con-cluded that the effect of the material structure becomes less important and the monotonic shear strength ratio is lower at
higher confining pressure values.
The Mohr-Coulomb failure theory was used to obtain
various shear strength values to define the failure enve -lopes. The slope of the curve provides the angle of internal friction, which shows the peak state corresponding to the Fig. 7. Stress-strain response at 200 kPa: a) stress-strain curve, b)
shear resistance (Fig. 10). The intersection point between that curve and the y-axis provides the apparent cohesion value.
The internal friction angle of wheat in this paper ranges from 25.2 to 26.9° in Table 2, which were similar to the values reported in other publications and technical standards (Moya et al., 2006; Zeng et al., 2019b; ACI 313-97; BS EN1991-4-2006; GB 50077-2017). The internal friction angle is affected by both the shearing velocity and void ratio. The internal friction angle shows a slight decrease
with the void ratio, while there is no obvious trend for the effect of shearing velocities on internal friction angles under the range of shearing velocities from 0.05 to 1 mm min-1.
Three shearing states at the temporary state, the peak state, and post-peak state were considered in order to inves-tigate the friction angle at different volume change points. It should be noted that the friction angle obtained from the three shearing states is not the internal friction angle. For
the temporary state, the friction angle was defined as the
tested wheat was characterized by zero volume change. The peak state friction angle was determined when the peak value of deviator stress occurred. The post-peak state fric-tion angle was obtained at the end of the test. Three fricfric-tion angles corresponding to the temporary state, the peak state, and the end of the test were all estimated using the Mohr-Coulomb failure criterion.
In order to investigate the friction angles at the tem-porary state, peak state and at the end of the test for each specimen in detail, the effects of the different parameters on the friction angles are presented (Fig. 11). Among them, friction angles under the temporary state were compared with those of the peak state and the friction angles at the
end of the test. Note Fig. 11b for example, for a confining
pressure of 100 kPa with a shearing velocity of 0.2 mm min-1, the friction angles under the temporary state are 26.3,
26.1, and 25.0°, respectively. The friction angles under the peak state are 26.9, 26.4, and 25.9°, respectively. The fric-tion angles of the specimens at the end of the test are 25.6, 25.4, and 23.0° with the corresponding initial void ratios of 0.465, 0.525, and 0.566, respectively. It may be concluded from Fig. 11 that the friction angle decreases with increas-ing void ratio. Generally, the temporary state friction angles fall between the peak-state friction angles and the friction angles at the end of the test.
For different states during shearing, the effect of dif-ferent shearing velocities on friction angles are presented (Fig. 12). It may be observed that friction angles decrease with increasing shearing velocities. The general trend of the
influence of the shearing velocity on the friction angle is
Fig. 9. The relationships between: a) q/p and initial void ratio eo for v = 0.2 mm min-1; b) q/p and shearing velocity v for eo = 0.465.
Fig. 10. Mohr-Coulomb strength envelopes obtained for wheat.
Table 2. Values obtained for the internal friction angle from tri-axial test
Shearing velocity v (mm min-1)
Initial voidratio
e
Angle of internal friction φ
(degree)
0.05 0.465 25.8
0.10 0.465 25.3
0.20 0.465 26.9
0.20 0.525 25.9
0.20 0.566 25.5
0.50 0.465 26.7
similar to that presented in Fig. 11. The influence of confin -ing pressure on friction angles is presented (Fig. 13). It may
be concluded that the lowest friction angles occur at confin -ing pressure p = 200 kPa under different voids. The highest
friction angles under peak state occur at confining pressure p = 100 kPa, which is different than that under temporary state and at the end of the test.
The dilatancy angle ψ is defined as Eq. (4) according to
other researchers (Chakraborty and Saldago, 2010; Chen and Zhang, 2016):
(4) where: dεv represents volumetric strain increment and dε1
represents axial strain increment.
Fig. 12. Relationship between friction angles and shearing veloci
-ties under different confining pressures at eo = 0.465. Fig. 11. Relationship between friction angles and initial void
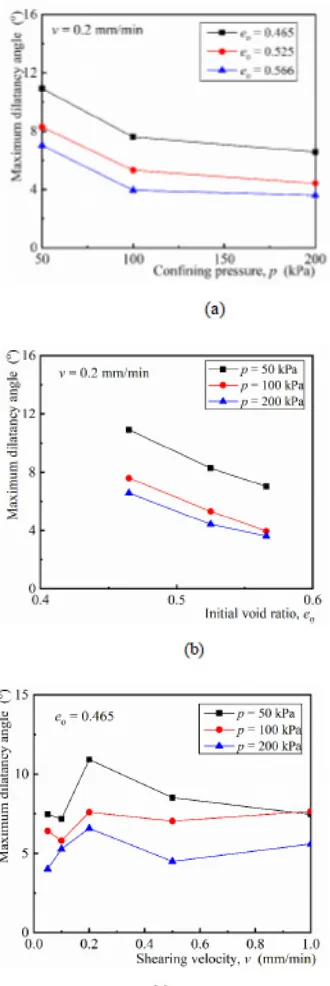
It may be observed that the maximum dilatancy angle
ψmax depends on both the void ratio and the confining pres
-sure value (Fig. 14). Higher dilatancy values are observed for denser samples. The large cell pressure diminished the dilatancy angle. In addition, the dilatancy angles are
affected by the shearing velocities. There are significant dif -ferences in dilatancy angles at different shearing velocities. The experimental results indicated that dilation behaviour was suppressed due to the reinforcement of increased
con-fining pressure. For the series of tests with an initial void
ratio of 0.465 and shearing velocity of 0.2 mm min-1, the
dilatancy angles are 10.9, 7.6, and 6.6°, corresponding to
confining pressures of 50, 100, and 200 kPa, respectively. For the confining pressure of 200 kPa, the dilatancy angles
are 6.6, 4.4, and 3.6° for the initial void ratios of 0.465, 0.525, and 0.566, respectively, with a shearing velocity of 0.2 mm min-1. It may be concluded that the dilatancy angles decrease with increasing confining pressures and increas -ing void ratios.
Fig. 13. Relationship between friction angles and confining pres
(Fig. 15). The zero dilative rate indicates the conversion from contraction to dilation during shearing. The dilation rate did not reach zero at the end of the test because of the limit of the apparatus displacement measurement. The calculated parameter K and φf was obtained using Eq. (5).
The values of parameter K are related to the axial strain
(Fig. 16), which fluctuates with the axial strain especially
after the peak states. The parameter K for each test was
pressure on the shear strength and dilatancy characteristics of wheat granular material. The following conclusions may be drawn based on the experimental study:
1. The shearing velocities have an influence on the shear
strength, internal friction angle and apparent cohesion. Also, the volumetric strain-axial strain response complied
with the dilatancy angles, which are influenced by confin -ing pressure.
2. All friction angles at three different states increase
with the decreasing void ratio, resulting in a significant
increase in shear strength. The dilatancy angles decrease
with increasing confining pressures, which range from 3.6
to 10.9°.
3. The stress-dilatancy relationship based on Rowe’s
equation was analysed for the tested wheat. The parameter K is closely related to the axial strain. The value of param-eter K ranges from 1.8 to 2.1, corresponding to a friction angle of 17.3 to 20.6° for the initial void ratio of 0.566, 0.525, and 0.465, respectively.
Conflict of interest: The Authors do not declare
con-flict of interest.
REFERENCES
ACI 313-97, 1997. Standard practice for design and construction of concrete silos and stacking tubes for storing granular materials, American Concrete Institute, Farmington Hills, MI. https://doi.org/10.14359/3390
ASAE S352.2 APR1988 (R2017), 2017. Moisture Measurement-Unground Grain and Seeds.
Ayuga F., Aguado P., Gallego E., and Ramirez A., 2005. New steps towards the knowledge of silos behaviour. Int. Agrophysics, 19(1), 7-17.
Ayuga F., Guaita M., and Aguado P., 2001. SE-structures and
environment: static and dynamic silo loads using finite ele
-ment models. J. Agric. Eng. Res., 78(3), 299-308. https://doi.org/10.1006/jaer.2000.0640
Bishop A.W. and Donald I.B., 1961. The experimental study of partly saturated soil in the triaxial apparatus. Proc. 5th Int. Conf. Soil Mechanics and Foundation Engineering, Vol. 1, 13-21, July, Paris, France.
Bolton M.D., 1986. Strength and dilatancy of sands. Géotechnique, 36(1), 65-78.
Fig. 15. Relationship between dεv/dε1 and axial strain of wheat for
different initial void ratios (p = 50 kPa, v = 0.2 mm min-1).
Fig. 16. Rowe’s model parameter K of wheat for different initial
Britton M.G. and Moysey E.B., 1986. Grain properties in the proposed new engineering practice on bin loads. ASAE Paper No. 864502. St. Joseph, MI, USA.
BS EN1991-4-2006. Eurocode 1-Actions on structures-Part 4: Silos and Tanks, European Committee for Standardization, Brussels.
Carson J.W., 2001. Silo failures: Case histories and lessons learned. Handbook of Powder Technology, 10, 153-166. https://doi.org/10.1016/s0167-3785(01)80017-8
Carson J. and Craig D., 2015. Silo design codes: Their limits and inconsistencies, 7th World Congr. Technol. (WCPT7). Procedia Eng., 102, 647-656.
https://doi.org/10.1016/j.proeng.2015.01.157
Chakraborty T. and Salgado R., 2010. Dilatancy and shear strength of sand at low confining pressures. J. Geotechnical
Geoenvironmental Eng., 136(3), 527-532.
https://doi.org/10.1061/(asce)gt.1943-5606.0000237 Chen X. and Zhang J., 2016. Influence of relative density on
dilatancy of clayey sand-fouled aggregates in large-scale triaxial tests. J. Geotechnical Geoenvironmental Eng., 142(10), 06016011.
https://doi.org/10.1061/(asce)gt.1943-5606.0001542 Dogangun A., Karaca Z., Durmus A., and Sezen H., 2009.
Cause of damage and failures in silo structures. J. Perfor- mance Constructed Facilities, 23(2), 65-71.
https://doi.org/10.1061/(asce)0887-3828(2009)23:2(65) Goodey R.J., Brown C.J., and Rotter J.M., 2017. Rectangular
steel silos: Finite element predictions of filling wall pres -sures. Eng. Struct., 132, 61-69.
https://doi.org/10.1016/j.engstruct.2016.11.023
GB 50077-2017. Standard for design of reinforced concrete silos. (in Chinese).
Guaita M., Couto A., and Ayuga F., 2003. Numerical simulation of wall pressure during discharge of granular material from cylindrical silos with eccentric hoppers. Biosystems engi-neering, 85(1), 101-109.
https://doi.org/10.1016/s1537-5110(03)00037-0
Hardin B.O., Hardin K.O., Ross I.J., and Schwab C.V., 1990. Triaxial compression, simple shear, and strength of wheat en masse. Trans. ASAE 33(3): 933-943.
https://doi.org/10.13031/2013.31420
Horabik J. and Molenda M., 2017. Distribution of static pres -sure of seed in a shallow model silo. Int. Agrophys., 31, 167-174. https://doi.org/10.1515/intag-2016-0038
Kobyłka R., Horabik J., and Molenda M., 2017. Numerical simulation of the dynamic response due to discharge initia-tion of the grain silo. Int. J. Solids Structures, 106-107,
27-37. https://doi.org/10.1016/j.ijsolstr.2016.12.001
Liu S.D., Zhou Z.Y., Zou R.P., Pinson D., Yu A.B., 2014. Flow characteristics and discharge rate of ellipsoidal particles in
a flat bottom hopper. Powder Technol., 253, 70-79. https://doi.org/10.1016/j.powtec.2013.11.001
Moya M., Aguado P. J., and Ayuga F., 2013. Mechanical proper-ties of some granular agricultural materials used in silo design. Int. Agrophys., 27(2), 181-193.
https://doi.org/10.2478/v10247-012-0084-9
Moya M., Ayuga F., Guaita M., and Aguado P., 2002. Mechanical properties of granular agricultural materials. Transactions of the ASAE, 45(5), 1569.
https://doi.org/10.13031/2013.11062
Moya M., Guaita M., Aguado P., and Ayuga F., 2006. Mechanical properties of granular agricultural materials, part 2. Transactions of the ASABE, 49(2), 479-489. https://doi.org/10.13031/2013.20403
Nielsen J., 1977. Model laws for granular media and powders with a special view to silo models. Archives of Mechanics, 29(4), 547-560.
Puri V.M., 2002. Characterizing powder flowability. Chemical
Processing, 65-39.
Ramírez A., Moya M., and Ayuga F., 2009. Determination of the
mechanical properties of powdered agricultural products and sugar. Particle and Particle Systems Characterization, 26(4), 220-230. https://doi.org/10.1002/ppsc.200800016 Ramírez A., Nielsen J., and Ayuga F., 2010. Pressure
measure-ments in steel silos with eccentric hoppers. Powder Technol., 201(1), 7-20.
https://doi.org/10.1016/j.powtec.2010.02.027
Rotter J.M., 2009. Silos and tanks in research and practice: state of the art and current challenges, Proc. Int. Association for Shell and Spatial Structures (IASS) Symp., Valencia
Evolution and Trends in Design, Analysis and Construction
of Shell and Spatial Structures. Universidad Politecnica de Valencia, Spain, 65-76.
https://doi.org/10.1260/026635109789043214
Rotter J.M., Holst J.M.F.G., Ooi J.Y., and Sanad A.M., 1998.
Silo pressure predictions using discrete-element and finite-element analyses. Philosophical Transactions of the Royal
Society of London. Series A: Mathematical. Physical and Eng. Sci., 356(1747), 2685-2712.
https://doi.org/10.1098/rsta.1998.0293
Rowe P.W., 1962. The stress-dilatancy relation for static equilib-rium of an assembly of particles in contact. Proceedings of
the Royal Society of London. Series A. Mathematical and
Physical Sciences, 269(1339), 500-527. https://doi.org/10.1098/rspa.1962.0193
Ruiz A., Couto A., and Aguado P.J., 2012. Design and instru -mentation of a mid-size test station for measuring static and dynamic pressures in silos under different conditions–Part II: Construction and validation. Computers and electronics in agriculture, 85, 174-187.
https://doi.org/10.1016/j.compag.2012.04.008
Stasiak M., Tomas J., Molenda M., Rusinek R., and Mueller P., 2010. Uniaxial compaction behaviour and elasticity of cohesive powders. Powder Technol., 203(3), 482-488.
https://doi.org/10.1016/j.powtec.2010.06.010
Thompson S.A. and Ross I.J., 1983. Compressibility and
fric-tional coefficients of wheat. Transactions of the ASAE, 26
(4), 1171-1176. https://doi.org/10.13031/2013.34099 Tripodi M.A., Puri V.M., Manbeck H.B., and Messing G.L., 1994.
Triaxial testing of dry, cohensive powder and its application
to a modified Cam-clay constitutive model. Powder
Technol., 80 (1), 35-43.
https://doi.org/10.1016/0032-5910(94)02843-5
Turner A.P., Montross M.D., McNeill S.G., Sama M.P., Casada M.E., Boac J.M., Bhadra R., Maghirang R.G., and Thompson S.A., 2016. Modeling the compressibility behavior of hard red wheat varieties. Transactions of the ASABE, 59 (3), 1029-1038.
urement of volume changes of an unsaturated or saturated soil specimen in triaxial testing. Geotechnical Testing J.,
26(3), 353-358. https://doi.org/10.1520/gtj11307j
Zeng C. and Wang Y., 2019a. Compressive behaviour of wheat
from confined uniaxial compression tests. Int. Agrophys.,
33(3): 347-354. https://doi.org/10.31545/intagr/110809
https://doi.org/10.1007/s10035-014-0533-1
Zhao Y., Cao Q.S., and Su L., 2013. Buckling design of large
circular steel silos subject to wind pressure. Thin-Walled
Structures, 73, 337-349.