Vol.7 (2017) No. 5
ISSN: 2088-5334
Context-aware-based Location Recommendation for Elderly Care
Kurnianingsih
#*, Lukito Edi Nugroho
#, Widyawan
#, Lutfan Lazuardi
+, Anton Satria Prabuwono
$#Department of Electrical Engineering and Information Technology, Universitas Gadjah Mada, Jl. Grafika No. 2, Yogyakarta
55281, Indonesia
*Department of Electrical Engineering, Politeknik Negeri Semarang, Jl. Prof. Soedharto Tembalang, Semarang 50275, Indonesia
E-mail: [email protected]; [email protected]; [email protected]
+Department of Public Health, Universitas Gadjah Mada, Jl. Farmako, Yogyakarta 55281, Indonesia
E-mail: [email protected]
$Faculty of Computing and Information Technology, King Abdulaziz University, P.O. Box 344, Rabigh 21911, Saudi Arabia
E-mail: [email protected]
Abstract
—
As adults age, the body declines. Living independently at home can be a significant challenge for the elderly, particularly for those who suffer from dementia or who have memory impairment. Assisting the elderly to live independently and safely in their own homes by providing appropriate services for them and ensuring that caregivers are immediately alerted in the event of an emergency is crucial. Utilizing context in the recommendation process will make recommendations more appropriate. A model of a context-aware-based location recommender system that can seamlessly monitor the location of the elderly and deliver appropriate location recommendations by considering context is proposed as our contribution. Two scenarios are investigated: (1) we classify location as follows: bedroom (class 1), dining room (class 2), and living room (class 3); (2) we classify location as follows: inside (class 1) and outside (class 2) the bedroom. We evaluate our proposed model using a distance measure concept by employing the cosine distance method. We compare the cosine distance method with fuzzy inference system (FIS) rules on labeled data. The results of the experiments for the first scenario show that the cosine distance has better average accuracy than the fuzzy inference system. For the second scenario, fuzzy c-means (FCM) has the same average accuracy as cosine distance. FCM has slightly better accuracy in class 1 compared to cosine distance (1% difference in accuracy), whereas cosine distance has slightly better accuracy in class 2 compared to the FCM (1% difference in accuracy). In general, we can draw the conclusion that, on this dataset, cosine distance which uses a simple algorithm produced better results than the fuzzy inference system which uses a more complex algorithm.Keywords— recommender system; context-aware; cosine distance; fuzzy inference system
I. INTRODUCTION
The movements of the body are controlled by a complex combination of cognitive and sensorimotor interaction. As adults age, their control over their body declines and leads to an array of behavioral decrements [1]. With age, bodily movements become slower and more variable and cognitive function decreases [2], leading to memory lapses and forgetfulness. Physiological changes due to a decline in functionality can affect an elderly person’s ability to respond and adapt to the surrounding environment. It often can be difficult for the elderly to sense changes in their vital signs, such as temperature or blood pressure due to their general functional decline. Living independently at home can be a
significant challenge for the elderly, particularly for those with dementia or those who suffer from memory impairment. However, a diagnosis of dementia does not mean that an elderly person is incapable of caring for themselves. Assisting the elderly to continue to live independently in their own homes by providing a context aware system to generate recommendations for appropriate services is crucial.
A set of initial ratings provided either by the users explicitly or inferred by the system implicitly is needed to start a recommendation process by estimating the rating function R.
Rating is an ordered set, whereas User and Item are the domains of the users and items, respectively. A recommendation for a user can be derived from the k highest-rated item of the function R which estimates the whole User × Item space. Content-based recommendation and collaborative filtering are recommendation systems which consider only the User and Item dimensions in the recommendation process and are called two-dimensional (2D) or traditional recommendation systems. Content-based recommendation analyzes a set of documents and/or items rated by a user, and builds a model based on the user's ratings [3]. The content-based recommendation process matches the attributes of the user against the attributes of an object. Collaborative filtering recommendation uses a set of user preferences for items to recommend additional items or products that the user might like [4]. The fundamental assumption behind collaborative filtering is that if users A and B give similar ratings to n items or have similar behaviors, they will rate or act on other items similarly. Recommender systems that combine two or more filtering techniques are called hybrid systems. These recommender systems aim to improve recommendation accuracy by overcoming the drawbacks of individual approaches. The work in [5] proposes a hybrid recommender system for personalized clinical prescription that employs neural networks and case-based reasoning. However, traditional recommender systems face several issues that can affect their performance [6]. The first issue is a scarcity of data points required to describe the exact context which is due to the limited number of user ratings which affects the accuracy of recommendations [7]. The second issue is the cold start problem which occurs when users or items are new to the system hence the system has insufficient information on the new users [8]. The third issue is scalability as recommender systems need to parse a huge volume of data in real time which results in increased processing time and reduces accuracy [6, 7].
Adding more dimensions in the context will make recommendations more accurate. Context is any information which can characterize the situation of an entity, such as a person, place, or object that is relevant to the interaction between a user and an application, including location, time, activities, and preferences [9]. Context-awareness uses context information to extract, interpret and adapt its functionality to the current context of use [10]. Context-aware-based recommendation acquires and utilizes information on an entity to provide appropriate services to a particular object, such as a person, place, time, and event. Considering the complexity, variety, and multi-dimensionality of context, it is not an easy task to identify and specify which context is relevant for a system [11]. Procedures and techniques which are interrelated for each situational purpose need to be developed, hence usability is the main consideration in designing and developing a context-aware system [12].
Recommender systems have been widely used in many domain applications and are very popular in e-commerce applications. A collaborative health-care system model (COHESY) was developed utilising mobile devices and technology for home care patient monitoring using collaboration techniques and classification algorithms to
generate recommendations and suggestions for preventive intervention and also enables the patient to contact other people suffering from a similar condition and exchange information on their experience [13]. iDoctor was developed to provide a user with professionalized and personalized medical recommendations through mining user emotions and preferences from user ratings and reviews of doctors [14]. A social media-based recommender system using a fuzzy-based model was developed to make recommendations by considering a user's own health concerns, the trustworthiness of the information providers, the similarity between the user and the information provider, and the test item's general acceptance on social media platforms [15]. However, the use of recommendation systems based on context-awareness in the area of health applications, particularly for home care for the elderly, is still rare.
In this paper, we propose a context-aware-based location recommender system that can seamlessly monitor the location of the elderly and deliver appropriate location recommendations by considering context. Assisting the elderly to live independently and safely in their own homes by providing appropriate services for them and ensuring that caregivers are immediately alerted in the event of an emergency is crucial. The contextual information in this study which influences recommendations is medical references, vital sign statistics, and the condition of the surrounding environment, such as time, temperature, humidity, and brightness. By dynamically learning the historical data of the patterns of an elderly person in a specific environment, recommendations can be adapted to match the elderly person’s needs.
The rest of this paper is organized as follows. Section 2 describes the materials and the method used. The results of our experiments and a discussion are presented in Section 3. Section 4 concludes the study and discusses suggestions for future work.
II. MATERIAL AND METHOD
In this section, we explain the experimental setup and the proposed method.
A. Material
derived from the sensors: day, hour, heart rate, skin temperature, ambient temperature, ambient humidity, room temperature, room humidity, and room luminosity. After conducting feature selection using t-test, we selected four features for our experiment: heart rate, skin temperature, ambient temperature, and ambient humidity.
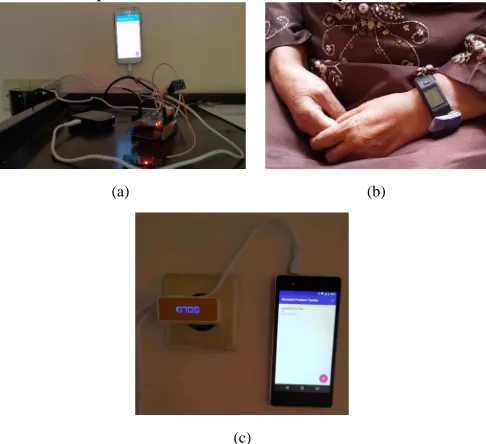
(a) (b)
(c)
Fig. 1 Experimental setup: (a) the three room sensors in the bedroom, namely temperature, humidity, and luminosity, were connected with the Arduino; (b) the wristwatch worn by the elderly subject to gather data on vital signs and ambient data; (c) a smartphone installed in the dining room
Fig. 2 Data collection diagram
Fig. 3 Detecting iBeacon signal
Three smartphones were installed in different rooms: the bedroom, the dining room, and the living room. An ibeacon was attached to the smartwatch worn by the elderly person to detect human presence and their behaviour. The Arduino is connected using a GPRS modem to send environmental data to the database server, whereas the smartphones send signal data received from an ibeacon using WiFi to the database server. The process of data collection is shown in Fig. 2.
The ibeacon sticker emits signals dynamically. Scanners are installed nearby on the smartphone to receive the iBeacon ID signals and the iBeacon signal strength (dB). The value of the ID signal and signal strength is sent to the Web Service and is stored in the database server, as shown in Fig. 3.
B. Method
In this section, we describe a context-aware-based recommender system using cosine distance, a context-aware-based recommender system using fuzzy inference system and the performance measures. The system learns to recommend items that are similar to the items recommended by the other respondents. The similarity of items is calculated based on the features associated with the compared items. The architecture of our proposed approach is shown in Fig 4.
In order to pre-process the data, the data from the wearable sensors embedded in the wristwatch and from the environmental sensors are collected and integrated into one table by synchronizing the time. Data might behave badly if the features do not comply with standard normally distributed data. Standardized features can be obtained by removing the mean and scaling to unit variance.
Fig. 4 Architecture of the proposed method
Real-world data usually has high dimensionality, which needs to be reduced. One popular dimensionality reduction technique is Singular Value Decomposition (SVD). The problem of (nonlinear) dimensionality reduction can be defined as follows. Assuming m ≥ n, SVD is defined as
A = UΣV T , (1) where U ∈ R
m×n
has orthonormal columns,
Σ∈ R
n×n is a diagonal matrix,
and V ∈ R
n×n is an orthogonal matrix.
The diagonal matrix Σ = diag(σ1,··· ,σn) must satisfy σ1 ≥ ···σn ≥ 0. σ1,··· ,σn are called the singular values of A.
removing redundant, irrelevant and noisy features from the dataset, the generalization capability and classification accuracy of the model can be improved. Feature selection is considered successful if the reduced data matrix represents the majority (>80%) of information contained in the original data. We used stratified 10-fold cross validation for 509 recorded data items and allocated 90% of the data for training and 10% for testing.
We compare the result of the cosine distance and fuzzy inference system to evaluate the performance of the algorithm in delivering location recommendations.
1) Cosine Distance Method: Cosine similarity is used to find the maximum value of the distance to calculate the distance matrix. Cosine similarity has been evaluated in the development of library recommender systems and showed better accuracy than other distance similarity measurements [16]. The cosine similarity metric finds the normalized dot product of two attributes to find the cosine of the angle between the two objects (vectors). The cosine of 0° is 1, and it is less than 1 for any other angle. Cosine similarity is particularly used in positive space, where the outcome is neatly bounded in [0,1]. One of the reasons for the popularity of cosine similarity is that it is very efficient to evaluate, especially for sparse vectors. A matrix is simply a table filled with values. Suppose this table consists of r number of rows and c number of columns. We refer to these as vectors. Thus, for a square matrix, one with the same number of rows and columns, row vectors are data sets of size n = c and column vectors are data sets of size n = r. A vector is a quantity or phenomenon with two independent properties: direction and magnitude. For n = 2 and n = 3, we can visualize a vector in its n-dimensional space as a line segment ending in an arrow. The orientation of the line segment is its direction while the length is its magnitude. Suppose and are the vectors, ‖ ‖ and are the vector lengths, the cosine similarity between two vectors is given by the expression
, = =‖ ‖. (2)
The similarity function creates a progressive ranking of the most similar users. The top-N items with the highest similarity degrees are then recommended to the user.
Algorithm 1: Cosine distance recommender
INPUT: day, hour, heart rate, skin temperature, ambient temperature, ambient humidity, room temperature, room humidity, room luminosity OUTPUT: recommended location
1. read raw data
2. scale attributes using StandardScaler 3. calculate SVD
4. split data into 10-folds 5. for roundNumber <-- 1 to 10
6. get train and test data for this fold 7. init similarity_score_dict with zeros 8. for i <-- 1 to length of data test
9. init similarity_scores with zeros
10. for j <-- 1 to length of data train
11. score <-- calculate cosine distance between i-th data test and j-th data train
12. add score into similarity_scores(j)
13. add similarity_scores into similarity_score_dict(i)
14. N most similar <-- 5 15. for i <-- 1 to length of data test
16. using similarity_score_dict, sort and find N-most
similar classes
17. known_classes <-- choose recommended class
based on most class appearances
18. total_true <-- check if chosen recommended class (known_classes) is the same as real class; 19. calculate accuracy for this fold
20. choose best model based on test accuracy
21. show recommender performance: KFold accuracy graph, classification reports
2) Fuzzy Inference System (FIS) Method: Fuzzy set theory was introduced by Lotfi Zadeh in 1965 [17]. Fuzzy logic has largely been used for analyzing uncertain situations and it is applicable in domains where the information is incomplete or imprecise [18]. A fuzzy recommender system framework has been used to assess a user’s preference based on fuzzy linguistic terms to address the issues of cold-start and sparsity [19]. The context-aware recommendation system employs the fuzzy set technique in conjunction with user-based and item-based filtering to deal with fuzzy product similarities. The Sugeno method is a fuzzy inference system (FIS) model that maps input to output using a superset of fuzzy logic. A given input is mapped to input membership functions to be continuously mapped to rules by decoding it with the IF-THEN rules [20]. Due to the rich information conveyed by the membership grade, a data object may belong to more than one cluster with different degrees of membership, called fuzzy clustering. Clustering is the process of partitioning a set of data into meaningful similar subclasses called clusters. Many real-world application domains require fuzzy clustering, such as the application of positional and confidence voting techniques [21], handling very large data [22] and patient stratification [23].
In this paper, a total of 509 recorded data items were clustered into several subclasses. Three methods of FIS rule generation, namely fuzzy c-means (FCM), fuzzy subtractive clustering (FSC), and grid partitioning, are compared to generate the number of FIS rules and identify the position of the clusters for a set of highly non-linear data for FIS.
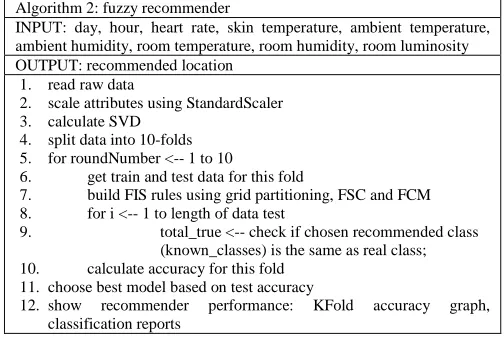
Algorithm 2: fuzzy recommender
INPUT: day, hour, heart rate, skin temperature, ambient temperature, ambient humidity, room temperature, room humidity, room luminosity OUTPUT: recommended location
1. read raw data
2. scale attributes using StandardScaler 3. calculate SVD
4. split data into 10-folds 5. for roundNumber <-- 1 to 10
6. get train and test data for this fold
7. build FIS rules using grid partitioning, FSC and FCM 8. for i <-- 1 to length of data test
9. total_true <-- check if chosen recommended class (known_classes) is the same as real class; 10. calculate accuracy for this fold
11. choose best model based on test accuracy
12. show recommender performance: KFold accuracy graph, classification reports
cluster, which marks the mean location of each cluster. In the initial condition, the center of the cluster is most likely incorrect. Additionally, each data point has a degree of membership for each cluster.
Algorithm 3: FCM clustering
INPUT: day, hour, heart rate, skin temperature, ambient temperature, ambient humidity, room temperature, room humidity, room luminosity OUTPUT: FIS rules
1. get input and target data 2. define FCM parameters
3. generate initial random U matrix (partition matrix) 4. while (error > min. error) and (t<max. iteration), do: 5. compute V matrix (cluster centers)
6. compute current objective function (P matrix) 7. calculate change in U matrix
8. compute P matrix error
9. set i=1
10. while i<num. of input var., do: 11. add FIS input var structure
12. set j=1
13. while j<num. of clusters, do:
14. compute MF parameters based on input
15. add the MF details into aforementioned
input FIS structure 16. add FIS output var structure 17. compute MF params based on output
18. add the MF details into aforementioned output FIS structure 19. combine input and output MFs as FIS rules
20. set input and output MFs data range
FSC is based on the size (potential) of the data points in a given space (variable). The basic concept of subtractive clustering is to determine the areas within a variable that have a high density of surrounding points. The point with the highest number of neighbors is chosen as the cluster center. The density of the point selected as the center of this cluster is reduced. Then, the algorithm selects another point with the most neighbors to be the next center of another cluster. This process is repeated until all points have been tested.
Algorithm 4: FSC clustering
INPUT: day, hour, heart rate, skin temperature, ambient temperature, ambient humidity, room temperature, room humidity, room luminosity OUTPUT: FIS rules
1. get input and target data
2. define subtractive clustering parameters 3. calculate data bound
4. data normalization
5. for each data point do: calculate initial potent value 6. find highest potent data point
7. while (iteration < max. iteration) or (findMore == zero), do:
8. calculate ratio
9. if ratio > accept ratio:
10. findMore =1
11. else if ratio > reject ratio:
12. calculate min. distance between max. point and
current cluster centers
13. if (ratio + min. distance) >= 1 :
14. findMore = 1
15. else : findMore = 2
16.
17. if findMore == 1:
18. set new cluster centers
19. increase cluster count
20. find another max. potent
21. else if findMore == 2:
22. set potent value of current highest potent to zero
23. find another max. potent
24. else : do nothing 25. increase iteration count 26. cluster centers normalization
27. calculate sigma
28. calculate U matrix for fuzzy input MFs
29. calculate K matrix for fuzzy output MFs using LSE 30. combine both input and output MFs as FIS rules
The grid clustering algorithm implements the value space of a variation of the multidimensional data structure of the grid file to organize the value space, which is called the grid structure. The patterns are handled as points in a d-dimensional value space and are randomly inserted into the grid structure. The points are stored according to their pattern values to preserve the topological distribution. A set of surrounding rectangular-shaped blocks partitions the value space and administers the value of the grid structure. In the initialization phase, the grid partitioning algorithm calculates the number of possible input member functions (MFs) based on the input data. Moreover, it defines the initial MF type and the number of FIS rules. Input MFs are built based on the number of input variables and the number of possible MFs previously calculated. The output MFs are solely based on the calculated number of FIS rules.
Algorithm 5: Grid clustering
INPUT: day, hour, heart rate, skin temperature, ambient temperature, ambient humidity, room temperature, room humidity, room luminosity OUTPUT: FIS rules
1. get input and target data 2. calculate number of input MFs 3. define initial MF type 4. calculate number of rules 5. set i=1
6. while i<num. of input var., do:
7. set j=1
8. while j<num. of MFs, do:
9. create input MFs
10. increase j
11. increase i
12. set i=1
13. while i<num. of rules, do:
14. create output MFs
15. increase i
16. combine input and output MFs as FIS rules
C. Performance Measures
In this section, we summarize the performance of our algorithms using a confusion matrix and a classification report. A confusion matrix is used to represent the recommended location of an elderly person, which includes: True Positives (TP), True Negatives (TN), False Positives (FP), False Negatives (FN).
Precision and recall are performance measures derived from the confusion matrix. Precision is the number of TP divided by the number of TP and FP. Precision can be defined as a classifiers exactness measure. A low precision indicates many FP.
= (3)
Recall is the number of TP divided by the number of TP and the number of FN. Recall can be defined as a classifier’s completeness measure. A low recall may indicate a large number of FN.
In order to combine precision and recall results, we consider the distribution of the F1 score. The F1 score is used to measure the accuracy of the detection performance using both recall and precision equally. A good performance on both recall and precision will be favored over extremely good performance on one and poor performance on the other. The F1 score is given by:
= 2 "#$%&'(')*"$%& ++#$%&'(')* $%& ++ (5)
III.RESULTS AND DISCUSSION
To recommend a suitable room location to an elderly person living independently at home, the classification problems were addressed in two scenarios. First, we classify the location of an elderly person as follows: bedroom (class 1), dining room (class 2), and living room (class 3). Second, we classify the locations in the home as follows: inside the bedroom (class 1) and outside the bedroom (class 2). In the second scenario, we consider the dining room and living room as outside the bedroom.
A. Cosine Distance Recommender
1) Implementation of the First Scenario
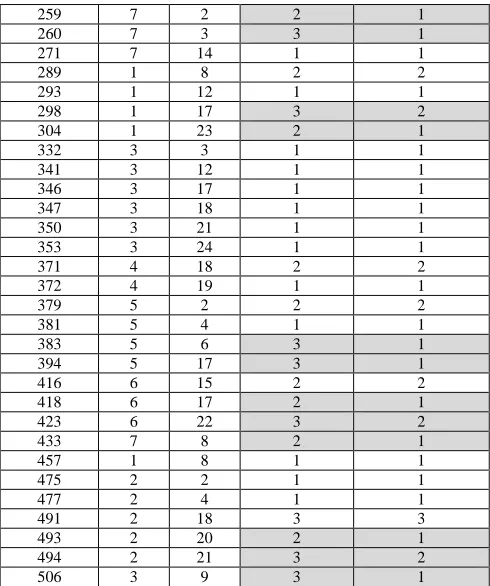
The results of the implementation of the first scenario in relation to the test data are shown in Table I. The grey shading shows a mismatch between the elderly person’s actual location and the recommended location. From the sample of 51 test data shown in Table 1, the following observations can be made. Test data 109 shows that on Sunday (day 7) at 2000 hours (8 pm), the elderly person was recommended to be in the bedroom (class 1) in order to prepare for sleep. This location recommendation was the same as the elderly person’s actual location. As another example, test data 199 shows that on Thursday (day 4) at 1400 hours (2 pm), the elderly person was recommended to have lunch in the dining room (class 2), but the actual location of the elderly person was the bedroom (class 1).
TABLEI
FIRST SCENARIO FOR LOCATION RECOMMENDATION USING TEST DATA
No of Data Day Hour Actual Location
Recommended Location
3 3 10 2 1
17 3 24 1 1
22 4 5 1 1
89 6 24 3 1
91 7 2 1 1
97 7 8 1 1
109 7 20 1 1
116 1 3 1 1
120 1 7 2 1
140 2 3 1 3
173 3 12 1 1
183 3 22 1 3
188 4 3 2 1
199 4 14 1 2
213 5 4 1 1
220 5 11 1 1
229 5 20 2 1
233 5 24 1 1
235 6 2 2 1
236 6 3 1 2
256 6 23 2 2
259 7 2 2 1
260 7 3 3 1
271 7 14 1 1
289 1 8 2 2
293 1 12 1 1
298 1 17 3 2
304 1 23 2 1
332 3 3 1 1
341 3 12 1 1
346 3 17 1 1
347 3 18 1 1
350 3 21 1 1
353 3 24 1 1
371 4 18 2 2
372 4 19 1 1
379 5 2 2 2
381 5 4 1 1
383 5 6 3 1
394 5 17 3 1
416 6 15 2 2
418 6 17 2 1
423 6 22 3 2
433 7 8 2 1
457 1 8 1 1
475 2 2 1 1
477 2 4 1 1
491 2 18 3 3
493 2 20 2 1
494 2 21 3 2
506 3 9 3 1
The recommended location and the actual location can be plotted as shown in Fig. 5. The red star plot denotes the recommended location (predicted) and the blue circle denotes the actual location (true). If the red star coincides with the blue circle, this denotes that the actual location of the elderly person is the same as the recommended location. If not, the locations do not match.
Fig. 5 Prediction of recommended location for the first scenario
TABLEII
ACCURACY TEST OF EACH FOLD FOR THE FIRST SCENARIO
Fold Fold Sizes Accuracy Test
Class 1 Class 2 Class 3
1 27 16 9 51.92%
2 27 16 9 46.15%
3 27 15 9 56.87%
4 27 15 9 33.33%
5 27 15 9 47.06%
6 27 15 9 52.94%
7 26 15 9 38%
8 26 15 9 40%
9 26 15 9 48%
10 26 15 9 48%
Table III shows the confusion matrix of the best model at the third fold, as shown in Table II. The number of times the cosine distance methods correctly recommend class 1, class 2 and class 3 as the actual location is 23, 5 and 1, respectively. Class 1 is incorrectly recommended as the actual location instead of class 2 and class 3 twice. Class 2 is incorrectly recommended as the actual location instead of class 1 ten times. Class 3 is incorrectly recommended as the actual location instead of class 1 five times and incorrectly recommended as the actual location instead of class 2 three times. From the confusion matrix, we calculate that the F1 score to measure the performance accuracy of the recommender system for class 1, class 2, and class 3 is 0.71, 0.40, and 0.17, respectively. If one of these results is more than 0.50, this indicates that the performance of the cosine distance recommender is good for this dataset. The total processing time using cosine distance for the first scenario is 19.72 seconds.
TABLEIII
CONFUSION MATRIX FOR THE FIRST SCENARIO
Actual
Recommended
1 2 3
1 23 2 2
2 10 5 0
3 5 3 1
2) Implementation of the Second Scenario
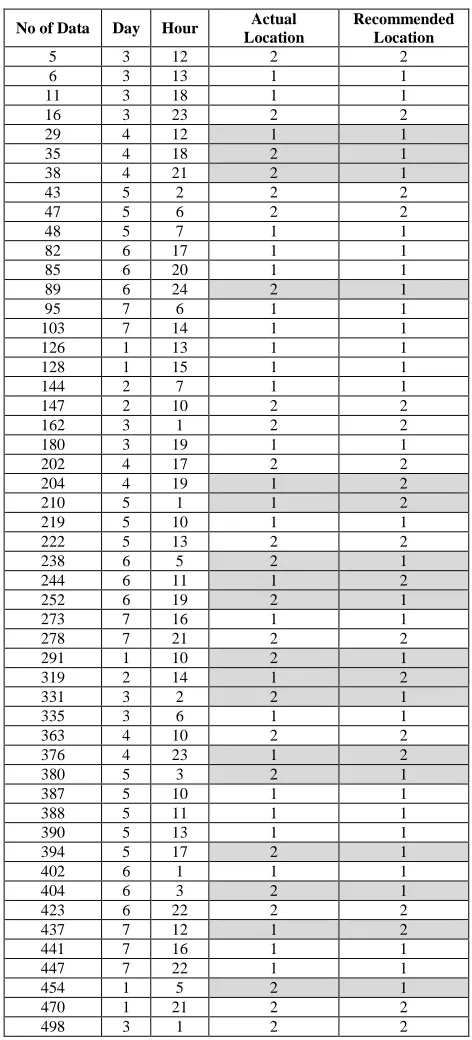
The results of the implementation of the second scenario using the test data are shown in Table IV. We classified the location of the elderly person as follows: class 1 denotes inside the bedroom and class 2 denotes outside the bedroom. The grey shading shows a mismatch between the actual location and the recommended location. From the sample of 50 test data shown in Table IV, the following observations can be made. Test data 437 shows that on Sunday (day 7) at 12.00pm, the elderly person was recommended to be in a location outside the bedroom (class 2), but the actual location of the elderly person was inside the bedroom. The elderly person’s historical pattern of behaviour at 12.00pm is to have lunch, hence the recommendation system recommends a location to the elderly person which is outside the bedroom. As another example, test data 273 shows that on Sunday (day 7) at 16.00 hours (4.00pm), the elderly person was recommended to be located in the bedroom,
which is the actual location of the elderly person at that time (class 1).
TABLEIV
SECOND SCENARIO FOR LOCATION RECOMMENDATION USING TEST DATA
No of Data Day Hour Actual Location
Recommended Location
5 3 12 2 2
6 3 13 1 1
11 3 18 1 1
16 3 23 2 2
29 4 12 1 1
35 4 18 2 1
38 4 21 2 1
43 5 2 2 2
47 5 6 2 2
48 5 7 1 1
82 6 17 1 1
85 6 20 1 1
89 6 24 2 1
95 7 6 1 1
103 7 14 1 1
126 1 13 1 1
128 1 15 1 1
144 2 7 1 1
147 2 10 2 2
162 3 1 2 2
180 3 19 1 1
202 4 17 2 2
204 4 19 1 2
210 5 1 1 2
219 5 10 1 1
222 5 13 2 2
238 6 5 2 1
244 6 11 1 2
252 6 19 2 1
273 7 16 1 1
278 7 21 2 2
291 1 10 2 1
319 2 14 1 2
331 3 2 2 1
335 3 6 1 1
363 4 10 2 2
376 4 23 1 2
380 5 3 2 1
387 5 10 1 1
388 5 11 1 1
390 5 13 1 1
394 5 17 2 1
402 6 1 1 1
404 6 3 2 1
423 6 22 2 2
437 7 12 1 2
441 7 16 1 1
447 7 22 1 1
454 1 5 2 1
470 1 21 2 2
498 3 1 2 2
Fig. 6 Prediction of recommended location for the second scenario
TABLEV
ACCURACY TEST OF EACH FOLD FOR THE SECOND SCENARIO
Fold Fold Sizes Accuracy Test Class 1 Class 2
1 27 25 48.08%
2 27 25 57.69%
3 27 24 54.90%
4 27 24 66.67%
5 27 24 50.98%
6 27 24 49.02%
7 26 24 40%
8 26 24 48%
9 26 24 52%
10 26 24 50%
The results of the accuracy test for the second scenario using cosine distance is depicted in Table V. The maximum value of accuracy was 66.67% at the fourth fold. This result shows that the model for the second scenario was better than for the first scenario by obtaining an accuracy score of approximately 56.87%. The total processing time using cosine distance for the second scenario is 20.09 seconds.
TABLEVI
CONFUSION MATRIX FOR THE SECOND SCENARIO
Actual
Recommended
1 2
1 21 6
2 11 13
Table VI shows the confusion matrix of the best model at the fourth fold in Table V. From the test data, it can be seen that the number of true recommendations for a location inside the bedroom and outside the bedroom are 21 and 13, respectively, whereas the number of false recommendations for inside the bedroom and outside the bedroom is 6 and 11, respectively. From the confusion matrix, we calculate the F1 score to measure the performance accuracy of the recommender system for class 1 and class 2 to be 0.71 and 0.60, respectively. The results reveal that the cosine distance method can accurately recommend a location to the elderly person.
B. Fuzzy Recommender
1) Implementation of the First Scenario
The result of the implementation of the first scenario using the three methods of FIS rule generation, namely FCM, FSC and grid partitioning, are shown in the plot diagram in Fig. 7 (a), (b), (c), respectively. If the red star coincides with the blue circle, this denotes that the actual location of the elderly person is the same as the recommended location. Otherwise, the locations do not match.
(a)
(b)
(c)
A comparison of the results of the accuracy test for the three methods of FIS for K=10 fold is depicted in Table VII. The maximum accuracy values of FCM, FSC, and grid partitioning are 36% at the seventh fold, 49.02% at the sixth fold, and 52.94% at the third to sixth fold, respectively. The results show that the grid partitioning method in the first scenario is better than the others, having an accuracy of 52.94%.
TABLEVII
ACCURACY TEST COMPARISON OF EACH FOLD FOR THE FIRST SCENARIO
Fold
Fold Sizes Accuracy Test Class
1
Class 2
Class
3 FCM FSC GRID
1 27 16 9 32.69% 44.23% 51.92%
2 27 16 9 30.77% 34.62% 51.92%
3 27 15 9 23.53% 43.14% 52.94%
4 27 15 9 31.37% 37.25% 52.94%
5 27 15 9 33.33% 45.10% 52.94%
6 27 15 9 35.29% 49.02% 52.94%
7 26 15 9 36% 24% 52%
8 26 15 9 28% 42% 52%
9 26 15 9 32% 40% 52%
10 26 15 9 30% 34% 52%
TABLEVIII
CONFUSION MATRIX OF THE THREE METHODS OF RULE GENERATION FOR THE FIRST SCENARIO
Actual
Recommended
FCM FSC GRID
1 2 3 1 2 3 1 2 3
1 3 23 0 16 9 2 27 0 0
2 0 15 0 7 8 0 15 0 0
3 0 9 0 7 1 1 9 0 0
Table VIII compares the confusion matrix of the best model from each method, FCM, FSC, and grid partitioning. The number of times FCM, FSC, and grid partitioning methods correctly recommend class 1 as the actual location is 3, 16, and 27, respectively. The number of times FCM, FSC, and grid partitioning methods correctly recommend class 2 as the actual location is 15, 8, and 0, respectively. The number of times FCM, FSC, and grid partitioning methods correctly recommend class 3 as the actual location is 0, 1, and 0 respectively. These results show that FCM and grid partitioning are not able to recommend class 3 as a location.
TABLEIX
PERFORMANCE EVALUATION OF THE FIRST SCENARIO
Class
F1 Score
FCM FSC GRID
1 2 3
1 0.21 0.56 0.69
2 0.48 0.48 0
3 0 0.17 0
The performance evaluation of the first scenario as shown in Table IX reveals that FCM could not detect a recommendation for class 3, whereas grid partitioning could not detect a recommendation for class 2 and class 3. These results show that FSC is a better method of rule regeneration than the others for the fuzzy recommender system with the following accuracy for each class: 0.56 accuracy for class 1, 0.48 accuracy for class 2, and 0.17 accuracy for class 3. The total processing time for the first scenario for FCM, FSC, and grid partitioning is 1.01 seconds, 6.41 seconds, 0.44 seconds, respectively.
2) Implementation of the Second Scenario
We classified the location of the elderly person as follows: inside the bedroom and outside the bedroom. The results of the implementation of the second scenario using the three methods of FIS rule generation, FCM, FSC and grid partitioning, are shown in plot diagram in Fig. 8 (a), (b), (c) respectively. If the red star coincides with the blue circle, this denotes that the actual location of the elderly person is the same as the recommend location. Otherwise, the locations do not match.
(a)
(c)
Fig. 8 Prediction of recommended location for the second scenario: (a) FCM, (b) FSC, (c) grid partitioning
A comparison of the accuracy results for the second scenario for K=10 fold is depicted in Table X. The maximum accuracy values of FCM, FSC, and grid partitioning are 66.67% at the fourth fold, 55.77% at the first fold, and 52.94% at the third fold to the sixth fold, respectively. These results show that the FCM method in the second scenario is better than the others, with an accuracy of 66.67%.
TABLEX
ACCURACY TEST COMPARISON OF EACH FOLD FOR THE SECOND SCENARIO
Fold
Fold Sizes Accuracy Test Class
1
Class
2 FCM FSC GRID
1 27 25 53.85% 55.77% 51.92%
2 27 25 53.85% 44.23% 51.92%
3 27 24 50.98% 49.02% 52.94%
4 27 24 66.67% 52.94% 52.94%
5 27 24 41.18% 49.02% 52.94%
6 27 24 47.06% 52.94% 52.94%
7 26 24 46% 52% 52%
8 26 24 44% 46% 52%
9 26 24 52% 50% 52%
10 26 24 42% 48% 52%
TABLEXI
CONFUSION MATRIX OF THE THREE METHODS OF RULE GENERATION FOR THE SECOND SCENARIO
Actual
Recommended
FCM FSC GRID
1 2 1 2 1 2
1 22 5 22 5 27 0
2 12 12 18 7 24 0
Table XI compares the confusion matrix of the best model for the three methods of rule generation: FCM, FSC and grid partitioning. The number of times FCM, FSC, and grid partitioning methods correctly recommend class 1 as the actual location is 22, 22, and 27, respectively. The number of times FCM, FSC, and grid partitioning methods correctly recommend class 2 as the actual location is 12, 7, and 0, respectively.
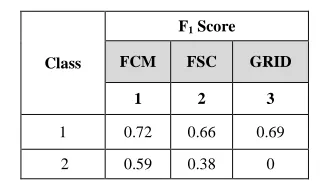
TABLEXII
PERFORMANCE EVALUATION OF THE SECOND SCENARIO
Class
F1 Score
FCM FSC GRID
1 2 3
1 0.72 0.66 0.69
2 0.59 0.38 0
The performance evaluation of the second scenario in Table XII shows that grid partitioning could not detect a recommendation for class 2. FCM has an F1 score of 0.72 accuracy for class 1 and 0.59 accuracy for class 2, whereas FSC has a F1 score of 0.66 accuracy for class 1 and 0.38 accuracy for class 2. The results reveal that FCM is better than the other methods in generating rules for this case of location recommendation. The total processing time for the second scenario for FCM, FSC, and grid partitioning is 1.16 seconds, 6.27 seconds, 0.44 seconds, respectively.
IV.CONCLUSIONS
This paper proposed a model of location recommendation for the elderly based on context awareness. Two scenarios of implementation using two algorithms for recommender systems were evaluated: the cosine distance recommender and the fuzzy recommender. The top-N recommendations with the highest similarity degrees are then recommended to the elderly. The top-N recommendations show the most chosen similar item after being ranked. We decided on the top-5 most chosen items. Cosine similarity is used in the cosine distance recommender to find the maximum value of the distance to calculate the distance matrix, whereas, in the fuzzy recommender, clustering is used to determine the similarity between two objects.
In the first scenario, we classified the location of an elderly person as follows: bedroom (class 1), dining room (class 2), and living room (class 3). In the second scenario, we classified the location of an elderly person as follows: inside the bedroom (class 1) and outside the bedroom (class 2). Thus, the dining room and the living room are both outside the bedroom.
whereas for the fuzzy inference system, creating rules from the data training is the complex phase and it takes only one time. Once the rules are generated, the test data is applied to get the optimal recommendation. The results of the processing time for the first scenario and the second scenario as detailed in Table XV.
For our future work, we aim to evaluate this model with other open data sets for a location recommender system in order to test the users’ experiences and develop new metrics for the field of location recommender systems for the elderly. The offline evaluation of these data sets can be improved by using an online evaluation for a location recommender system. The actual reactions of the users from online data might differ drastically from predictions made from offline data.
TABLEXIII
SUMMARY OF PERFORMANCE COMPARISON FOR THE FIRST SCENARIO
Class
F1 Score
Cosine
Distance FCM FSC GRID
1 1 2 3
1 0.71 0.21 0.56 0.69
2 0.40 0.48 0.48 0
3 0.17 0 0.17 0
TABLEXIV
SUMMARY OF PERFORMANCE COMPARISON FOR THE SECOND SCENARIO
Class
F1 Score
Cosine
Distance FCM FSC GRID
1 1 2 3
1 0.71 0.72 0.66 0.69
2 0.60 0.59 0.38 0
TABLEXV
SUMMARY OF PROCESSING TIME COMPARISON
Scenario
Processing Time (seconds)
Cosine
Distance FCM FSC GRID
1 1 2 3
First 19.72 1.01 6.41 0.44
Second 20.09 1.16 6.27 0.44
REFERENCES
[1] C.J. Ketcham and G.E. Stelmach, “Movement Control in the Older Adult” Technology for Adapative Aging, The National Academies Press, pp. 64-92, 2004.
[2] A.W. Kaszniak, L.W. Poon and W. Riege, Assessing memory deficits: An information processing approach. L.W. Poon, T. Crook, K.L. Davis, C. Eisdorfer, B.J. Gurland, A.W. Kaszniak, L.W. Thompson Eds., Handbook for clinical memory assessment for older
adults, Washington, D.C.: American Psychological Association, pp.
168-188, 1986.
[3] P. Lops, M. Gemmis, and G. Semeraro, Content-based Recommender Systems: State of the Art and Trends, F. Ricci et al. Eds., Recommender Systems Handbook, pp. 73 -105, 2011.
[4] X. Su and T.M. Koshgoftaar, A Survey of Collaborative Filtering Techniques, Advances in Artificial Intelligence, vol. 2009, pp. 1-19, 2009.
[5] Q. Zhang, G. Zhang, J. Lu and D. Wu, “A framework of hybrid recommender system for personalized clinical prescription”, in Proc.
ISKE’15, 2015, p. 189-195.
[6] O. Khalid, M.U.S Khan, S.U. Khan, and A.Y. Zomaya, “OmniSuggest: A Ubiquitous Cloud-Based Context-Aware Recommendation System for Mobile Social Networks,” IEEE
Transactions on Services Computing, vol. 7, pp. 401-414, 2014.
[7] J. Bobadilla, F. Ortega, A. Hernando, A. Gutiérrez, “Recommender system survey,” Knowl Based Syst, vol. 46, pp. 109-132, 2013. [8] A. Abbas, L. Zhang, and S.U. Khan, “A survey on context-aware
recommender system based on computational intelligence techniques,” Computing, vol. 97, pp. 667-690, 2015.
[9] A.K. Dey, “Understanding and using context”, Personal and
Ubiquitous Computing, vol. 5, pp. 4-7, 2001.
[10] H.E. Byun, and K. Cheverst, “Utilizing context history to provide dynamic adaptations”, Applied Artificial Intelligence, vol. 18, pp. 533-548, 2004.
[11] C. Bauer, and A.K. Dey, “Considering context in the design of intelligent system: Current practices and suggestions for improvements,” The Journal of Systems and Software, 112, pp. 26-47, 2016.
[12] N.A. Bradley, and M.D. Dunlop, “Towards a multidisciplinary model of ‘context’ to support context-aware computing,” Journal of
Human-Computer Interaction, vol. 20, pp. 403-446, 2005.
[13] V. Trajkovik, and E. Vlahu-Gjorgievska, “Use of collaboration techniques and classification algorithms in personal healthcare,”
Health Technol, vol. 2, pp. 43-55, 2012.
[14] Y. Zhang, M. Chen, D. Huang, D. Wu, Y. Li, “iDoctor: Personalized and professionalized medical recommendations based on hybrid matrix factorization,” Future Generation Computer
Systems, vol. 66, pp. 30-35, 2017.
[15] J. Li, and N. Zaman, “Personalized Healthcare Recommender Based on Social Media,” in Proc. AINA’14, 2014, p. 993-1000.
[16] S.B. Shirude, and S.R. Kolhe, “Measuring Similarity between User Profile and Library Book,” in Proc. ISCON’14, 2014, p. 50-54. [17] L.A. Zadeh, “Fuzzy sets,” InfControl, vol. 8, pp. 338–353, 1965. [18] P. Engelbrecht, Computational intelligence: an introduction, Wiley
Press, NewYork, 2007.
[19] L. Cheng, and H. Wang,“A fuzzy recommender system based on the integration of subjective preferences and objective information,”
Applied Soft Computing, vol. 18, pp. 290–301, 2014.
[20] F. Cavallaro and L. Ciraolo, “Design and implementation of a fuzzy inference model for mapping the sustainability of energy crops,” Soft
Computing Applications for Renewable Energy and Energy Efficiency; M. García-Cascales, J.M. Sánchez-Lozano, A.D.
Masegosa, C. Cruz-Corona, Eds., IGI Global: Hershey, PA, USA, 2015.
[21] A.F.X. Sevillano and J. Socor, “Positional and confidence voting based consensus functions for fuzzy cluster ensembles,” Fuzzy Sets
and Systems, vol. 193, pp. 1–32, 2012.
[22] T.C. Havens, J.C. Bezdek, C. Leckie, L.O. Hall and M. Palaniswami, “Fuzzy c-means algorithms for very large data,” IEEE Transactions
on Fuzzy Systems, vol. 20, pp. 1130–1146, 2012.
[23] H. Liu, R. Zhao, H. Feng, F. Cheng, Y. Fu and Y. Liu, “Entropy-based consensus clustering for patient stratification,” Bioinformatics, vol. 33, pp. 2691-2698, 2017.
[24] J. Dunn, “A fuzzy relative of the isodata process and its use in detecting compact well-separated clusters,” Journal of Cybernetics, vol. 3, pp. 32–57, 1973.
[25] J. Bezdek, Pattern Recognition with Fuzzy Objective Function