ISSN 0975-928X
Research Article
Correlation and path co- efficient analysis of grain quality attributes in
black gram (
Vigna mungo
L. Hepper)
Veni. K * 1., E. Murugan1, T. Radhamani1,2
1 Agricultural College and Research Institute, Department of Plant Breeding and Genetics, Madurai-625104 2
Tamil Nadu Rice Research Institute, Tamil Nadu Agricultural University, Aduthurai -612 101 *E-mail: [email protected], [email protected]
(Received:15 Dec 2014 ; Accepted:14 July 2015)
Abstract
Black gram (Vigna mungo L. Hepper) is one of the important pulse crops in India. India is the largest producer and consumer of black gram in the world. It contains about 26 percent protein which is almost three times that of cereals. It supplies a major share of protein requirement of vegetarian population of the country. 39 black gram genotypes were tested for 10 physical characters which determine seed quality. There were significant differences observed among the genotypes for 100 seed weight and volume before and after soaking, hydration capacity, swelling capacity, hydration index and swelling index. KUG 531 was found to have good physical characters such as swelling capacity, hydration index and swelling index. Swelling index was positively and significantly correlated with hydration capacity, swelling capacity and hydration index. Hydration capacity, swelling capacity and hydration index were found to be important attributes affecting cooking quality and cooking time to a greater extent. Path analysis, however, showed that hundred seed volume after soaking, dry seed density and hydration index were observed to have high positive direct effect on swelling index while other characters had negative effect on swelling index important for cooking quality. The study suggested that selection of swelling capacity and hydration capacity must be given preference along with optimum dry seed density in breeding for grain quality improvement.
Key words
Physical properties, seed quality, Correlation and Path analysis.
Introduction
Blackgram (Vigna mungo L. Hepper)(or) urd bean is one of the important pulse crops in India. India is the largest producer and consumer of blackgram in the world. It contains about 26 percent protein which is almost three times that of cereals. Blackgram supplies a major share of protein requirement of vegetarian population of the country. Blackgram is being grown over an area of 2.42 mega hectare with an annual production of 0.77 mega tonnes with productivity of 324 Kg/hectare in the country. Many varieties of blackgram are now being released by the plant breeder for commercialization and their selection depends on its nutritional value. In recent years there has been increasing interest in the functional potential of plant proteins. Prior to cooking, pulses are usually soaked in water from few hours to overnight in order to save time and energy to cook (Fernandes et al., 2010). Cooking also causes some physicochemical changes in pulses, including gelatinization of starch, denaturation of proteins, solubilisation of some of the polysaccharides, and softening and breakdown of the middle lamella, a cementing material found in the cotyledon (Wani et al., 2013). A number of sweets and recipes are prepared from blackgram. It is reported that seed weight, volume, density, hydration capacity (positively correlated to turbidity of starch),
swelling capacity (the amount of liquid material that can be absorbed) and swelling index (foaming ability) are important attributes, affecting grain nutritional quality as well its cooking quality (Ghose and Panda, 2006; Waldia et al., 1995; Waldia et al.,
1996; Ram Kumar et al., 1998 and Wani et al., 2013). The present study is aimed to assess the correlation and path analysis related to cooking quality.
Materials and methods
Grain sample of 39 blackgram genotypes were grown in the form of yield trial at Agricultural College and Research Institute, Madurai during kharif season of 2011-12 and harvested seed was used for the present study. One hundred seed weight were weighed in gram to get 100 seed weight. The same seeds were taken to find 100 seed volume and seed density. The physico-chemical tests like hydration capacity (ml/seed) and swelling index were determined by the methods used by other workers (Williams et al., 1983 and Ram Kumar et al., 1988). All the tests were carried out in triplicates and the mean values were used for the statistical analysis. The derived physical characters were taken as given below:
Seed weight:
ISSN 0975-928X
for 24 hours soaking in water. After soaking again the seed weight was taken.
Dry seed volume:
In measuring cylinder some quantity of water was taken and volume was recorded (V1 ml). Then 100 dry seeds were put in the cylinder and the raised volume (V2 ml) was recorded .The 100 dry seed volume would be = (V2 - V1) ml.
Soaked seed volume:
Some water was taken in measuring cylinder and volume was recorded (V3 ml). Then 24 hours soaked dried seeds were put in the cylinder and the raised volume (V4 ml) was recorded. The 100 soaked seed volume would be = (V4 - V3) ml.
Dry seed weight (100 seed) Density (dry seed) =
Dry seed volume (100 seed) in g ml-1
100 seed weight (soaked) Density (after soaked) =
100 seed volume (soaked) in g ml-1
(100 seed weight after soaking - dry seed weight) Hydration capacity =
100
Hydration capacity (100 seed) Hydration index = 100 seed weight (dry)
100 seed volume after soaking - 100 seed
volume before soaking Swelling capacity per seed =
100 seed
Swelling capacity (100 seed) Swelling index =
100 seed weight (dry seed)
The correlation were estimated as per Panse and Sukhatme (1961) and direct and indirect effects using the procedure suggested by Dewey and Lu (1956).
Results and discussion
Seed quality variation:
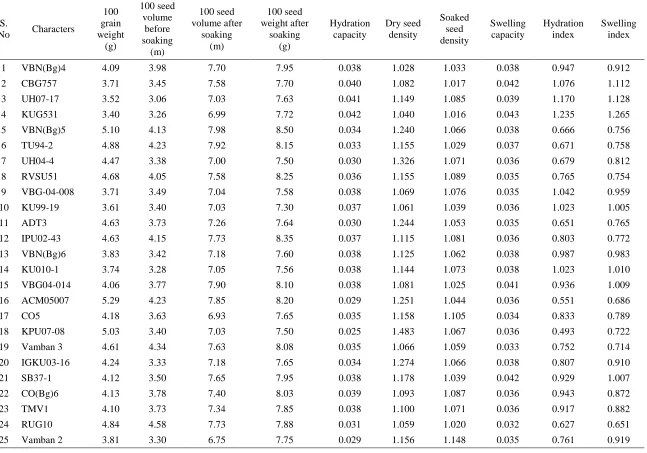
A perusal of the Table.1 revealed considerable variation for all the characters related to nutritional quality and cooking quality studied. The thirty nine varieties taken for this experiment had 100 seed weight varied from 3.36 to 5.39 g. The genotype KUG540 recorded minimum hundred seed weight (3.36 g) while VBG 66 recorded maximum hundred seed weight (5.29 g) and hundred seed volume before soaking varied from 3.06 to 4.58 ml. The genotype UH0717 possessed minimum 100 seed volume
genotype ACM 07001 recorded maximum 100 seed volume after soaking (8.03 ml) and Vamban 2 recorded minimum 100 seed volume after soaking (6.75 ml). The genotypes VBN07001 was found to have maximum 100 seed weight (8.65) after soaking, whereas the genotypes KUG 540 was found to have the minimum 100 seed weight after soaking (7.25g). Hydration capacity, a measure of intake of water by the grains was the lowest for the genotype PU08-2 was recorded low hydration capacity (0.025) and the genotype KUG531 was noticed higher hydration capacity (0.042). Dry seed density varied from 1.003 to 1.483. The genotype KPU 07-08 was found to produce maximum density (1.483). The higher density (1.189) was observed in VBG 07001 and the lower soaked seed density (0.938) was observed in ACM07001.The seed density decreased, as expected, after soaking by about 10%, through this decrease varied with the variety. Similar studies were conducted by Gosh and Panda (2006), Williams and Singh (1987), Waldia et al. (1996) and Ram Kumar
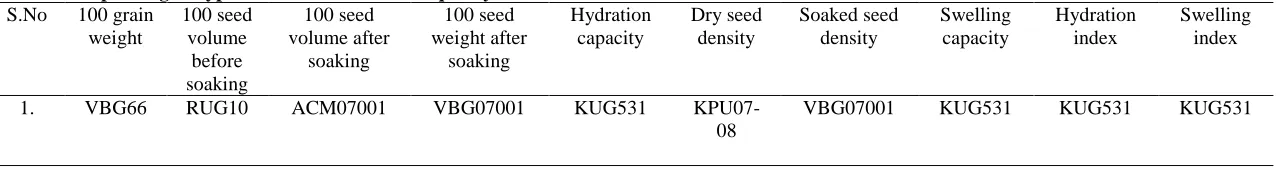
et al. (1998) and all these workers had reported considerable variation for the quality traits though in somewhat different crops. Swelling capacity varied from 0.032 to 0.043. The genotype KUG 531 was recorded higher swelling capacity (0.43), whereas the genotypes RUG 10 and TU 26 showed lower swelling capacity (0.032). Hydration index was higher (1.235) for genotype KUG 531 while the genotype KPU07-08 recorded for low hydration index (0.493). The genotype VBG 66 showed low swelling index (0.621) and the genotype KUG 531showed high swelling index (1.265). Based on the present studies, the genotypes viz., VBG66, RUG10, ACM07001, KUG531, KPU-07-08 and VBG07001were found to have very good physical characters were presented in table. 4. Therefore, these genotypes could be used as donor for further improvement through hybridization. Considering the variations present in the ten characters further correlations and path analysis were conducted to estimate degree of association among the characters as well direct and indirect effects for the cooking quality traits.
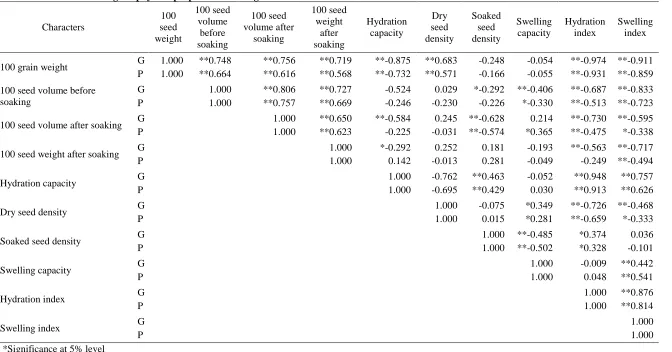
Correlation study:
ISSN 0975-928X
The results were in conformity with finding of Waldia et al. (1996) in chickpea and Zia-ur-Rehman and shah (1996) in chickpea.
Hence it is inferred that while going for selection of traits for physical properties of blackgram the traits
viz., hydration capacity, swelling capacity and hydration index to be given importance.
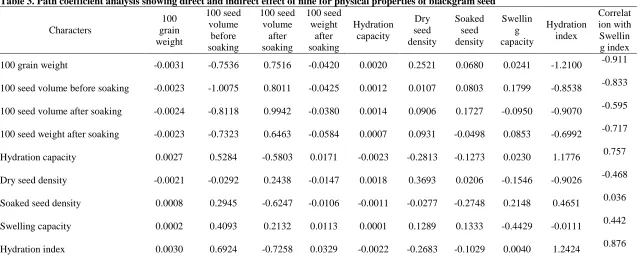
Path analysis:
The correlation was partitioned into direct and indirect effects by the path coefficient analysis (Table 3). Hundred seed volume after soaking (0.994), dry seed density (0.369) and hydration index (1.242) were observed to have high positive direct effect on swelling index while other characters had negative effect on swelling index. Hydration capacity exhibited very high positive indirect effect on swelling index through hydration index (1.178). Hydration index exhibited high positive indirect effect on swelling index through 100 seed volume before soaking (0.692). The results were in conformity with finding of Ghosh and Panda (2006). Based on the information of path analysis on swelling index, preference may be given to characters like hundred seed volume after soaking and hydration capacity of the seeds along with dry seed density and hydration index in breeding for cooking quality.
References
Dewey, D.R. and Lu, K.H. (1959). Agron. J.,51: 515-518.
Fernandes, A.C., Nishida, W., Da Costa Proenca, R.P., (2010). Influence of soaking on the nutritional quality of common beans (Phaseolus vulgaris L.) cooked with or without the soaking water: A review. Int. J. Food Sci. Technol.45: 2209–2218. Ghose and Panda. (2006). Legume Res., 29(1): 43-47. Panse, V.G. and Sukhatme (1961). Statistical Methods for
Agricultural Workers, ICAR, New Delhi.
Ram Kumar et al. (1998). Legume Res.,21: 33-36. Waldia, R.S. et al. (1991). Int. Chickpea Newsl., 24: 15-17. Waldia, R.S. et al. (1995). Int. Chickpea and Pigeonpea
Newsl.,2: 40-42.
Waldia, R.S. et al. (1996). J. Food Sci. Technol. Mysor., 33: 397-402.
Wani, I.A., Sogi, D.S., Gill, B.S., 2013. Physical and cooking characteristics of black gram (Phaseolus mungo L.) cultivars grown in India. Int. J. Food Sci. Technol. 48: 2557–2563.
Williams, P.C. and Singh, U. (1987). Nutritional quality and the evaluation of quality breeding
programmes. In: The Chickpea. (Saxena, M.C.; Singh, K.B. eds). CAB International. The International Centre for Agriculture Research in Dry Areas, Syria, Pp. 339-350.
Williams, P.C. et al. (1983). J. Sci. Food Agric.,34: 472-496.
ISSN 0975-928X
Table 1. Mean performance for physical properties of blackgram seed
S.
No Characters
100 grain weight
(g)
100 seed volume
before soaking
(m)
100 seed volume after
soaking (m)
100 seed weight after
soaking (g)
Hydration capacity
Dry seed density
Soaked seed density
Swelling capacity
Hydration index
Swelling index
1 VBN(Bg)4 4.09 3.98 7.70 7.95 0.038 1.028 1.033 0.038 0.947 0.912
2 CBG757 3.71 3.45 7.58 7.70 0.040 1.082 1.017 0.042 1.076 1.112
3 UH07-17 3.52 3.06 7.03 7.63 0.041 1.149 1.085 0.039 1.170 1.128
4 KUG531 3.40 3.26 6.99 7.72 0.042 1.040 1.016 0.043 1.235 1.265
5 VBN(Bg)5 5.10 4.13 7.98 8.50 0.034 1.240 1.066 0.038 0.666 0.756
6 TU94-2 4.88 4.23 7.92 8.15 0.033 1.155 1.029 0.037 0.671 0.758
7 UH04-4 4.47 3.38 7.00 7.50 0.030 1.326 1.071 0.036 0.679 0.812
8 RVSU51 4.68 4.05 7.58 8.25 0.036 1.155 1.089 0.035 0.765 0.754
9 VBG-04-008 3.71 3.49 7.04 7.58 0.038 1.069 1.076 0.035 1.042 0.959
10 KU99-19 3.61 3.40 7.03 7.30 0.037 1.061 1.039 0.036 1.023 1.005
11 ADT3 4.63 3.73 7.26 7.64 0.030 1.244 1.053 0.035 0.651 0.765
12 IPU02-43 4.63 4.15 7.73 8.35 0.037 1.115 1.081 0.036 0.803 0.772
13 VBN(Bg)6 3.83 3.42 7.18 7.60 0.038 1.125 1.062 0.038 0.987 0.983
14 KU010-1 3.74 3.28 7.05 7.56 0.038 1.144 1.073 0.038 1.023 1.010
15 VBG04-014 4.06 3.77 7.90 8.10 0.038 1.081 1.025 0.041 0.936 1.009
16 ACM05007 5.29 4.23 7.85 8.20 0.029 1.251 1.044 0.036 0.551 0.686
17 CO5 4.18 3.63 6.93 7.65 0.035 1.158 1.105 0.034 0.833 0.789
18 KPU07-08 5.03 3.40 7.03 7.50 0.025 1.483 1.067 0.036 0.493 0.722
19 Vamban 3 4.61 4.34 7.63 8.08 0.035 1.066 1.059 0.033 0.752 0.714
20 IGKU03-16 4.24 3.33 7.18 7.65 0.034 1.274 1.066 0.038 0.807 0.910
21 SB37-1 4.12 3.50 7.65 7.95 0.038 1.178 1.039 0.042 0.929 1.007
22 CO(Bg)6 4.13 3.78 7.40 8.03 0.039 1.093 1.087 0.036 0.943 0.872
23 TMV1 4.10 3.73 7.34 7.85 0.038 1.100 1.071 0.036 0.917 0.882
ISSN 0975-928X
26 PU08-2 3.46 3.21 7.30 7.73 0.021` 1.079 1.059 0.041 0.609 1.185
27 NDUK10-52 4.26 3.55 7.40 8.15 0.039 1.202 1.102 0.038 0.913 0.903
28 VBG07001 4.92 3.88 7.28 8.65 0.038 1.270 1.189 0.034 0.758 0.691
29 ACM07001 4.54 3.98 8.03 7.53 0.030 1.144 0.938 0.041 0.658 0.892
30 RVSU54 4.60 3.93 7.75 7.98 0.034 1.171 1.029 0.038 0.735 0.832
31 VBG06007 4.76 4.15 7.86 8.55 0.038 1.146 1.089 0.037 0.798 0.779
32 UH07-13 3.63 3.43 7.20 7.58 0.036 1.063 1.050 0.038 0.992 1.047
33 KKB05011 4.82 3.70 7.58 7.93 0.032 1.311 1.047 0.039 0.644 0.804
34 CO(Bg)761 4.72 3.28 7.25 7.65 0.030 1.441 1.056 0.040 0.623 0.844
35 KUG540 3.36 3.35 7.24 7.25 0.039 1.003 1.001 0.035 1.161 1.161
36 ACM07002 5.00 4.03 7.75 8.15 0.032 1.242 1.052 0.038 0.632 0.745
37 PU30 4.18 3.90 7.35 8.03 0.038 1.072 1.093 0.034 0.919 0.825
38 VB66 5.40 4.20 7.55 8.30 0.029 1.288 1.100 0.034 0.539 0.621
39 TU26 4.46 4.03 7.25 8.00 0.036 1.108 1.104 0.032 0.796 0.724
Mean 4.32 3.72 7.42 7.89 0.035 1.163 1.062 0.037 0.822 0.877
CD 0.200 0.435 0.518 0.523 0.005 0.130 0.068 0.004 0.136 0.111
ISSN 0975-928X
Table 2. Correlation among for physical properties of blackgram seed
Characters 100 seed weight 100 seed volume before soaking 100 seed volume after soaking 100 seed weight after soaking Hydration capacity Dry seed density Soaked seed density Swelling capacity Hydration index Swelling index
100 grain weight G
P 1.000 1.000 **0.748 **0.664 **0.756 **0.616 **0.719 **0.568 **-0.875 **-0.732 **0.683 **0.571 -0.248 -0.166 -0.054 -0.055 **-0.974 **-0.931 **-0.911 **-0.859
100 seed volume before soaking G P 1.000 1.000 **0.806 **0.757 **0.727 **0.669 -0.524 -0.246 0.029 -0.230 *-0.292 -0.226 **-0.406 *-0.330 **-0.687 **-0.513 **-0.833 **-0.723
100 seed volume after soaking G P 1.000 1.000 **0.650 **0.623 **-0.584 -0.225 0.245 -0.031 **-0.628 **-0.574 0.214 *0.365 **-0.730 **-0.475 **-0.595 *-0.338
100 seed weight after soaking G P 1.000 1.000 *-0.292 0.142 0.252 -0.013 0.181 0.281 -0.193 -0.049 **-0.563 -0.249 **-0.717 **-0.494
Hydration capacity G
P 1.000 1.000 -0.762 -0.695 **0.463 **0.429 -0.052 0.030 **0.948 **0.913 **0.757 **0.626
Dry seed density G
P 1.000 1.000 -0.075 0.015 *0.349 *0.281 **-0.726 **-0.659 **-0.468 *-0.333
Soaked seed density G P 1.000 1.000 **-0.485 **-0.502 *0.374 *0.328 0.036 -0.101
Swelling capacity G
P 1.000 1.000 -0.009 0.048 **0.442 **0.541
Hydration index G
P
1.000 1.000
**0.876 **0.814
Swelling index G
P
1.000 1.000 *Significance at 5% level
ISSN 0975-928X
Table 3. Path coefficient analysis showing direct and indirect effect of nine for physical properties of blackgram seed
Characters
100 grain weight
100 seed volume
before soaking
100 seed volume
after soaking
100 seed weight
after soaking
Hydration capacity
Dry seed density
Soaked seed density
Swellin g capacity
Hydration index
Correlat ion with
Swellin g index
100 grain weight -0.0031 -0.7536 0.7516 -0.0420 0.0020 0.2521 0.0680 0.0241 -1.2100 -0.911
100 seed volume before soaking -0.0023 -1.0075 0.8011 -0.0425 0.0012 0.0107 0.0803 0.1799 -0.8538 -0.833
100 seed volume after soaking -0.0024 -0.8118 0.9942 -0.0380 0.0014 0.0906 0.1727 -0.0950 -0.9070 -0.595
100 seed weight after soaking -0.0023 -0.7323 0.6463 -0.0584 0.0007 0.0931 -0.0498 0.0853 -0.6992 -0.717
Hydration capacity 0.0027 0.5284 -0.5803 0.0171 -0.0023 -0.2813 -0.1273 0.0230 1.1776 0.757
Dry seed density -0.0021 -0.0292 0.2438 -0.0147 0.0018 0.3693 0.0206 -0.1546 -0.9026 -0.468
Soaked seed density 0.0008 0.2945 -0.6247 -0.0106 -0.0011 -0.0277 -0.2748 0.2148 0.4651 0.036
Swelling capacity 0.0002 0.4093 0.2132 0.0113 0.0001 0.1289 0.1333 -0.4429 -0.0111 0.442
Hydration index 0.0030 0.6924 -0.7258 0.0329 -0.0022 -0.2683 -0.1029 0.0040 1.2424 0.876
ISSN 0975-928X
Table. 4. Superior genotypes identified for various quality attributes S.No 100 grain
weight
100 seed volume
before soaking
100 seed volume after
soaking
100 seed weight after
soaking
Hydration capacity
Dry seed density
Soaked seed density
Swelling capacity
Hydration index
Swelling index
1. VBG66 RUG10 ACM07001 VBG07001 KUG531
KPU07-08