R E S E A R C H A R T I C L E
Open Access
Validation of an analytical method based on the
high-resolution continuum source flame atomic
absorption spectrometry for the fast-sequential
determination of several hazardous/priority
hazardous metals in soil
Tiberiu Frentiu
1†, Michaela Ponta
1*†and Raluca Hategan
2†Abstract
Background:The aim of this paper was the validation of a new analytical method based on the high-resolution continuum source flame atomic absorption spectrometry for the fast-sequential determination of several
hazardous/priority hazardous metals (Ag, Cd, Co, Cr, Cu, Ni, Pb and Zn) in soil after microwave assisted digestion in aqua regia. Determinations were performed on the ContrAA 300 (Analytik Jena) air-acetylene flame spectrometer equipped with xenon short-arc lamp as a continuum radiation source for all elements, double monochromator consisting of a prism pre-monocromator and an echelle grating monochromator, and charge coupled device as detector. For validation a method-performance study was conducted involving the establishment of the analytical performance of the new method (limits of detection and quantification, precision and accuracy). Moreover, the Bland and Altman statistical method was used in analyzing the agreement between the proposed assay and inductively coupled plasma optical emission spectrometry as standardized method for the multielemental determination in soil.
Results:The limits of detection in soil sample (3σcriterion) in the high-resolution continuum source flame atomic absorption spectrometry method were (mg/kg): 0.18 (Ag), 0.14 (Cd), 0.36 (Co), 0.25 (Cr), 0.09 (Cu), 1.0 (Ni), 1.4 (Pb) and 0.18 (Zn), close to those in inductively coupled plasma optical emission spectrometry: 0.12 (Ag), 0.05 (Cd), 0.15 (Co), 1.4 (Cr), 0.15 (Cu), 2.5 (Ni), 2.5 (Pb) and 0.04 (Zn). Accuracy was checked by analyzing 4 certified reference materials and a good agreement for 95% confidence interval was found in both methods, with recoveries in the range of 94–106% in atomic absorption and 97–103% in optical emission. Repeatability found by analyzing real soil samples was in the range 1.6–5.2% in atomic absorption, similar with that of 1.9–6.1% in optical emission
spectrometry. The Bland and Altman method showed no statistical significant difference between the two spectrometric methods for 95% confidence interval.
Conclusions:High-resolution continuum source flame atomic absorption spectrometry can be successfully used for the rapid, multielemental determination of hazardous/priority hazardous metals in soil with similar analytical performances to those in inductively coupled plasma optical emission spectrometry.
Keywords:High-resolution continuum source flame atomic absorption spectrometry, Inductively coupled plasma optical emission spectrometry, Bland and Altman statistical method, Soil analysis, Hazardous/priority hazardous metal
* Correspondence:[email protected] †Equal contributors
1
Faculty of Chemistry and Chemical Engineering, Babes-Bolyai University, 11 Arany Janos, 400028 Cluj-Napoca, Romania
Full list of author information is available at the end of the article
© 2013 Frentiu et al.; licensee Chemistry Central Ltd. This is an Open Access article distributed under the terms of the Creative Commons Attribution License (http://creativecommons.org/licenses/by/2.0), which permits unrestricted use, distribution, and reproduction in any medium, provided the original work is properly cited.
Background
Twenty five years ago low-resolution line source atomic absorption spectrometry (LR-LS AAS), although in full maturity and providing high sensitivity and selectivity through the element-specific line radiation source, had limited versatility and low speed of analysis being known as a single-element technique. To face the challenges of the inductively coupled plasma optical emission spec-trometry (ICP-OES), which imposed itself as a fast mul-tielemental technique due to the charged-coupled device (CCD) technology, the need to increase the versatility of AAS with respect to line selection, background cor-rection and higher analysis speed became imperative. Thus, in the mid-1990s a research group led by Becker-Ross from the Institute for Analytical Sciences, Berlin, Germany, designed and built the first instrument for high-resolution continuous source atomic absorption spectrometry (HR-CS AAS), in which all components were optimized for the novel approach [1-3]. The new concept instrument has been for several years com-mercially available for both flame (HR-CS FAAS) and graphite furnace (HR-CS GFAAS) atomization. The re-levant advantages of HR-CS AAS over LR-LS AAS are [4]: (i) use of just one source for all elements; (ii) vis-ualization of the environment of the analytical line permitting superior background correction by simultan-eous measurement of atomic and background absorp-tion; (iii) fast-sequential multielemental determination using atomic lines or molecular bands (changing lines and parameters optimization only takes a few seconds); (iv) correction of the fine-structured background using a reference spectrum. The extremely well acceptance of HR-CS AAS instrument after its introduction on the market together with the versatility of the analytical ap-plications was reflected in several reviews [5-11]. Both approaches of the technique, using either flame or elec-trothermal atomization, were used for multielemental determination in various complex matrices. Thus, HR-CS GFAAS was mentioned for elemental determination in food after acidic digestion or extraction in tetrame-thylammonium hydroxide [12-14], airborne particulates [15-18], biological (beans and grain) samples using direct solid sampling [19-21], fertilizer by slurry sampling [22], crude oil [23-26], biodiesel [27] and in whole blood dir-ectly in diluted/undiluted samples [28].
At the same time, HR-CS FAAS was used for multiele-mental determination in vegetable oil as microemulsion [29], plant tissues after mineralization [30,31], dairy products by slurry sampling [32], pewter alloys after di-gestion in HCl solution [33], lubricating oil after acid digestion, oil-in water emulsification and dilution in ke-rosene [34-36], and soil extracts [37].
The introduction of the continuum source and high-resolution monochromator has opened the door to
monitor non-metals (P, S, F, Br, N, etc.) with sensitive lines in the far UV, not accessible for LS-AAS. Thus, the molecular absorption spectrometry (HR-CS MAS) can overcome this barrier by measuring the absorp-tion of a line within the band spectra of a diatomic mo-lecular radical (PO, CS, SH, AlF, SrF, GaF, AlBr, CaBr, NO, etc.) stable in flame or graphite furnace at the atomizer temperature [9,21,38-49].
This paper reports on the validation of an analytical method for the fast-sequential determination of several hazardous/priority hazardous metals (Ag, Cd, Cr, Co, Cu, Ni, Pb and Zn) in soil based on the HR-CS FAAS. The soil samples were subjected to microwave assisted digestion in aqua regia according to ISO 11466 –1999. Validation was conducted according to the method-per-formance study to estimate the permethod-per-formance characte-ristics of the new method (limit of detection, limit of quantification, precision and accuracy [50,51]. Further-more, the Bland and Altman statistical method was used in analyzing the agreement between the proposed assay and inductively coupled plasma optical emission spec-trometry as standardized method for the multielemental determination in soil [52].
The paper is important for the analytical practice because currently the standardized methods for soil ana-lysis by atomic absorption spectrometry are LR-LS FAAS and GFAAS [53]. On the other hand, ISO/IEC 17025– 2005 and the Programme of Association of Official Ana-lytical Chemistry demand the fit-for-purpose validation of the new techniques/assays before use.
Results and discussion
Limits of detection and quantification
[53]. Data in Table 1 reveals better detection limits for Cr, Cu, Ni and Pb by HR-CS FAAS than by ICP-OES. A comparison of the detection limits found by us with those given in [52] for ICP-OES is not relevant, since the values are strongly depended on equipment and la-boratory conditions. However, each lala-boratory should determine its specific LODs within a validation study.
Accuracy of the multielemental determinations
Accuracy of the analytical method based on HR-CS FAAS was assessed by analyzing 4 certified reference samples. The results in comparison with those found in ICP-OES are displayed in Table 2. The average recovery and pooled standard deviation of 95% confidence inter-val were computed based on the results obtained for each CRM. According to data in Table 2, the analytical method based on HR-CS FAAS provided good accuracy with recoveries in the range 94–106%, similar to the values of 97–103% found in ICP-OES. The good reco-very of certified value in both methods indicated the absence of interferences. Moreover, the method of cor-rection the continuous background and NO molecular absorption in HR-CS FAAS proved to be efficient in the case of the complex matrix of soil.
Precision in HR-CS FAAS and ICP-OES
The metal contents and standard deviations found in soil samples by HR-CS FAAS and ICP-OES are presen-ted in Additional file 1. The pooled relative standard deviations in HR-CS FAAS were: 2.5% (Ag), 4.6% (Cd), 3.2% (Cr), 4.3% (Cu), 5.2% (Co), 3.2% (Ni), 2.2% (Pb), 1.6% (Zn), similar to those in ICP-OES: 4.7% (Ag), 3.2% (Cd), 2.3% (Cr), 6.1% (Cu), 4.4% (Co), 4.9% (Ni), 3.7% (Pb) and 1.9% (Zn). The values comply with the infor-mative ones given in [52].
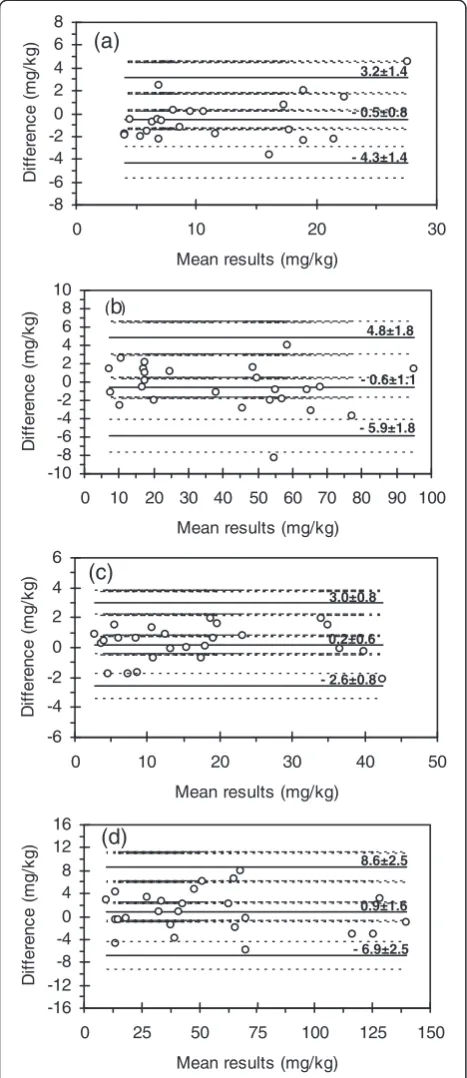
Statistical validation using the Bland and Altman method The Bland and Altman plots are displayed in Figure 1 and Additional file 2, while the descriptive statistics for 95% confidence interval (CI) in Table 3.
The contents of 3 out of the 8 elements under study (Cu, Pb and Zn) covered a wide range of concentration with individual values grouped on specific sub-domains. Therefore, in the case of Cu, the samples were split in two groups, with contents below 1000 mg/kg (34 sam-ples) and in the range 1000–22000 mg/kg (16 samples). The distribution of Pb contents imposed the grouping in three sub-groups: below 1000 mg/kg (28 samples), in the range 1000 – 10000 mg/kg (14 samples) and 10000 – 60000 mg/kg (13 samples), respectively. Sample grou-ping in two sub-domains was also used in respect with Zn, namely below 1000 mg/kg (30 samples) and over 1000 mg/kg (20 samples). The inspection of narrower ranges of concentration provided a more accurate asses-sment of results found in HR-CS FAAS and ICP-OES. Plots in Figure 1, Additional file 2 and data in Table 3 demonstrate a good agreement between methods for 95% CI.
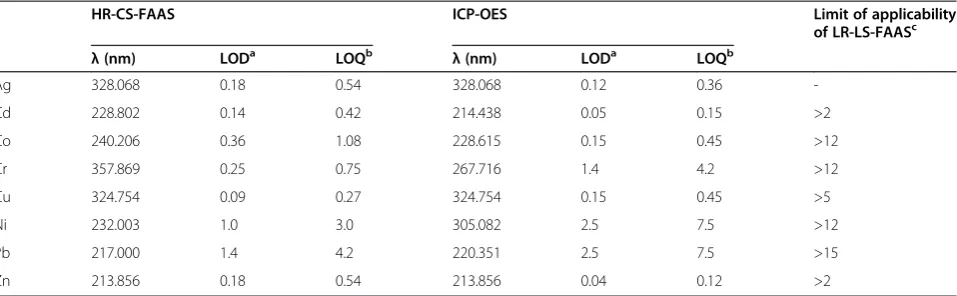
The positive bias for Co and Cr (Figure 1c,d), Cu and Pb < 1000 mg/kg and Zn > 1000 mg/kg (see Additional file 2e,h,l) and the negative one for Ag, Cd (Figure 1a,b), Cu > 1000 mg/kg, Ni, Pb in the range 1000 – 60000 mg/kg and Zn < 1000 mg/kg (see Additional file 2f,g,i,j,k) towards the ICP-OES method was low in relation to the concentrations of the elements. In all these cases the 95% CI of the bias included the zero value, so that errors were random and the null hypothesis was retained. With respect to Co and Cr (Figure 1c,d), Cu (whole concen-tration range), Ni, Pb (whole concenconcen-tration range) and Zn (1000–11000 mg/kg) (see Additional file 2e,f,g,h,i,j,l), all results fall within the limits of agreement of the diffe-rences between methods. In the case of Ag (Figure 1a) Table 1 Limits of detection (3σcriterion) and quantification (mg/kg) in soil
HR-CS-FAAS ICP-OES Limit of applicability
of LR-LS-FAASc
λ(nm) LODa LOQb λ(nm) LODa LOQb
Ag 328.068 0.18 0.54 328.068 0.12 0.36
-Cd 228.802 0.14 0.42 214.438 0.05 0.15 >2
Co 240.206 0.36 1.08 228.615 0.15 0.45 >12
Cr 357.869 0.25 0.75 267.716 1.4 4.2 >12
Cu 324.754 0.09 0.27 324.754 0.15 0.45 >5
Ni 232.003 1.0 3.0 305.082 2.5 7.5 >12
Pb 217.000 1.4 4.2 220.351 2.5 7.5 >15
Zn 213.856 0.18 0.54 213.856 0.04 0.12 >2
a
–LOD calculated for an amount of 1.000 g soil mineralized and diluted to 100 ml solution. b
–LOQ considered three times LOD. c
–according to [53].
Frentiuet al. Chemistry Central Journal2013,7:43 Page 3 of 10
Table 2 Found values (m = 5 independent samples) in the analysis of CRMs compared to certified values (mg/kg)
BCR 025-050a LGC 6135a LGC 6141a NCSDC Recoveryb(%)
Found Certified Found Certified Found Certified Found Certified ICP-OES HR-CS AAS
ICP-OES HR-CS AAS ICP-OES HR-CS AAS ICP-OES HR-CS AAS ICP-OES HR-CS AAS
Cd 340 ± 45.0 383 ± 76.0 369 ± 46.3 - - - 2.50 ± 0.5 2.40 ± 0.2 2.45 ± 0.3 97 ± 17 101 ± 15 Co 4.00 ± 0.80 3.98 ± 0.80 4.07 ± 0.93 19 ± 3 16 ± 4 20 ± 4 - - - 17.1 ± 1.5 17.0 ± 2.0 16.5 ± 1.8 99 ± 16 94 ± 20 Cr 448 ± 41.0 403 ± 34.0 441 ± 50.1 349 ± 12 344 ± 30 336 ± 28 120 ± 20 115 ± 20 130 ± 31 88 ± 5 105 ± 6 90 ± 8 99 ± 10 100 ± 11 Cu 8.35 ± 1.68 9.62 ± 1.60 7.76 ± 1.68 100 ± 5 102 ± 11 105 ± 5 52.2 ± 0.8 52.3 ± 7.5 51.1 ± 13 54 ± 5 51 ± 2 53 ± 6 102 ± 14 105 ± 12 Ni 12.0 ± 3.25 12.9 ± 1.80 12.2 ± 3.54 240 ± 16 275 ± 27 227 ± 13 50 ± 5 50 ± 5 49 ± 13 34 ± 6 30 ± 3 32 103 ± 17 106 ± 11 Pb 1448 ± 108 1454 ± 188 1447 ± 203 400 ± 21 395 ± 10 391 ± 16 75.1 ± 12 74.1 ± 10 75.8 ± 16 78 ± 5 75 ± 5 79 ± 12 100 ± 10 99 ± 10 Zn 55.0 ± 8.14 60.6 ± 11.05 51.8 ± 8.29 316 ± 18 339 ± 26 316 ± 41 167 ± 30 168 ± 30 169 ± 39 248 ± 38 245 ± 24 251 101 ± 14 105 ± 14
a
–average ± U (U–expanded uncertainty for 95% confidence level).
b
–average recovery for 95% confidence level.
Central
Journal
2013,
7
:43
Page
4
o
f
1
0
rycentral.co
m/content/7/1/
one result out of 25 was above the upper limit of agree-ment, while for Zn 2 out of the 20 values > 1000 mg/kg (see Additional file 2,l) surpassed the upper limit and 1 the lower one. However, in all cases the values remained within the 95% CI of the limits. In short, the differences
between results for Zn by HR-CS FAAS and ICP-OES were random and the null hypothesis was retained over the whole concentration range.
Although in the case of Cd (Figure 1b), one of the 25 results was above the upper limit of agreement and out-side its 95% CI, the agreement between HR-CS FAAS and ICP-OES could be considered good.
Conclusions
An analytical method based on the HR-CS FAAS was validated for the fast-sequential determination of eight hazardous/priority hazardous elements (Ag, Cd, Co, Cr, Cu, Ni, Pb and Zn) in soil samples digested in aqua regia. The study revealed similar analytical performances to those in ICP-OES, the standardized method for the multielemental determination in soil and considered as reference in this study. The statistical analysis using the Bland and Altman test demonstrated a good agreement between the two methods over a wide concentration range for 95% CI. In these circumstances it is obvious that the new instrumental concept based on HR-CS FAAS recently commercially available can be success-fully used for the determination of hazardous/priority hazardous metals in soil with performances similar to those reported in ICP-OES. The main contribution of the paper was broadening the applicability of HR-CS FAAS for the determination of hazardous/priority haz-ardous metals in soil, very attractive by its fast, multi-elemental capability and easy to handle with respect to optimization and overcoming spectral interferences. In the same time, the use of the Bland and Altman test allowed the comparison of results over a large concen-tration range.
Experimental
Reagents, standards and CRMs
Nitric acid, 65% and hydrochloric acid, 37% of ana-lytical grade (p.a.) (Merck, Darmstadt, Germany) were used to mineralize the soil samples. Argon 5.0 quality and acetylene 4.5 quality (Linde Gas SRL Cluj-Napoca, Romania) were used as working gases to generate ICP and flame, respectively. The accuracy of the HR-CS FAAS method was checked by analyzing three certified reference samples of soil containing priority contami-nants, CRM 025–050, LGC 6135, LGC 6141, and one ri-ver sediment, NCSDC 78301 (LGC Promochem GmbH, Wessel, Germany). High purity water (18 MΩ cm-1) from a Milli Q system (Millipore, Bedford MA, USA) was used throughout.
The ICP multielement standard solution IV 1000 μg/ ml (Merck, Darmstadt, Germany) was used to prepare multielement working standards in the range 0 –1 μg/ ml by dilution with 2% HNO3. A blank calibration solu-tion of 2% HNO3 was used in recording the reference -8 -6 -4 -2 0 2 4 6 8
0 10 20 30
Mean results (mg/kg)
D if feren c e ( m g /k g )
(a)
- 0.5±0.8 3.2±1.4 - 4.3±1.4 -10 -8 -6 -4 -2 0 2 4 6 8 100 10 20 30 40 50 60 70 80 90 100
Mean results (mg/kg)
D if fer enc e ( m g/ k g) - 0.6±1.1 - 5.9±1.8 4.8±1.8 (b) 0.2±0.6 -6 -4 -2 0 2 4 6
0 10 20 30 40 50
Mean results (mg/kg)
D if fe renc e ( m g/ k g ) 3.0±0.8 - 2.6±0.8
(c)
0.9±1.6 -16 -12 -8 -4 0 4 8 12 160 25 50 75 100 125 150
Mean results (mg/kg)
D iffe re n c e ( m g /k g ) 8.6±2.5 - 6.9±2.5
(d)
Figure 1Bland and Altman plots: (a) Ag (n=25); (b) Cd (n=25); (c) Co (n=25); (d) Cr (n=25). n–sample size.
Frentiuet al. Chemistry Central Journal2013,7:43 Page 5 of 10
spectrum for correction NO molecular absorption on Zn 213.856 nm line.
Instrumentation
Flame atomic absorption spectrometer
Measurements in FAAS were carried out using the ContrAA 300 high-resolution continuum source flame atomic absorption spectrometer from Analytik Jena AG (Jena, Germany), currently the only manufacturer of such instrumentation. The spectrometer is equipped with a xenon short-arc lamp XBO 301 (GLE, Berlin, Germany) with a nominal power of 300 W operating in a hot-spot mode suitable for all elements, a double monochromator consisting of a prism pre-monochromator and an echelle grating monochromator (resolution 1.5 pm per pixel in the far UV and 3 pm at 400 nm) and CCD array with 588 pixels. The detector allows visualization of the environ-ment of the analytical line using 200 pixels. Five pixels in the centre of the window were used to measure atomic
absorption, while the others for correction purposes. The concept of ContrAA 300 provides the fast-sequential mul-tielement determination as well as an efficient background correction by simultaneous measurement of atomic and continuous background absorption. Additionally, the in-terference of fine-structured background of NO molecule on Zn 213.856 nm line was eliminated based on the refer-ence spectrum registered for a 2% HNO3solution and the least-squares background correction (LSBC). The primary lines of the elements were selected for the determination due to their highest sensitivity. The working conditions recommended by the manufacturer with the HR-CS ContrAA 300 spectrometer are summarized in Table 4.
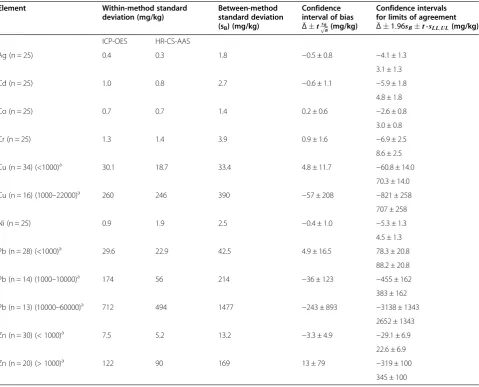
Inductively coupled plasma optical emission spectrometer A SPECTRO CIROSCCD ICP optical emission simulta-neous spectrometer with axial plasma viewing (Spectro Analytical Instruments, Kleve, Germany) was used to obtain the comparative values for the Bland and Altman Table 3 Descriptive statistics for the Bland and Altman test (95% confidence level, m = 3 independent samples)
Element Within-method standard
deviation (mg/kg)
Between-method standard deviation (sB) (mg/kg)
Confidence interval of bias
ΔtsBffiffi n
p (mg/kg)
Confidence intervals for limits of agreement
Δ1:96sBt⋅sLL;UL(mg/kg) ICP-OES HR-CS-AAS
Ag (n = 25) 0.4 0.3 1.8 −0.5 ± 0.8 −4.1 ± 1.3
3.1 ± 1.3
Cd (n = 25) 1.0 0.8 2.7 −0.6 ± 1.1 −5.9 ± 1.8
4.8 ± 1.8
Co (n = 25) 0.7 0.7 1.4 0.2 ± 0.6 −2.6 ± 0.8
3.0 ± 0.8
Cr (n = 25) 1.3 1.4 3.9 0.9 ± 1.6 −6.9 ± 2.5
8.6 ± 2.5
Cu (n = 34) (<1000)a 30.1 18.7 33.4 4.8 ± 11.7 −60.8 ± 14.0
70.3 ± 14.0
Cu (n = 16) (1000–22000)a 260 246 390 −57 ± 208 −821 ± 258
707 ± 258
Ni (n = 25) 0.9 1.9 2.5 −0.4 ± 1.0 −5.3 ± 1.3
4.5 ± 1.3
Pb (n = 28) (<1000)a 29.6 22.9 42.5 4.9 ± 16.5 78.3 ± 20.8
88.2 ± 20.8
Pb (n = 14) (1000–10000)a 174 56 214 −36 ± 123 −455 ± 162
383 ± 162
Pb (n = 13) (10000–60000)a 712 494 1477 −243 ± 893 −3138 ± 1343
2652 ± 1343
Zn (n = 30) (< 1000)a 7.5 5.2 13.2 −3.3 ± 4.9 −29.1 ± 6.9
22.6 ± 6.9
Zn (n = 20) (> 1000)a 122 90 169 13 ± 79 −319 ± 100
345 ± 100 a
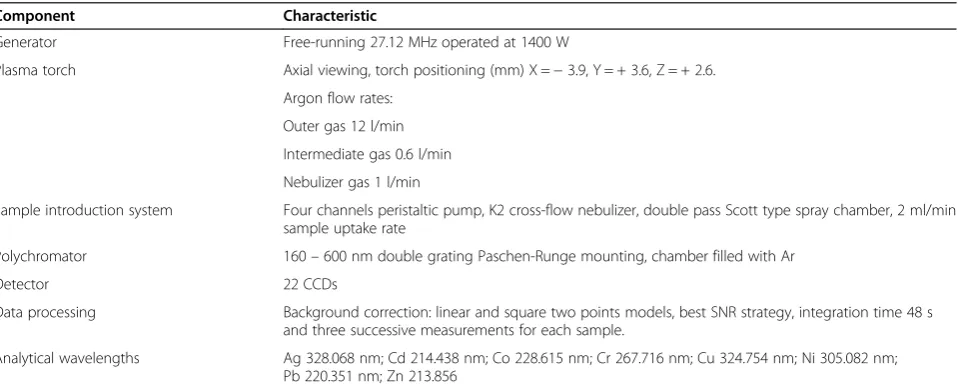
test. The SPECTRO CIROS features a Paschen-Runge spectrometer mount, consisting of a double-grating op-tical system with 22 CCD detectors. Details about the operating conditions of the spectrometer and the wor-king wavelengths are given in Table 5. As for HR-CS FAAS the most sensitive wavelengths were selected for emission measurements.
Instrumentation used in sample preparation
A mortar grinder Retsch RM 1000 and a sieve shaker Retsch 200 (Hann, Germany), a Memmert UFE 500 oven (Schwabach, Germany), a high-pressure (100 atm) Berghof MW-S3+ system with control temperature until 210°C (Eningen, Germany) and a Sartorius vacuum filter equip-ment (Goettingen, Germany) were used for sample pre-paration and mineralization.
Methods
Soil sample preparation
Mineralization of soil samples was performed accor-ding to ISO 11466-1999. Samples were dried for 4 h at
105 ± 5°C, then crushed and sieved through a 2-mm sieve to remove stones. The fraction < 2 mm was ground and sieved again through a 250-μm sieve. Amounts of 1.0000 g soil sample prepared in this way were subjected to mineralization with 10 ml aqua regia in closed PTFE containers of the microwave digester according to the protocol given in Table 6. The digest was transferred to a 100 ml volumetric flask and diluted with 2% HNO3to mark. After filtration, the solution was kept in polyethy-lene flask until analysis. Elements were determined by HR-CS FAAS and ICP-OES in 3 independent samples and 3 successive measurements on each sample. Dilu-tions were carried out so that sample concentration fall within the calibration curve.
Bland and Altman method
In the validation study of the method based on HR-CS FAAS for the determination of elements over a wide con-centration range, sometimes up to 3 orders of magnitude (Cu, Pb, Zn), the comparison was made with ICP-OES as reference method using the Bland and Altman approach. It was initially applied in the medical field [56,57] and further used for comparative studies in other do-mains [58-62]. Unlike the linear regression, the Bland Table 4 Working conditions for measurements by HR-CS
FAAS ContrAA 300 in air-acetylene flame
Analyte Wavelength (nm)
Acetylene (l/min)
Air (l/min)
Burner height (mm)
Ag 328.068 50 500 6
Cd 228.802 50 500 6
Co 240.206 50 500 6
Cr 357.869 100 400 8
Cu 324.754 50 470 6
Ni 232.003 55 470 6
Pb 217.000 65 470 6
Zn 213.856 50 470 6
Table 5 Operating conditions and analytical lines for the SPECTRO CIROSCCDICP optical emission spectrometer
Component Characteristic
Generator Free-running 27.12 MHz operated at 1400 W
Plasma torch Axial viewing, torch positioning (mm) X =−3.9, Y = + 3.6, Z = + 2.6.
Argon flow rates:
Outer gas 12 l/min
Intermediate gas 0.6 l/min
Nebulizer gas 1 l/min
Sample introduction system Four channels peristaltic pump, K2 cross-flow nebulizer, double pass Scott type spray chamber, 2 ml/min sample uptake rate
Polychromator 160–600 nm double grating Paschen-Runge mounting, chamber filled with Ar
Detector 22 CCDs
Data processing Background correction: linear and square two points models, best SNR strategy, integration time 48 s and three successive measurements for each sample.
Analytical wavelengths Ag 328.068 nm; Cd 214.438 nm; Co 228.615 nm; Cr 267.716 nm; Cu 324.754 nm; Ni 305.082 nm; Pb 220.351 nm; Zn 213.856
Table 6 Operating conditions for the microwave digestion system
Step
1 2 3 4
Temperature (°C) 180 100 100 100
Ramp time (min) 5 1 1 1
Hold time (min) 25 10 1 1
Power (%)a 60 20 10 0
a–
100% power corresponds to 1450 W.
Frentiuet al. Chemistry Central Journal2013,7:43 Page 7 of 10
and Altman test can be applied for statistical evaluation of experimental data even when they are not uniformly dis-tributed over a concentration range but grouped in several sub-domains, which may be the case of soil samples.
Setting up a Bland and Altman method to compare two data sets implies the following computing: (i) the average of repeated measurements for each sample and each method, and the within-sample standard deviation in each method (si HR-CS FAAS and si ICP-OES); (ii) the within-method standard deviation
swHRCSFAAS ¼
ffiffiffiffiffiffiffiffiffiffiffiffiffiffiffiffiffiffiffiffiffiffiffiffiffiffiffiffiffi X
s2
iHRCSFAAS
n s
ð1Þ
swICPOES ¼
ffiffiffiffiffiffiffiffiffiffiffiffiffiffiffiffiffiffiffiffiffiffiffiffi X
s2 iICPOES
n s
ð2Þ
where n is the sample size; (iii) the differences between averages of measurements of each sample (Δi) per-formed by the two methods, the bias estimated by the average difference (Δ) and its standard deviation (sΔ);
(iv) the between-method standard deviation (sB) for (m) repeated measurements for each sample in each method
sB¼
ffiffiffiffiffiffiffiffiffiffiffiffiffiffiffiffiffiffiffiffiffiffiffiffiffiffiffiffiffiffiffiffiffiffiffiffiffiffiffiffiffiffiffiffiffiffiffiffiffiffiffiffiffiffiffiffiffiffiffiffiffiffiffiffiffiffiffiffiffiffiffiffiffiffiffiffiffiffiffiffiffiffiffiffiffiffiffiffiffiffiffiffiffiffiffiffi s2
Δþ 1
1 m
s2
wHRCSFAASþ 1
1 m
s2 wICPOES s
ð3Þ
(v) the limits of agreement of the results Δ1:96sB
and the 95% CI of Δ (Δt sBffiffi
n
p ) where n is the sample size, while (t) the Student parameter for (n-1) freedom degrees; (vi) the 95% CI of limits of agreement of the mean difference (Δ1:96sBt⋅sLL;UL) where sLL, UL is the standard deviation of the lower and upper limits of agreement;
sLL;UL¼
ffiffiffiffiffiffiffiffiffiffiffiffiffiffiffiffiffiffiffiffiffiffiffiffiffiffiffiffiffiffiffiffiffiffiffiffiffiffiffiffiffiffiffiffiffiffiffiffiffiffiffiffiffiffiffiffiffiffiffiffiffiffiffiffiffiffiffiffiffiffiffiffiffiffiffiffiffiffiffiffiffiffiffiffiffiffiffiffiffiffiffiffiffiffiffiffiffiffiffiffiffiffiffiffiffiffiffiffiffiffiffiffiffiffiffiffiffiffiffiffiffiffiffiffi
s2 B
nþ 1:962
2sB2
s4
Δ n1þ
m1
ð Þs4 wHRCSFAAS
nm2 þ
m1
ð Þs4
wICPOES
nm2
s
ð4Þ
Finally the differences between methods are plotted against the averages of the two methods and the lines corresponding to bias, limits of agreement and their 95% CI respectively, are plotted.
According to the Bland and Altman test, there is no significant bias between methods when the differences of the results fall between the limits of agreement and the CI of the mean difference contains the zero value. Moreover, the 95% CI of the upper and lower limits should be reasonably narrow, which is very likely for a large sample size.
Additional files
Additional file 1:Analytical results (mg/kg) for soil samples analysis by HR-CS FAAS and ICP-OESa.
Additional file 2:Bland and Altman plots. Abbreviations
CCD:Charge coupled device; CRM: Certified reference material; HR-CS AAS: High-resolution continuum source atomic absorption spectrometry; HR-CS FAAS: High-resolution continuum source flame atomic absorption spectrometry; HR-CS GFAAS: High-resolution continuum source graphite furnace atomic absorption spectrometry; ICP-OES: Inductively coupled plasma optical emission spectrometry; LOD: Limit of detection; LOQ: Limit of quantification; LR-LS AAS: Low-resolution line source atomic absorption spectrometry; LSBC: Least-squares background correction; OES: Optical emission spectrometry; PTFE: Polytetrafluoroethylene; SNR: Signal-to-noise ratio.
Competing interests
The authors declare that they have no competing interests.
Authors’contributions
TF–designed the study and coordinated the preparation of the manuscript, carried out the analysis by inductively coupled plasma optical emission spectrometry, co-worked on the analysis by high-resolution continuum source flame atomic absorption spectrometry and interpreted the results related to analytical performance; MP–performed the data comparison using the Bland and Altman method; worked on the sample preparation and analysis by optical emission and absorption spectrometry; RH–carried out the computational experiments; co-worked on the sample collection and preparation and helped to draft the manuscript. All authors read and approved the final manuscript.
Authors’information
TF is associate professor of instrumental analysis at the University Babes-Bolyai Cluj-Napoca, Faculty of Chemistry and Chemical Engineering, Romania. His research field includes the development of analytical methods by optical emission spectrometry in inductively coupled or capacitively coupled plasma sources for determining the priority hazardous components in
environmental samples and materials. He has also interests in the development of miniaturized analytical instrumentation based on plasma microtorches for on-site analysis.
MP is associate professor of instrumental analysis at the University Babes-Bolyai Cluj-Napoca, Faculty of Chemistry and Chemical Engineering, Romania. Her area of interests covers the development of analytical methods by atomic spectrometry, toxicological analysis, and quality control and quality assurance in chemical analysis.
RH is a PhD student at the Babes-Bolyai University Cluj-Napoca, Romania and officer at the Department of chemicals and hazardous waste by the Regional Environmental Protection Agency, Cluj-Napoca. Her research interests cover the waste management and related monitoring approaches.
Author details
1Faculty of Chemistry and Chemical Engineering, Babes-Bolyai University, 11 Arany Janos, 400028 Cluj-Napoca, Romania.2Regional Environmental Protection Agency, 99 Dorobantilor, 400609 Cluj-Napoca, Romania.
Received: 14 January 2013 Accepted: 11 February 2013 Published: 1 March 2013
References
1. Florek S, Becker-Ross H:High-resolution spectrometer for atomic spectrometry.J Anal At Spectrom1995,10:145–147.
2. Becker-Ross H, Florek S, Heitmann U, Weisse R:Influence of the spectral bandwidth of the spectrometer on the sensitivity using continuum source AAS.Fresen J Anal Chem1996,355:300–303.
4. Welz B, Becker-Ross H, Florek S, Heitmann U:High-Resolution Continuum, Source AAS - the better way to do atomic absorption spectrometry.Weinheim, Germany: Wiley-VCH; 2005.
5. L’vov BV:A continuum source vs. line source on the way toward absolute graphite furnace atomic absorption spectrometry.Spectrochim Acta Part B1999,54B:1637–1646.
6. Welz B, Becker-Ross H, Florek S, Heitmann U, Vale MGR:High-resolution continuum-source atomic absorption spectrometry–What can we expect?J Braz Chem Soc2003,14:220–229.
7. Becker-Ross H, Florek S, Heitmann U, Huang MD, Okruss M, Radziuk B: Continuum source atomic absorption spectrometry and detector technology: a historical perspective.Spectrochim Acta Part B2006, 61B:1015–1030.
8. Welz B, Borges DLG, Lepri FG, Vale MGR, Heitmann U:High-resolution continuum source electrothermal atomic absorption spectrometry–an analytical and diagnostic tool for trace analysis.Spectrochim Acta PartB
2007,62B:873–883.
9. Welz B, Mores S, Carasek E, Vale MGR, Okruss M, Becker-Ross H: High-resolution continuum source atomic and molecular absorption spectrometry–a review.Appl Spectrosc Rev2010,45:327–354. 10. Taylor A, Branch S, Day MP, Patriarca M, White M:Atomic spectrometry
update. Clinical and biological materials, foods and beverages.J Anal At Spectrom2011,26:653–692.
11. Resano M, Garcia-Ruiz E:High-resolution continuum source graphite furnace atomic absorption spectrometry: Is it as it sounds? A critical review.Anal Bioanal Chem2011,399:323–330.
12. Ren T, Zhao LJ, Cao J, Zhong RG:Determination of Pb, Cd and Cr in food by high resolution continuum source graphite furnace atomic absorption spectrometry.Spectrosc Spectr Anal2012,32:2566–2571. 13. Ren T, Zhao LJ, Zhong RG:Determination of aluminum in wheat flour
food by microwave digestion-high resolution continuum source graphite furnace atomic absorption spectrometry.Spectrosc Spectr Anal2011, 31:3388–3391.
14. Nunes AM, Acunha TS, Oreste EQ, Lepri FG, Vieira MA, Curtius AJ, Ribeiro AS: Determination of Ca, Cu, Fe and Mg in fresh and processed meat treated with tetramethylammonium hydroxide by atomic absorption spectrometry.J Braz Chem Soc2011,22:1850–1857.
15. Atilgan S, Akman S, Baysal A, Bakircioglu Y, Szigeti T, Ovari M, Zaray G: Monitoring of Pd in airborne particulates by solid sampling high-resolution continuum source electrothermal atomic absorption spectrometry.Spectrochim Acta PartB2012,70B:33–38.
16. Castilho INB, Welz B, Vale MGR, de Andrade JB, Smichowski P, Shaltout AA, Colares L, Carasek E:Comparison of three different sample preparation procedures for the determination of traffic-related elements in airborne particulate matter collected on glass fiber filters.Talanta2011, 88:689–695.
17. Araujo RGO, Rennan GO, Vignola F, Castilho INB, Borges DLG, Welz B, Vale MGR, Smichowski P, Ferreira SLC, Becker-Ross H:Determination of mercury in airborne particulate matter collected on glass fiber filters using high-resolution continuum source graphite furnace atomic absorption spectrometry and direct solid sampling.Spectrochim Acta Part B2011, 66B:378–382.
18. Araujo RGO, Welz B, Castilho INB, Vale MGR, Smichowski P, Ferreira SLC, Becker-Ross H:Determination of antimony in airborne particulate matter collected on filters using direct solid sampling high-resolution continuum source graphite furnace atomic absorption spectrometry.
J Anal At Spectrom2010,25:580–584.
19. dos Santos LMG, Welz B, Araujo RGO, Jacob SDC, Vale MGR, Martens A, Martens IBG, Becker-Ross H:Simultaneous determination of Cd and Fe in beans and soil of different regions of Brazil using high-resolution continuum source graphite furnace atomic absorption spectrometry and direct solid sampling.J Agric Food Chem2009,57:10089–10094. 20. dos Santos LMG, Araujo RGO, Welz B, Jacob SDC, Vale MGR, Becker-Ross H:
Simultaneous determination of Cd and Fe in grain products using direct solid sampling and high-resolution continuum source graphite furnace atomic absorption spectrometry.Talanta2008,78:577–583.
21. Resano M, Briceno J, Belarra MA:Direct determination of phosphorus in biological samples using a solid sampling-high resolution-continuum source electrothermal spectrometer: comparison of atomic and molecular absorption spectrometry.J Anal At Spectrom
2009,24:1343–1354.
22. Borges AR, Becker EM, Lequeux C, Vale MGR, Ferreira SLC, Welz B:Method development for the determination of cadmium in fertilizer samples using high-resolution continuum source graphite furnace atomic absorption spectrometry and slurry sampling.Spectrochim Acta Part B
2011,66B:529–535.
23. Freire AS, Santelli RE:Trace elements determination in high salinity petroleum produced formation water by high-resolution continuum source graphite furnace atomic absorption spectrometry after matrix separation using Chelex-100 (R) resin.Spectrochim Acta Part B2012, 71-72B:92–97.
24. Quadros DPC, Chaves ES, Lepri FG, Borges DLG, Welz B, Becker-Ross H, Curtius AJ:Evaluation of Brazilian and Venezuelan crude oil samples by means of the simultaneous determination of Ni and V as their total and non-volatile fractions using high-resolution continuum source graphite furnace atomic absorption spectrometry.Energy Fuel2010,24:5907–5911. 25. Dittert IM, Silva JSA, Araujo RGO, Curtius AJ, Welz B, Becker-Ross H:
Simultaneous determination of cobalt and vanadium in undiluted crude oil using high-resolution continuum source graphite furnace atomic absorption spectrometry.J Anal At Spectrom2010,25:590–595. 26. Dittert IM, Silva JSA, Araujo RGO, Curtius AJ, Welz B, Becker-Ross H:Direct
and simultaneous determination of Cr and Fe in crude oil using high-resolution continuum source graphite furnace atomic absorption spectrometry.Spectrochim Acta Part B2009,64B:537–543.
27. de Campos RC, Correia CLT, Vieira F, Saint Pierre TD, Oliveira AC, Goncalves R:Direct determination of P in biodiesel by high-resolution continuum source graphite furnace absorption spectrometry.Spectrochim Acta Part B
2011,66B:352–355.
28. Aramendia M, Florez MR, Piette M, Vanhaecke F, Resano M:Al determination in whole blood samples as AlF via high-resolution continuum source graphite furnace molecular absorption spectrometry: potential application to forensic diagnosis of drowning.J Anal At Spectrom2011,26:1964–1973.
29. Nunes LS, Barbosa JTP, Fernandez AP, Lemos VA, dos Santos WNL, Korn MGA, Teixeira LSG:Multi-element determination of Cu, Fe, Ni and Zn content in vegetable oils samples by high-resolution continuum source atomic absorption spectrometry and microemulsion sample preparation.
Food Chem2011,127:780–783.
30. de Oliveira SR, Raposo JL, Neto JAG:Fast sequential multi-element determination of Ca, Mg, K, Cu, Fe, Mn and Zn for foliar diagnosis using high-resolution continuum source flame atomic absorption
spectrometry: feasibility of secondary lines, side pixel registration and least-squares background correction.Spectrochim Acta Part B2009, 64B:593–596.
31. Oliveira SR, Neto JAG, Nobrega JA, Jones BT:Determination of macro- and micronutrients in plant leaves by high-resolution continuum source flame atomic absorption spectrometry combining instrumental and sample preparation strategies.Spectrochim Acta Part B2010,65B:316–320. 32. Brandao GC, Matos GD, Ferreira SLC:Slurry sampling and high-resolution
continuum source flame atomic absorption spectrometry using secondary lines for the determination of Ca and Mg in dairy products.
Microchem J2011,98:231–233.
33. Dessuy MB, de Jesus RM, Brandao GC, Ferreira SLC, Vale MGR, Welz B:Fast sequential determination of antimony and lead in pewter alloys using high resolution-continuum source flame atomic absorption spectrometry.Food Addit Contam Part A-Chem2013,30:202–207. 34. Raposo JL, Oliveira SR, Neto JAG, Nobrega JA, Jones BT:Determination of
silicon in lubrication oil by high-resolution continuum source flame atomic absorption spectrometry using least-square background correction and internal standardization.Anal Lett2011,44:2150–2161. 35. Amorim VR, Neto JAG:Evaluation of lubricating oil preparation
procedures for the determination of Al, Ba, Mo, Si and V by high-resolution continuum source FAAS.Anal Sci2009,25:95–100. 36. Resta V, Filho A, Gomes JA:Different lubricating oil treatments for the
determination of Cu, Cr, Fe, Ni, Sb, Pb and Zn by HR-CS FAAS.Anal Lett
2008,41:1555–1570.
37. Raposo JL, de Oliveira SR, Caldas NM, Neto JAG:Evaluation of alternate lines of Fe for sequential multi-element determination of Cu, Fe, Mn and Zn in soil extracts by high-resolution continuum source flame atomic absorption spectrometry.Anal Chim Acta2008,627:198–202.
38. Huang MD, Becker-Ross H, Florek S, Heitmann U, Okruss M:Determination of phosphorus by molecular absorption of phophorus monoxide using a
Frentiuet al. Chemistry Central Journal2013,7:43 Page 9 of 10
high-resolution continuum source absorption spectrometer and an air-acetylene flame.J Anal At Spectrom2006,21:338–345.
39. Ferreira RB, Oliveira SR, Franzini VP, Virgilio A, Raposo JL, Neto JAG: Evaluation of lines of phosphorus and potassium by high-resolution continuum source flame atomic absorption spectrometry for liquid fertilizer analysis.At Spectrosc2011,32:56–61.
40. Welz B, Lepri FG, Araujo RGO, Ferreira SLC, Huang MD, Okruss M, Becker-Ross H:Determination of phosphorus, sulfur and the halogens using high-temperature molecular absorption spectrometry in flames and furnaces - a review.Anal Chim Acta2009,647:137–148.
41. Resano M, Florez MR:Direct determination of sulfur in solid samples by means of high-resolution continuum source graphite furnace molecular absorption spectrometry using palladium nanoparticles as chemical modifier.J Anal At Spectrom2012,27:401–412.
42. Virgilio A, Raposo JL, Cardoso AA, Nobrega JA, Neto JAG:Determination of total sulfur in agricultural samples by high-resolution continuum source flame molecular absorption spectrometry.J Agric Food Chem2011, 59:2197–2201.
43. Huang MD, Becker-Ross H, Florek S, Heitmann U, Okruss M:Direct determination of total sulfur in wine using a continuum-source atomic-absorption spectrometer and an air-acetylene flame.Anal Bioanal Chem
2005,382:1877–1881.
44. Baumbach G, Limburg T, Einax JW:Quantitative determination of sulfur by high-resolution graphite furnace molecular absorption spectrometry.
Microchem J2013,106:295–299.
45. Bucker S, Acker J:Spectrometric analysis of process etching solutions of the photovoltaic industry–Determination of HNO3, HF, and H2SiO6 using high-resolution continuum source absorption spectrometry of diatomic molecules and atoms.Talanta2012,94:335–341.
46. Ozbek N, Akman S:Method development for the determination of fluorine in toothpaste via molecular absorption of aluminum mono fluoride using a high-resolution continuum source nitrous oxide/ acetylene flame atomic absorption spectrophotometer.Talanta2012, 94:246–250.
47. Ozbek N, Akman S:Method development for the determination of fluorine in water samples via the molecular absorption of strontium monofluoride formed in an electrothermal atomizer.Spectrochim Acta Part B2012,69B:32–37.
48. Huang MD, Becker-Ross H, Florek S, Heitmann U, Okruss M:High-resolution contuinuum electrothermal absorption spectrometry of AlBr and CaBr for the determination of bromine.Spectrochim Acta Part B2008, 63B:566–570.
49. Brandao GC, Lima DC, Ferreira SLC:The chemical generation of NO for the determination of nitrite by high-resolution continuum source molecular absorption spectrometry.Talanta2012,98:231–235.
50. Massart DL, Vandeginste BGM, Buydens IMC:Handbook of Chemometrics and Qualimetrics, Part A.Amsterdam: Elsevier; 1997.
51. Gunzler H:Accreditation and Quality Assurance in Analytical Chemistry.Berlin: Springer Verlag; 1994.
52. ISO 22036:Soil quality. Determination of trace elements in extracts of soil by inductively coupled plasma-atomic emission spectrometry (ICP-AES).2008. 53. ISO 11047:Soil quality - Determination of cadmium, chromium, cobalt, copper,
lead, manganese, nickel and zinc - Flame and electrothermal atomic absorption spectrometric methods.1999.
54. Kaiser H:Die berechnung der nachweisempfindlichkeit.Spectrochim Acta
1947,3:40–47.
55. Currie LA:Nomenclature in evaluation of analytical methods including detection and quantification capabilities.Pure Appl Chem1995, 67:1699–1723.
56. Bland JM, Altman GD:Statistical methods for assessing agreement between two methods of clinical measurement.Lancet1986, i:307–310.
57. Bland JM, Altman GD:Measuring agreement in method comparison studies.Stat Methods Med Res1999,8:135–160.
58. Lyon TDB, Fell GS, McKey K, Scott RD:Accuracy of multi-element analysis of human tissue obtained at autopsy using inductively coupled plasma mass spectrometry.J Anal At Spectrom1991,6:559–564.
59. Cheng ASH, Robson MD, Neubauer S, Selvanayagam J:Irreversible myocardial injury: Assessment with cardiovascular delayed-enhancement MR imaging and comparison of 1.5 and 3.0 T-Initial experience.Radiology2007,242:735–742.
60. Frentiu T, Ponta M, Anghel SD, Simon A, Marginean I, Cordos E:Statistical evaluation of Cu, Mn and Zn determinations in biological samples by radiofrequency capacitively coupled plasma atomic emission spectrometry using the Bland and Altman test.Microchim Acta2003, 143:245–254.
61. Frentiu T, Ponta M, Levei E, Gheorghiu E, Kasler I, Cordos EA:Validation of the Tessier scheme for speciation of metals in soil using the Bland and Altman test.Chem Pap2008,62:114–122.
62. Frentiu T, Ponta M, Levei E, Senila M, Ursu M, Cordos E:Interlaboratory study on Cu, Pb and Zn determination in soil by inductively coupled plasma optical emission spectrometry using the Bland and Altman test.
J Optoelectron Adv Mater2007,9:3505–3515.
doi:10.1186/1752-153X-7-43
Cite this article as:Frentiuet al.:Validation of an analytical method based on the high-resolution continuum source flame atomic absorption spectrometry for the fast-sequential determination of several hazardous/priority hazardous metals in soil.Chemistry Central Journal20137:43.
Open access provides opportunities to our colleagues in other parts of the globe, by allowing
anyone to view the content free of charge.
Publish with
Chemistry
Central and every
scientist can read your work free of charge
W. Jeffery Hurst, The Hershey Company.
available free of charge to the entire scientific community peer reviewed and published immediately upon acceptance cited in PubMed and archived on PubMed Central yours you keep the copyright
Submit your manuscript here: