AbstrAct
Objectives To examine the emotions associated with drinking different types of alcohol, explore whether these emotions differ by sociodemographics and alcohol dependency and whether the emotions associated with different drink types influence people’s choice of drinks in different settings.
Design International cross-sectional opportunistic survey (Global Drug Survey) using an online anonymous questionnaire in 11 languages promoted through newspapers, magazines and social media from November 2015 to January 2016.
study population Individuals aged 18–34 years who reported consumption of beer, spirits, red and white wine in the previous 12 months and were resident in countries with more than 200 respondents (n=21 countries; 29 836 respondents).
Main outcome measures Positive and negative emotions associated with consumption of different alcoholic beverages (energised, relaxed, sexy, confident, tired, aggressive, ill, restless and tearful) over the past 12 months in different settings.
results Alcoholic beverages vary in the types of emotions individuals report they elicit, with spirits more frequently eliciting emotional changes of all types. Overall 29.8% of respondents reported feeling aggressive when drinking spirits, compared with only 7.1% when drinking red wine (p<0.001). Women more frequently reported feeling all emotions when drinking alcohol, apart from feelings of aggression. Respondents’ level of alcohol dependency was strongly associated with feeling all emotions, with the likelihood of aggression being significantly higher in possible dependent versus low risk drinkers (adjusted OR 6.4; 95% CI 5.79 to 7.09; p<0.001). The odds of feeling the majority of positive and negative emotions also remained highest among dependent drinkers irrespective of setting.
conclusion Understanding emotions associated with alcohol consumption is imperative to addressing alcohol misuse, providing insight into what emotions influence drink choice between different groups in the population. The differences identified between sociodemographic
groups and influences on drink choice within different settings will aid future public health practice to further comprehend individuals’ drinking patterns and influence behaviour change.
IntrODuctIOn
Alcohol use is of international public health
concern with approximately 3.3 million
deaths and 5.1% of the global burden of disease and injury attributable to alcohol
consumption in 2014.1 In addition, there is
a growing body of evidence illustrating the harms caused by those who drink alcohol to individuals around them and to wider communities (eg, through alcohol-related
violence and antisocial behaviour).2–4
Under-standing why people choose particular drink types and whether different drinks elicit
Do emotions related to alcohol
consumption differ by alcohol type? An
international cross-sectional survey of
emotions associated with alcohol
consumption and influence on drink
choice in different settings
Kathryn Ashton,1 Mark A Bellis,1 Alisha R Davies,1 Karen Hughes,1 Adam Winstock2
To cite: Ashton K, Bellis MA, Davies AR, et al. Do emotions related to alcohol consumption differ by alcohol type? An international cross-sectional survey of emotions associated with alcohol consumption and influence on drink choice in different settings. BMJ Open 2017;7:e016089. doi:10.1136/ bmjopen-2017-016089
►Prepublication history and additional material for this paper are available online. To view these files, please visit the journal online (http:// dx. doi. org/ 10. 1136/ bmjopen- 2017- 016089).
Received 25 January 2017 Revised 26 June 2017 Accepted 1 August 2017
1Policy, Research and
International Development, Public Health Wales NHS Trust, Cardiff, Wales
2Department of Psychiatry,
Psychiatry and Neuroscience, King's College London, Addiction Sciences Building, London, UK
correspondence to Kathryn Ashton;
kathryn. ashton@ yahoo. co. uk
strengths and limitations of this study
► The Global Drug Survey is a well-established international survey that allows analysis of both drug and alcohol use.
► Using online methods in multiple languages, the Global Drug Survey 2016 included unique questions on alcohol consumption and emotions related to consuming different types of alcohol.
► All respondents within the sample used for this study drank all types of alcohol included in the analysis.
► Although the sample size for the study is large, the sample is opportunistic and non-probability samples cannot be considered representative of more general population groups.
► Analysis makes the assumption that alcohol consumption behaviours are based on rational choice, which may not always be the case due to confounding factors such as the influence of alcohol on recollection.
on September 22, 2020 by guest. Protected by copyright.
different emotions may help inform more effective public health interventions.
Alcohol consumption has a long-standing association with mood, with evidence showing that people consume alcohol to help regulate emotional experiences, reduce
negative emotions and enhance positive emotions.5 6 A
substantial body of research exists which outlines drinking motives, defined as the gateway to the decision to consume alcohol and makes the assumption that people
drink to achieve a particular goal.7–9 Social motives have
been associated with moderate alcohol use, enhancement motives (for example, increasing levels of confidence) with heavy drinking and coping motives with
alcohol-re-lated problems.7 Evidence also outlines how expectancies
about the perceived consequences of drinking alcohol affects whether people start to drink, become regular
drinkers or become dependent on alcohol.10
Historically, alcohol’s perceived capacity to tempo-rarily reduce negative emotions (and consequently increase pleasure and relaxation) has been regarded
as the primary reason for consumption.11 Individuals
across the USA, Canada and Sweden have previously reported associating generally positive emotions with alcohol consumption, emphasising feelings of relax-ation and reporting alcohol as an antidote to fatigue
and contributing to increasing the values of sociability.12
Social mood enhancement has also been found to be the most highly endorsed reason for drinking, with alcohol consumption being strongly associated with short-term increases in self-reported positive mood, decreases in negative mood and increases in levels of
social bonding.13 However, although alcohol may initially
induce stimulation, consumption has also been associ-ated with triggering negative emotions, such as
aggres-sion and depresaggres-sion14–16 and can lead to out-of-character
actions being undertaken by the drinker and exacerbate
premorbid personality traits.17
Outside cultural myth and folklore, little attention has been paid to the immediate emotions associated with drinking different types of alcohol. Potential differences in the emotional consequences (both positive and nega-tive) of drinking different types of alcohol (for example, spirits vs beer) and how emotional expectations from experiences of different alcohol types influence drink choice remain relatively unexplored areas. However, measures that look to change drinking behaviour and consequently reduce alcohol-related harms could benefit from a better understanding of how different drink types are associated with diverse social and emotional outcomes and how such relationships vary with demographics and drinking situation (for example, whether drinking at home or when out). In this study, we used the interna-tionally established Global Drug Survey (GDS) to identify which drink types are associated with different emotional outcomes in alcohol consumers from 21 countries and how both demographic factors and levels of dependency on alcohol affect such relationships. Finally, we explored whether emotions that respondents associate with
different drink types influence their choices of drinks in different settings.
MethODs Data source
The GDS is the world’s biggest drug survey. Using encrypted online survey methods, the GDS is implemented as an annual, opportunistic, self-reported, cross-sectional survey of alcohol and drug use among adults over the
age of 16 years.18 The GDS 2016 was launched online
in November 2015 in 11 languages (English, German, Greek, Polish, French, Italian, Spanish, Portuguese, Flemish, Hungarian and Danish) and promoted interna-tionally through national media (newspapers, magazines and social media networks). While the GDS non-proba-bility methodology does not allow for the assessment of general population prevalence, the GDS sample enables examination of drug and alcohol behaviours and percep-tions across age groups, gender, sexual preferences, place of residence or mental health status within the sample. GDS can efficiently add nuance and add depth to the findings of more representative surveys, which are often less detailed and based on smaller samples. The GDS has previously been used to examine both alcohol and drug use, for example, exploring the risk of emergency admission after drug use, trends in self-reported drug use such as nitrous oxide and examining harm to others from
alcohol consumption.4 19 20 While it was not designed to
create supranational or nationally representative popula-tion estimates, it does provides access to a large sample of self-selected individuals. Other publications provide full details of other aspects of the utility, design and
limita-tions of the GDS.4 19
Variables
Sociodemographic data were collected on age, sex, country of residence and educational attainment (here categorised into either not attended high school or attended high school) as a proxy for socioeconomic status. The GDS also collects data on the consumption of
both legal and illegal drug use and alcohol use.18 Analyses
within this study focus on individual alcohol use and use a range of questions that asked respondents to self-report what type of alcoholic drink(s) they consume and which different emotions they associated with each alcohol type. Emotions included were both positive (energised, relaxed, sexy and confident) and negative (tired, aggres-sive, ill, restless and tearful). Data were also collected on what types of alcohol were most likely to be drunk at home or when out and levels of consumption for each participant using the Alcohol Use Disorders
Identifica-tion Test (AUDIT) were also calculated.21
study population
In total, 87 925 respondents completed the survey and had reported drinking alcohol in the last 12 months. However, to strengthen the robustness of the effect estimates, the
on September 22, 2020 by guest. Protected by copyright.
Table 1
Overall r
eported emotions by individual type of alcoholic drink (%)
n
Drink type Spirits
95%
CI
Red wine
95%
CI
White wine
95%
CI
Beer
95%
CI
Cochran's Q
p
Positive emotions Ener
gised
29
836
58.36
57.80 to 58.92
7.14
6.84 to 7.43
15.07
14.66 to 15.47
24.76
24.27 to 25.24
23
610.470
<0.001
Confident
29
836
59.08
58.52 to 59.63
27.88
27.37 to 28.39
28.27
27.76 to 28.78
44.54
43.97 to 45.10
11
885.08
<0.001
Relaxed
29
836
20.15
19.70 to 20.61
52.80
52.23 to 53.37
32.67
32.14 to 33.20
49.87
49.30 to 50.43
9578.230
<0.001
Sexy
29
836
42.42
41.85 to 42.98
25.20
24.71 to 25.70
23.73
23.24 to 24.21
18.86
18.41 to 19.31
6261.860
<0.001
Negative emotions Tir
ed
29
836
15.33
14.92 to 15.74
60.08
59.52 to 60.63
18.44
18.00 to 18.88
38.92
38.36 to 39.47
17
024.29
<0.001
Aggr
essive
29
836
29.83
29.31 to 30.35
2.57
2.39 to 2.75
2.74
2.55 to 2.92
6.73
6.44 to 7.01
17
467.32
<0.001
Ill
29
836
47.82
47.26 to 48.39
19.29
18.84 to 19.74
14.50
14.10 to 14.90
16.71
16.28 to 17.13
13
032.62
<0.001
Restless
29
836
27.81
27.30 to 28.32
5.18
4.93 to 5.43
6.43
6.15 to 6.71
9.34
9.01 to 9.67
11
329.91
<0.001
Tearful
29
836
22.24
21.77 to 22.71
17.10
16.67 to 17.52
9.96
9.62 to 10.30
9.88
9.54 to 10.22
3551.28
<0.001
dataset for analyses was restricted to respondents who had reported their sex, were resident in a country which contributed at least 200 responses to the overall survey and were aged 18–34 years old. In total, 4271 cases were excluded due to low country response and 23 076 were excluded as they were out of the desired age range leaving a sample of 60 578. All respondents to the survey reported their gender. For the purposes of examining emotional relationships with different alcohol types, only individuals who had consumed all alcohol types of interest (ie, spirits, red wine, white wine and beer) at some point in the last 12 months and had indicated one of these as their main drink when at home and when outside of the home were included. Although some respondents reported drinking other beverages, for example cider, the numbers were too small for inclusion in the analysis. This resulted in a final sample size of 29 836. Full details of sample demographics used in the analysis are outlined in the online supplemen-tary table A.
statistical methods
To identify and quantify the strength of association
between variables used in the analysis, χ2, Cochran’s
Q, McNemar’s test and logistic regression modelling were undertaken in SPSS V.23. Demographics included in analyses were age (categorised as 18–24, 25–29 and 30–34 years), sex, country of residence, educational attainment and levels of dependency on alcohol (based on the AUDIT questionnaire score). Respondents were classified into the following dependency categories: 0–7, low risk; 8–15, increasing risk; 16–19, higher risk; 20+,
possible dependence.21 The emotions associated with
drinking individual types of alcohol were analysed. The emotions individuals experienced regardless of the drink they associated with each emotion were combined to make a set of variables that describe the emotions asso-ciated with drinking any of the different types of alcohol (spirits, white wine, red wine and beer). In addition, to analyse how emotions relate to drink choice in different settings, what drinks were reported to be most consumed in different settings and the emotions that people asso-ciate with those particular drink types were linked.
results
Results indicated that respondents attributed different
emotions to drinking different types of alcohol (table 1).
Over half of all respondents associated drinking spirits with emotions of energy and confidence and 42.4% reported that drinking spirits made them feel sexy. Respondents were most likely to report feeling relaxed (52.8%) when drinking red wine; although almost half of respondents also reported feeling relaxed when drinking
beer (table 1). Drinking spirits was more likely to draw
out feelings of aggression, illness, restlessness and
tear-fulness than all other drink types (table 1). However, red
wine was the most likely to make individuals feel tired
(60.1%, table 1).
on September 22, 2020 by guest. Protected by copyright.
emotional associations with drinking any type of alcohol (spirits, white wine, red wine and beer)
Differences in emotions reported by respondents when drinking alcohol of any type (inclusive of spirits, white wine, red wine and beer) were examined for sociode-mographic groups. With the exception of feeling aggres-sive, women were significantly more likely than men to report each emotion as a result of drinking any type of
alcohol (table 2). Younger age groups (18–24 years) most
frequently reported most emotion types when drinking alcohol. Exceptions were aggression and tiredness where
there was no significant association with age (table 2).
Respondents’ alcohol consumption (AUDIT score) was strongly associated with both positive and negative emotions, with heavier drinkers more likely to report all emotional changes as a result of drinking. This relation-ship was especially strong for the emotions of aggression,
whereas the increase in tiredness was negligible(table 2).
A greater proportion of those with lower educational attainment reported both positive (energised, sexy or confident) and negative (aggressive, ill or tearful) emotions when drinking alcohol compared with those
who had attended high school (table 2). Bivariate
associ-ations between emotions and both alcohol dependence level and demographics remained significant after using logistic regression modelling to control for confounding
relationships between variables (table 3; see online
supplementary table B for country of residence). Thus, women had higher odds of feeling all emotions compared with men apart from aggression where men had signifi-cantly higher odds. Younger age groups had higher odds of feeling all emotions apart from tiredness and aggres-sion. Odds of reporting all emotions except tiredness increased with AUDIT score category, in particular
feel-ings of aggression (table 3). Differences in emotions were
also reported by respondents from different countries with the highest association with the positive emotions of feeling energised, relaxed and sexy being the South American sample of Colombia and Brazil. For negative emotions, the country sample with the strongest associa-tion with aggression when drinking alcohol was Norway and for feeling restless was France (online supplementary table B). However, caution must be taken when inter-preting these results due to the small sample for each country.
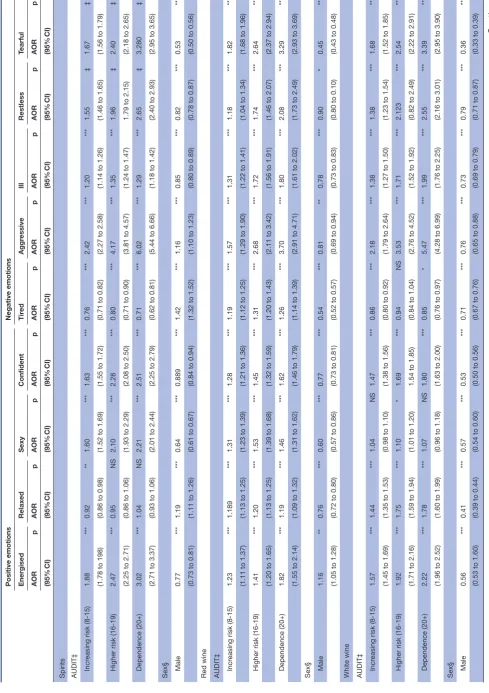
emotional associations by individual drink type
For each individual drink type, positive emotions were more frequently reported by those with higher alcohol dependency scores. This was also true of nega-tive emotions, with the exception of feeling tired when drinking spirits or white wine. Women were more likely to report each emotion when drinking spirits, red wine and white wine, with the exceptions of feeling relaxed, tired or aggressive with spirits, and energised with red wine. Men were more likely to report each emotion when
drinking beer, apart from feeling tearful (table 4).
Emotions reported with each alcohol type varied by age group. For example, feeling tired or relaxed when drinking spirits and red wine were more frequently reported by the youngest age group, whereas for white wine and beer, these emotions were more frequently reported by the oldest age group. In addition, emotions associated with each drink type were more frequently reported by respondents who had not attended high school or higher education, with the exception of feeling sexy, ill or restless when drinking spirits, relaxed or tired when drinking red wine and energised or relaxed when drinking beer. Italian residents more frequently reported feeling energised while drinking red wine and those from Colombia were more likely to report feeling energised when drinking spirits (see online supplementary tables C,D).
emotional associations with any type of alcohol by choice of drink in different settings
Finally, how the different emotions associated with drink type influence people’s choices of alcoholic beverages in different settings was examined, taking into account
confounding demographic factors (table 5A,B; see online
supplementary table E). For each type of emotion, signif-icant differences were reported between emotions elic-ited by the types of drinks which were mostly drunk at
home compared with a night out (table 5B). Reporting
a dependency on alcohol showed a strong association with drinking any type of alcohol which made them feel energised, sexy and confident whether drinking at home or when out. In addition, respondents dependent on alcohol reported a greater tendency to select any type of drink that elicited emotions of aggression and tear-fulness when drinking at home or when out. The associ-ation between emotions of aggression and dependency was noticeably strongest, independent of setting. Women more frequently reported drinking types of alcohol at home and when out which elicit the emotion of feeling
sexy compared with men (table 5B).
The youngest age group indicated a very strong rela-tionship with choosing any type of alcohol that made them feel energised, sexy and confident when drinking outside of the home. However, these relationships were not as strong when drinking at home. The oldest age group more frequently chose to drink alcohol that made them feel tired and relaxed when out and the youngest age groups selecting drinks that made them feel tired when drinking at home (see online supplementary table E).
DIscussIOn
Using an international sample, our study found that different types of alcohol are associated with different types of emotions, eliciting both positive and negative
emotions (table 1), and highlights the complex
relation-ships between drink choice, emotions and the settings in which alcohol is consumed. Emotions were found to differ
on September 22, 2020 by guest. Protected by copyright.
Table 2
Bivariate r
elationship between emotions associated with drinking any type of alcohol† and AUDIT scor
e and sociodemographics (%)
n
Emotions associated with drinking any type of alcohol† Positive emotions
Negative emotions
Energised
Relaxed
Sexy
Confident
Tir
ed
Aggr
essive
Ill
Restless
Tearful
AUDIT Lower
risk
(0–7)
10
577
61.11
83.32
51.74
65.78
85.07
20.28
62.33
29.25
26.78
Incr
easing
risk
(8-15)
14
205
79.25
90.55
65.91
80.76
87.83
38.24
72.22
39.63
39.87
Higher
risk
(16-19)
2895
86.60
93.16
73.92
87.63
89.50
52.71
79.24
48.70
50.78
Dependence
(20+)
2159
90.13
93.61
73.83
89.95
88.42
63.08
80.64
55.16
59.70
χ
2
1659.410
452.744
868.464
1244.958
63.389
2218.420
563.548
770.746
1220.481
p
***
***
***
***
***
***
***
***
***
Sex Male
19
934
73.01
88.06
57.17
75.88
85.45
36.97
67.45
36.98
32.27
Female
9902
76.96
89.28
72.43
78.61
90.29
31.27
75.16
39.92
48.71
χ
2
54.179
9.635
655.165
27.760
137.980
94.407
187.240
24.269
761.188
p
***
**
***
***
***
***
***
***
***
Age (years) 18–24
16
333
79.30
89.19
67.03
81.36
86.97
35.39
72.32
40.06
40.38
25–29
8744
70.53
87.98
59.00
73.28
87.64
35.16
68.57
36.76
35.94
30–34
4759
64.22
86.85
51.73
67.49
86.28
33.83
64.70
32.95
31.88
χ
2
532.72
22.585
422.007
482.601
5.278
3.993
114.045
86.724
130.036
p
***
***
***
***
NS
NS
***
***
***
Attended high school Ye
s
29
365
74.17
88.42
62.13
76.64
87.05
34.95
69.85
37.91
37.61
No
471
84.08
91.08
68.79
85.99
87.26
43.10
79.62
41.19
45.01
χ
2
23.855
3.224
8.743
22.742
0.0180
13.5330
21.0560
2.1220
10.8190
p
***
NS
**
***
NS
***
***
NS
***
*p<0.05, **p<0.01, ***p<0.001. †Emotions fr
om drinking r
espondents r
eported r
egar
dless of the type of alcohol they associate it with. Includes emotions associated with drinking spirits, white wine, r
ed wine and beer
.
AUDIT
, alcohol use disor
ders identification test; NS, not significant.
on September 22, 2020 by guest. Protected by copyright.
Table 3
Logistic r
egr
ession model† for AUDIT scor
e and sociodemographic r
elationships with emotions associated with drinking any type of alcohol‡
Emotions associated with drinking any type of alcohol‡
n
Positive emotions Energised
Relaxed
Sexy
Confident
AOR
(95%
CI)
p
AOR
(95%
CI)
p
AOR
(95%
CI)
p
AOR
(95%
CI)
p
AUDIT Lower
risk
(0–7)§
10
577
Incr
easing
risk
(8-15)
14
205
2.28 (2.15 to 2.42)
***
1.86 (1.73 to 2.02)
***
1.83 (1.73 to 1.93)
***
2.03 (1.92 to 2.16)
***
Higher
risk
(16-19)
2895
3.51 (3.12 to 3.94)
***
2.55 (2.19 to 2.98)
***
2.64 (2.40 to 2.90)
***
3.18 (2.82 to 3.59)
***
Dependence
(20+)
2159
4.73 (4.07 to 5.50)
***
2.66 (2.21 to 3.19)
***
2.58 (2.32 to 2.87)
***
3.86 (3.33 to 4.48)
***
Sex Female§
9902
Male
19
934
0.73 (0.69 to 0.78)
***
0.86 (0.80 to 0.93)
***
0.48 (0.45 to 0.50)
***
0.82 (0.77 to 0.87)
***
Age (years) 18–24§
16
333
25–29
8744
0.70 (0.65 to 0.74)
***
0.96 (0.88 to 1.04)
NS
0.77 (0.73 to 0.82)
***
0.69 (0.65 to 0.74)
***
30–34
4759
0.52 (0.48 to 0.56)
***
0.90 (0.81 to 1.00)
*
0.61 (0.57 to 0.65)
***
0.53 (0.49 to 0.57)
***
Attended high school No§
471
Ye
s
29
365
0.86 (0.66 to 1.11)
NS
1.08 (0.78 to 1.50)
NS
0.97 (0.79 to 1.20)
NS
0.78 (0.60 to 1.03)
NS
n
Negative emotions Tir
ed
Aggr
essive
Ill
Restless
Tearful
AOR
(95%
CI)
p
AOR
(95%
CI)
p
AOR
(95%
CI)
p
AOR
(95%
CI)
p
AOR
(95%
CI)
p
AUDIT Lower
risk
(0–7)§
10
577
1.35
***
2.40
***
1.40
***
1.55
***
1.90
***
Incr
easing
risk
(8-15)
14
205
(1.25 to 1.45)
(2.27 to 2.55)
(1.33 to 1.49)
(1.47 to 1.64)
(1.79 to 2.01)
1.64
***
4.26
***
1.83
***
2.18
***
2.96
***
Higher
risk
(16-19)
2895
(1.43 to 1.87)
(3.90 to 4.66)
(1.65 to 2.03)
(2.00 to 2.38)
(2.71 to 3.23)
1.49
***
6.41
***
1.82
***
2.81
***
4.25
***
Dependence
(20+)
2159
(1.28 to 1.72)
(5.79 to 7.09)
(1.35 to 2.03)
(2.55 to 3.10)
(3.84 to 4.70)
Sex Female§
9902
0.63
***
1.18
***
0.66
***
0.84
***
0.45
***
Male
19
934
(0.58 to 0.68)
(1.12 to 1.24)
(0.62 to 0.70)
(0.80 to 0.88)
(0.43 to 0.48)
Age (years) 18–24§
16
333
1.10
*
1.11
***
0.96
***
0.92
**
0.90
***
25–29
8744
(1.01 to 1.19)
(1.04 to 1.17)
(0.91 to 1.02)
(0.87 to 0.97)
(0.85 to 0.95)
Continued
on September 22, 2020 by guest. Protected by copyright.
n Negative emotions Tir
ed
Aggr
essive
Ill
Restless
Tearful
AOR
(95%
CI)
p
AOR
(95%
CI)
p
AOR
(95%
CI)
p
AOR
(95%
CI)
p
AOR
(95%
CI)
p
1.04
NS
1.09
***
0.80
***
0.79
***
0.82
***
30–34
4759
(0.94 to 1.14)
(1.01 to 1.17)
(0.74 to 0.86)
(0.74 to 0.85)
(0.76 to 0.88)
Attended high school No§
471
1.12
NS
0.91
NS
0.86
NS
1.05
NS
0.8329
NS
Ye
s
29
365
(0.85 to 1.48)
(0.74 to 1.10)
(0.68 to 1.10)
(0.87 to 1.28)
(0.68 to 1.01)
*p<0.05, **p<0.01, ***p<0.001. †Emotions fr
om drinking r
espondents r
eported r
egar
dless of the type of alcohol they associate it with. Includes emotions associated with drinking spirits, white wine, r
ed wine and beer
.
§Refer
ence category
.
†Country of r
esidence was also included in the logistic r
egr
ession model. See online supplementary table B.
‡ Emotions fr
om drinking r
espondents r
eported r
egar
dless of the type of alcohol they associate it with. Includes emotions associated with drinking spirits, white wine, r
ed wine and beer
.
AOR, adjusted OR; AUDIT
, alcohol use disor
ders identification test; NS, not significant.
Table 3
Continued
substantially between different demographic groups, and these relationships were maintained after accounting for confounding sociodemographics and level of alcohol
dependency (table 3). The association between drinking
spirits and the emotion of aggression was a key finding with 29.8% of respondents reporting this relationship, significantly higher than other types of alcohol (p<0.001;
table 1). Findings suggest dependent drinkers (AUDIT >20) rely on alcohol to obtain the positive emotions they associated with drinking, being five times more likely to feel energised compared with low risk drinkers (adjusted
OR (AOR) 4.7; 95% CI 4.07 to 5.50; table 3). However,
heavier drinkers also reported negative emotions more frequently with respondents being just over six times more likely to report feelings of aggression (AOR 6.4;
95% CI 5.79 to 7.09; p<0.001; table 3), which may in part
be a result of drinking greater quantities of alcohol in a session so increasing the impact on emotions. Conversely, relationships between tiredness and drinking pattern were negligible and for some drink types (spirits, white wine), heavier drinkers were less likely to report feelings of tiredness. These results are consistent with existing evidence on heavy drinking and alcohol dependence, including the development of tolerance to the sedative
effects of alcohol.22 23 The reported emotions for wine
differed, with red wine drinkers more likely to report tiredness than white wine drinkers. Within the limits of the GDS, it was not possible to explore, for instance whether this was due to drinking each at different times of day or expected effects of specific alcoholic drinks poten-tially influenced by culture or marketing. Women more frequently reported all emotions apart from feelings of aggression, and younger age groups more frequently reported all emotions with the exception of aggression
and tiredness (table 3). Our findings support previous
research which highlights that male beer drinkers show
less aggression than men who drink spirits (table 4).24
Spirits are a popular choice of drink in a number of countries, with substantial proportions of the
popula-tion consuming spirits on a regular basis.25 Within our
sample, spirits were more likely than beer, red wine and white wine to elicit the majority of positive emotions when consumed. However, they were also more likely
to be associated with negative emotions (table 4). These
findings suggest that individuals make the assumption that positive emotions associated with drinking particular types of alcohol will outweigh the negative emotions. The continued selection of particular types of alcohol with negative emotional outcomes may in part rely on positive emotions being emphasised by almost ubiquitous
adver-tising26 27 and negative emotions framed as infrequent
and largely a result of abuse. Finally, our results show that individuals dependent on alcohol more frequently associ-ated emotions with alcohol whether they were drinking at
home or when out (table 5).
Existing literature illustrates that previous experiences with alcohol are related to intentions to drink alcohol in
the future.28 Our analyses suggest that individuals are, to
on September 22, 2020 by guest. Protected by copyright.
Table 4
Logistic r
egr
ession models† for AUDIT scor
e and sociodemographic r
elationships with emotions associated with drinking an individual type of alcohol
Positive emotions Negative emotions Energised Relaxed Sexy Confident Tir ed Aggr essive Ill Restless Tearful AOR p AOR p AOR p AOR p AOR p AOR p AOR p AOR p AOR p (95% CI) (95% CI) (95% CI) (95% CI) (95% CI) (95% CI) (95% CI) (95% CI) (95% CI)
Spirits AUDIT‡ Incr
easing risk (8-15) 1.88 *** 0.92 ** 1.60 *** 1.63 *** 0.76 *** 2.42 *** 1.20 *** 1.55 ‡ 1.67 ‡
(1.78 to 198)
(0.86 to 0.98)
(1.52 to 1.69)
(1.55 to 1.72)
(0.71 to 0.82)
(2.27 to 2.58)
(1.14 to 1.26)
(1.46 to 1.65)
(1.56 to 1.79)
Higher risk (16-19) 2.47 *** 0.95 NS 2.10 *** 2.28 *** 0.80 *** 4.17 *** 1.35 *** 1.96 ‡ 2.40 ‡
(2.25 to 2.71)
(0.86 to 1.06)
(1.93 to 2.29)
(2.08 to 2.50)
(0.71 to 0.90)
(3.81 to 4.57)
(1.24 to 1.47)
1.79 to 2.15)
(2.18 to 2.65)
Dependence (20+) 3.02 *** 1.04 NS 2.21 *** 2.51 *** 0.71 *** 6.02 *** 1.29 *** 2.65 ‡ 3.280 ‡
(2.71 to 3.37)
(0.93 to 1.06)
(2.01 to 2.44)
(2.25 to 2.79)
(0.62 to 0.81)
(5.44 to 6.66)
(1.18 to 1.42)
(2.40 to 2.93)
(2.95 to 3.65)
Sex§ Male
0.77 *** 1.19 *** 0.64 *** 0.889 *** 1.42 *** 1.16 *** 0.85 *** 0.82 *** 0.53 ***
(0.73 to 0.81)
(1.11 to 1.26)
(0.61 to 0.67)
(0.84 to 0.94)
(1.32 to 1.52)
(1.10 to 1.23)
(0.80 to 0.89)
(0.78 to 0.87)
(0.50 to 0.56)
Red wine AUDIT‡ Incr
easing risk (8-15) 1.23 *** 1.189 *** 1.31 *** 1.28 *** 1.19 *** 1.57 *** 1.31 *** 1.18 *** 1.82 ***
(1.11 to 1.37)
(1.13 to 1.25)
(1.23 to 1.39)
(1.21 to 1.36)
(1.12 to 1.25)
(1.29 to 1.90)
(1.22 to 1.41)
(1.04 to 1.34)
(1.68 to 1.96)
Higher risk (16-19) 1.41 *** 1.20 *** 1.53 *** 1.45 *** 1.31 *** 2.68 *** 1.72 *** 1.74 *** 2.64 ***
(1.20 to 1.65)
(1.13 to 1.25)
(1.39 to 1.68)
(1.32 to 1.59)
(1.20 to 1.43)
(2.11 to 3.42)
(1.56 to 1.91)
(1.46 to 2.07)
(2.37 to 2.94)
Dependence (20+) 1.82 *** 1.19 *** 1.46 *** 1.62 *** 1.26 *** 3.70 *** 1.80 *** 2.08 *** 3.29 ***
(1.55 to 2.14)
(1.09 to 1.32)
(1.31 to 1.62)
(1.46 to 1.79)
(1.14 to 1.39)
(2.91 to 4.71)
(1.61 to 2.02)
(1.73 to 2.49)
(2.93 to 3.69)
Sex§ Male
1.16 ** 0.76 *** 0.60 *** 0.77 *** 0.54 *** 0.81 ** 0.78 *** 0.90 * 0.45 ***
(1.05 to 1.28)
(0.72 to 0.80)
(0.57 to 0.86)
(0.73 to 0.81)
(0.52 to 0.57)
(0.69 to 0.94)
(0.73 to 0.83)
(0.80 to 0.10)
(0.43 to 0.48)
White wine AUDIT‡ Incr
easing risk (8-15) 1.57 *** 1.44 *** 1.04 NS 1.47 *** 0.86 *** 2.18 *** 1.38 *** 1.38 *** 1.68 ***
(1.45 to 1.69)
(1.35 to 1.53)
(0.98 to 1.10)
(1.38 to 1.56)
(0.80 to 0.92)
(1.79 to 2.64)
(1.27 to 1.50)
(1.23 to 1.54)
(1.52 to 1.85)
Higher risk (16-19) 1.92 *** 1.75 *** 1.10 * 1.69 *** 0.94 NS 3.53 *** 1.71 *** 2.123 *** 2.54 ***
(1.71 to 2.16)
(1.59 to 1.94)
(1.01 to 1.20)
1.54 to 1.85)
(0.84 to 1.04)
(2.76 to 4.52)
(1.52 to 1.92)
(0.82 to 2.49)
(2.22 to 2.91)
Dependence (20+) 2.22 *** 1.78 *** 1.07 NS 1.80 *** 0.85 * 5.47 *** 1.99 *** 2.55 *** 3.39 ***
(1.96 to 2.52)
(1.60 to 1.99)
(0.96 to 1.18)
(1.63 to 2.00)
(0.76 to 0.97)
(4.28 to 6.99)
(1.76 to 2.25)
(2.16 to 3.01)
(2.95 to 3.90)
Sex§ Male
0.56 *** 0.41 *** 0.57 *** 0.53 *** 0.71 *** 0.76 *** 0.73 *** 0.79 *** 0.36 ***
(0.53 to 1.60)
(0.39 to 0.44)
(0.54 to 0.60)
(0.50 to 0.56)
(0.67 to 0.76)
(0.65 to 0.88)
(0.69 to 0.79)
(0.71 to 0.87)
(0.33 to 0.39)
Continued
on September 22, 2020 by guest. Protected by copyright.
Positive emotions
Negative emotions
Energised
Relaxed
Sexy
Confident
Tir
ed
Aggr
essive
Ill
Restless
Tearful
AOR
p
AOR
p
AOR
p
AOR
p
AOR
p
AOR
p
AOR
p
AOR
p
AOR
p
(95%
CI)
(95%
CI)
(95%
CI)
(95%
CI)
(95%
CI)
(95%
CI)
(95%
CI)
(95%
CI)
(95%
CI)
Beer AUDIT‡ Incr
easing
risk
(8-15)
1.58
***
1.36
***
1.55
***
1.58
***
1.02
NS
1.70
***
1.06
NS
1.37
***
1.63
***
(0.15 to 1.68)
(1.29 to 1.43)
(1.45 to 1.66)
(1.50 to 1.66)
(0.97 to 1.08)
(1.51 to 1.91)
(0.97 to 1.12)
(1.25 to 1.51)
(1.48 to 1.79)
Higher
risk
(16-19)
1.94
***
1.50
***
1.98
***
1.98
***
1.09
*
2.56
***
1.09
NS
1.77
***
2.32
***
(1.77 to 2.14)
(1.37 to 1.63)
(1.79 to 2.20)
(1.81 to 2.15)
(1.00 to 1.19)
(2.19 to 3.00)
(0.98 to 1.22)
(1.55 to 2.03)
(1.03 to 2.65)
Dependence
(20+)
2.14
***
1.63
***
1.94
***
1.96
***
1.11
*
3.28
***
1.08
NS
2.41
***
3.00
***
(1.93 to 2.38)
(1.48 to 1.79)
(1.72 to 2.18)
(1.78 to 2.16)
(1.00 to 1.22)
(2.79 to 3.86)
(0.95 to 1.22)
(2.09 to 2.77)
(1.61 to 3.45)
Sex§ Male
1.25
***
1.77
***
1.41
***
1.55
***
1.46
***
1.59
***
0.67
***
1.01
NS
0.99
NS
(1.18 to 1.32)
(1.69 to 1.86)
(1.32 to 1.51)
(1.48 to 1.63)
(1.39 to 1.54)
(1.43 to 1.77)
(0.63 to 0.72)
(0.93 to 1.10)
(0.91 to 1.07)
*p<0.05, **p<0.01, ***p<0.001. †Country of r
esidence, age and educational attainment was also included in the lo
gistic r
egr
ession model. See online supplementary table D.
‡Refer
ence category is lower risk (0–7).
§Refer
ence category is female.
AOR, adjusted OR; AUDIT
, alcohol use disor
ders identification test; NS, not significant.
Table 4
Continued
on September 22, 2020 by guest. Protected by copyright.
Table 5A Bivariate association† for emotions associated with drinking any type of alcohol‡ by setting, AUDIT score and socio-demographic relationships
n (%)§ χ2 (p)†
Positive emotions
Mostly drank a drink associated with feeling
Energised At home 8008 (26.84) 3683.349 (***)
When out 13 259 (44.44)
Relaxed At home 19 271 (64.59) 3428.640 (***)
When out 13 929 (46.69)
Sexy At home 9244 (30.98) 257.954 (***)
When out 10 458 (35.05)
Confident At home 14 613 (48.98)
When out 17 673 (59.23) 1642.240 (***)
Negative emotions
Mostly drank a drink associated with feeling
Tired At home 12 535 (42.01)
When out 8394 (28.13) 2204.450 (***)
Aggressive At home 1888 (6.33)
When out 4087 (13.7) 1646.066 (***)
Ill At home 3653 (12.24)
When out 6077 (20.37) 135.873 (***)
Restless At home 2589 (8.68)
When out 4583 (15.36) 1336.490 (***)
Tearful At home 4367 (14.64)
When out 4573 (15.33) 13.636 (***)
*p<0.05, **p<0.01, ***p<0.001. †McNemar's test (χ2).
‡Emotions from drinking respondents reported regardless of the type of alcohol they associate it with. Includes emotions associated with drinking spirits, white wine, red wine and beer.
§Refers to the number and percentage of respondents out of the whole sample (n=836) who stated that they mostly drank a type of drink which makes them feel particular emotions in different settings.
AOR, adjusted odds ratios; AUDIT, alcohol use disorders identification test; NS, not significant.
some extent, consuming beverages in different settings based on the emotions they perceive to be associated
with particular types of alcohol (table 5). These findings
suggest that individuals inadvertently select drinks which are known to elicit negative emotions because they crave the positive emotions that go with them and link with existing evidence that those dependent on alcohol drink alcohol as a coping mechanism rather than drinking for
pleasure.7 This was evident particularly among heavier
drinkers. This highlights a potential emotional gap which individuals may be looking to fill by drinking alcohol. This gap can be a concern, particularly with exploita-tion by the alcohol industry with advertising focused on pushing the positive emotions associated with alcohol use without outlining the negatives which go alongside them.
Understanding the relationship between different types of alcohol and the emotions and associated behaviours they may elicit may help improve public health messages and health promotion and may help to prevent escalation
to dependent drinking.6 7 10 The results from this study
can be used to influence behaviour change policy and contribute significantly to the limited evidence base on alcohol use and emotions. Previous studies have tended
to focus on the effect of alcohol as a whole.5 6 These
results suggest that the different types of alcohol are not necessarily perceived or used in the same way and there-fore harm prevention policy may benefit from treating types of drinks differently, especially when addressing spirits and, for instance their significant association with
aggression (table 4).
A strength of the GDS is that it allows relationships between alcohol and emotions to be explored within a large, international sample which includes a high propor-tion of younger age respondents who can be difficult to capture via telephone or face-to-face interviews. This age group corresponds with age groups often studied within this field of research, for example students and
adoles-cents.5 15 28 Using a unique range of questions, the survey
data allowed for novel analysis on how groups within the survey population associate emotions with different types
on September 22, 2020 by guest. Protected by copyright.
Table 5B
Logistic r
egr
ession model† for emotions associated with drinking any type of alcohol‡ by setting§, AUDIT scor
e and sociodemographic r
elationships
At home
When out
At home
When out
At home
When out
At home
When out
AOR
(95%
CI)
p
AOR
(95%
CI)
p
AOR
(95%
CI)
p
AOR
(95%
CI)
p
AOR
(95%
CI)
p
AOR
(95%
CI)
p
AOR
(95%
CI)
p
AOR
(95%
CI)
p
Positive emotions
Energised
Relaxed
Sexy
Confident
AUDIT Lower risk (0–7)¶ Incr
easing risk (18-15)
1.56 (1.47 to 1.66)
***
1.65 (1.57 to 1.75)
***
1.20 (1.14 to 1.27)
***
1.134 (1.08 to 1.20)
***
1.45 (1.37 to 1.54)
***
1.52 (1.43 to 1.60)
***
1.56 (1.48 to 1.65)
***
1.66 (1.58 to 1.75)
***
Higher risk (16-19)
2.08 (1.90 to 2.28)
***
2.25 (2.07 to 2.46)
***
1.34 (1.23 to 1.47)
***
1.17 (1.08 to 1.28)
***
1.812 (1.66 to 1.99)
***
1.98 (1.82 to 2.17)
***
2.06 (1.89 to 2.24)
***
2.34 (2.14 to 2.57)
***
Dependence
(20+)
2.61 (2.36 to 2.88)
***
2.59 (2.35 to 2.86)
***
1.32 (1.19 to 1.46)
***
1.18 (1.07 to 1.30)
***
1.96 (1.77 to 2.16)
***
2.08 (1.88 to 2.29)
***
2.15 (1.95 to 2.37)
***
2.31 (2.08 to 2.56)
***
Sex Female¶ Male
1.09 (1.03 to 1.15)
**
0.76 (0.72 to 0.80)
***
0.91 (0.86 to 0.95)
***
1.34 (1.27 to 1.41)
***
0.54 (0.51 to 0.57)
***
0.64 (0.61 to 0.68)
***
0.99 (0.94 to 1.04)
NS
0.93 (0.86 to 0.98)
**
Negative emotions
Tir
ed
Aggr
essive
Ill
Tearful
AUDIT Lower risk (0–7)¶ Incr
easing risk (18–15)
0.99 (0.94 to 1.04)
NS
0.90 (0.85 to 0.95)
***
1.96 (1.91 to 2.23)
***
2.14 (1.96 to 2.34)
***
1.20 (1.10 to 1.30)
***
1.18 (1.11 to 1.27)
***
1.70 (1.56 to 1.84)
***
1.71 (1.58 to 1.85)
***
Higher risk (16–19)
0.99 (0.91 to 1.08)
NS
0.98 (0.81 to 0.98)
*
3.62 (3.08 to 4.26)
***
3.61 (3.21 to 4.06)
***
1.42 (1.26 to 1.61)
***
1.35 (1.22 to 1.50)
***
2.49 (2.22 to 2.79)
***
2.53 (2.26 to 2.82)
***
Dependence
(20+)
0.90 (0.82 to 0.99)
*
0.85 (0.76 to 0.94)
**
5.13 (4.35 to 6.05)
***
5.10 (4.51 to 5.76)
***
1.61 (1.41 to 1.84)
***
1.43 (1.29 to 1.61)
***
3.62 (3.21 to 4.08)
***
3.57 (8.18 to 4.02)
***
Sex Female¶ Male
1.05 (1.00 to 1.11)
*
1.66 (1.56 to 1.75)
***
1.54 (1.38 to 1.72)
***
1.11 (0.94 to 1.10)
NS
0.86 (0.80 to 0.93)
***
0.76 (0.72 to 0.81)
***
0.52 (0.49 to 0.56)
***
0.59 (0.55 to 0.93)
***
*p<0.05, **p<0.01, ***p<0.001. †Country of r
esidence, age and educational attainment was also included in the logistic r
egr
ession model. See online Supplementary T
able E.
‡Emotions fr
om drinking r
espondents r
eported r
egar
dless of the type of alcohol they associate it with. Includes emotions associated with drinking spirits, white wine, r
ed wine and beer
.
§Respondents r
eported which drink type they mostly drank when at home and when out.
¶Refer
ence category
.
AOR, adjusted odds ratios; AUDIT
, alcohol use disor
ders identification test; NS, not significant.
on September 22, 2020 by guest. Protected by copyright.
of alcohol in different settings. More specific surveys which are perhaps limited for instance to only one country (eg, the National Epidemiologic Survey on Alcohol
and Related Conditions (NESARC) in America29) can
examine these issues in more details within a more tightly defined respondent group.
Although the sample size for the study is large, the opportunistic nature of the survey means it should not be considered representative of any country or region. Thus, the analyses undertaken should not be considered to represent proportions of any population other than the study sample. As the sample was self-selected, there may be an over-representation of individuals who are more likely to participate in drug and alcohol use. The sample may also be biased towards those with access to the internet. However, confounders of sociodemographics and alcohol dependency were accounted for in the anal-ysis to illustrate the associations between emotions and drink types in different groups of the population. This study uses data which has been self-reported by respon-dents and the emotions associated with alcohol consump-tion may have been affected by confounding factors such as mood prior to drinking and mixing of alcohol drink type in individual drinking sessions which were unable to be controlled for. Additionally, without knowledge about the amount of alcohol consumed and the rate at which it was drunk, such inferences remain speculative. Respondents may have also undertaken other activities while consuming specific drinks such as dancing, social-ising and drug use, which may have affected emotions reported to be associated with each drink type. We also cannot rule out the impact of recall bias and the delib-erate misreporting of results.
This study is an initial exploration to understand the relationships between perceived emotions and alcohol consumption. Further research is required into why people choose to consume specific drink types in different settings, their mood prior to drinking, drinking patterns including combination of drinks consumed on individual occasions, differences in alcohol volume, mixers consumed with drinks and the effect of alcohol advertising on the perceived mood of drinkers. This arena of evidence may also benefit from additional quali-tative research to further understand how alcohol makes people feel and how this affects drink choice in different settings. Research using an experimental approach is also an area for future research to examine the immediate effects on individual emotions when consuming alcohol.
cOnclusIOn
This research adds international evidence to a limited number of studies undertaken on the feelings associated with drinking different types of alcohol and how such rela-tionships may influence what alcohol is being consumed in different settings. Findings show that individuals asso-ciate different emotional responses with different alcohol types and identify variation in such emotions between
demographic groups. Feeling positive emotions may in part be related to the promotion of positive experiences by advertising and the media, but the case for experi-encing negative emotions is less well founded given that negative emotions are generally not promoted. Emotions experienced could also be related to when the alcohol is drunk, the levels of alcohol within each beverage type and the different compounds found in different drinks. Consequently, this study represents an initial exploration of alcohol's perceived relationship with emotions on an international basis across a large sample of young people. Moreover, alcohol already plays a large part in violence in many countries, but the concept that consumption of different alcohol products may be more likely to result in violence is rarely reflected in public health responses. Results from these analyses can be used by public health bodies to better understand alcohol consumption behaviour and to inform strategies and interventions to promote changes in consumption, particularly among heavier drinkers.
contributors AW developed and directed the survey. MAB conceived and designed
the survey questions on alcohol. AW coordinated data collection and KA carried out data cleaning on the alcohol data. KA performed the statistical analyses and drafted the manuscript. All authors drafted, edited and approved the final manuscript.
competing interests None declared.
Provenance and peer review Not commissioned; externally peer reviewed.
Data sharing statement No additional data sharing available.
Open Access This is an Open Access article distributed in accordance with the
Creative Commons Attribution Non Commercial (CC BY-NC 4.0) license, which permits others to distribute, remix, adapt, build upon this work non-commercially, and license their derivative works on different terms, provided the original work is properly cited and the use is non-commercial. See: http:// creativecommons. org/ licenses/ by- nc/ 4. 0/
© Article author(s) (or their employer(s) unless otherwise stated in the text of the article) 2017. All rights reserved. No commercial use is permitted unless otherwise expressly granted.
references
1. World Health Organisation. Global status report on alcohol and health 2014. Geneva: World Health Organisation, 2014 http://www. who. int/ substance_ abuse/ publications/ global_ alcohol_ report/ en/ (accessed 16 Nov 2016).
2. Lewis-Laietmark C, Wettlaufer A, Shield KD, et al. The effects of alcohol-related harms to others on self-perceived mental well-being in a Canadian sample. Int J Public Health 2017;62:669–78. 3. Lund IO, Moan IS, Storvoll EE. Harm from others’ drinking: how
problematic do people with and without experience of harm perceive it to be? Int J Drug Policy 2016;38:43–9.
4. Bellis MA, Quigg Z, Hughes K, et al. Harms from other people’s drinking: an international survey of their occurrence, impacts on feeling safe and legislation relating to their control. BMJ Open
2015;5:e010112.
5. Luhtanen RK, Crocker J. Alcohol use in college students: effects of level of self-esteem, narcissism, and contingencies of self-worth.
Psychol Addict Behav 2005;19:99–103.
6. Cooper ML, Frone MR, Russell M, et al. Drinking to regulate positive and negative emotions: a motivational model of alcohol use. J Pers Soc Psychol 1995;69:990–1005.
7. Kuntsche E, Knibbe R, Gmel G, et al. ‘I drink spirits to get drunk and block out my problems.’ beverage preference, drinking motives and alcohol use in adolescence. Alcohol Alcohol 2006;41:566–73. 8. Cox WM, Hosier SG, Crossley S, et al. Motives for drinking,
alcohol consumption, and alcohol-related problems among British secondary-school and university students. Addict Behav
2006;31:2147–57.
on September 22, 2020 by guest. Protected by copyright.
9. Goldstein AL, Flett GL. Personality, alcohol use, and drinking motives: a comparison of independent and combined internal drinking motives groups. Behav Modif 2009;33:182–98. 10. Engels RC, Wiers R, Lemmers L, et al. Drinking motives, alcohol
expectancies, self-efficacy, and drinking patterns. J Drug Educ
2005;35:147–66.
11. Tucker JA, Vuchinich RE, Sobell MB. Alcohol’s effects on human emotions: a review of the stimulation/depression hypothesis. Int J Addict 1982;17:155–80.
12. Heath DB. Some Generalizations about Alcohol and Culture. In: Heath DB, ed. International Handbook on Alcohol and Culture. Greenwood Press, Westport, CT, 1995:350–1.
13. Fairbairn CE, Sayette MA. The effect of alcohol on emotional inertia: a test of alcohol myopia. J Abnorm Psychol
2013;122:770–81.
14. Bushman BJ. Human Aggression While Under the Influence of Alcohol and Other Drugs: An Integrative Research Review. Curr Dir Psychol Sci 1993;2:148–51.
15. Wiers RW, Beckers L, Houben K, et al. A short fuse after alcohol: implicit power associations predict aggressiveness after alcohol consumption in young heavy drinkers with limited executive control.
Pharmacol Biochem Behav 2009;93:300–5.
16. Marmorstein NR. Longitudinal associations between alcohol problems and depressive symptoms: early adolescence through early adulthood. Alcohol Clin Exp Res 2009;33:49–59.
17. Mitchell JM, O'Neil JP, Janabi M, et al. Alcohol consumption induces endogenous opioid release in the human orbitofrontal cortex and nucleus accumbens. Sci Transl Med 2012;4:116ra6.
18. Global Drug Survey 2016. https://www. globaldrugsurvey. com/ (accessed 14 Nov 2016).
19. Winstock A, Lynskey M, Borschmann R, et al. Risk of emergency medical treatment following consumption of cannabis or synthetic
cannabinoids in a large global sample. J Psychopharmacol
2015;29:698–703.
20. Kaar SJ, Ferris J, Waldron J, et al. Up: The rise of nitrous oxide abuse. An international survey of contemporary nitrous oxide use.
J Psychopharmacol 2016;30:395–401.
21. Babor T, Higgins-Biddle J, Saunders J, et al. AUDIT. The alcohol use disorders identification test. Guidelines for use in primary care. 2nd edn. Geneva: World Health Organisation, 2001. http://www. talkingalcohol. com/ files/ pdfs/ WHO_ audit. pdf (accessed 15 Nov 2016).
22. Herz A. Endogenous opioid systems and alcohol addiction.
Psychopharmacology 1997;129:99–111.
23. King AC, Houle T, de Wit H, et al. Biphasic alcohol response differs in heavy versus light drinkers. Alcohol Clin Exp Res 2002;26:827–35. 24. Smart RG. Behavioral and social consequences related to
the consumption of different beverage types. J Stud Alcohol
1996;57:77–84.
25. World Health Organisation. Global status report on alcohol and health. 2011 http://www. who. int/ substance_ abuse/ publications/ global_ alcohol_ report/ msbgsruprofiles. pdf (accessed 09 Nov 2016). 26. Wyllie A, Zhang JF, Casswell S. Positive responses to televised beer
advertisements associated with drinking and problems reported by 18 to 29-year-olds. Addiction 1998;93:749–60.
27. Jones SC, Donovan RJ. Messages in alcohol advertising targeted to youth. Aust N Z J Public Health 2001;25:126–31.
28. Aas H, Klepp KI, Laberg JC, et al. Predicting adolescents' intentions to drink alcohol: outcome expectancies and self-efficacy. J Stud Alcohol 1995;56:293–9.
29. National Institute on Alcohol Abuse and Alcoholism. National Epidemiologic Survey on Alcohol and Related Conditions-III (NESARC-III) 2017 https:// niaaa. nih. gov/ research/ nesarc- iii (accessed 01 June 2017).
on September 22, 2020 by guest. Protected by copyright.