http://www.sciencepublishinggroup.com/j/ajpst doi: 10.11648/j.ajpst.20190501.13
ISSN: 2575-5978 (Print); ISSN: 2575-5986 (Online)
The Removal of Single and Binary Basic Dyes from
Synthetic Wastewater Using Bentonite Clay Adsorbent
Olaseni Segun Esan
*, Akeremale Olaniran Kolawole, Aboluwoye Christopher Olumuyiwa
Department of Chemical Sciences, Adekunle Ajasin University, Akungba-Akoko, Nigeria
Email address:
*Corresponding author
To cite this article:
Olaseni Segun Esan, Akeremale Olaniran Kolawole, Aboluwoye Christopher Olumuyiwa. The Removal of Single and Binary Basic Dyes from Synthetic Wastewater Using Bentonite Clay Adsorbent. American Journal of Polymer Science and Technology.
Vol. 5, No. 1, 2019, pp. 16-28. doi: 10.11648/j.ajpst.20190501.13
Received: September 25, 2018; Accepted: March 4, 2019; Published: March 21, 2019
Abstract:
In order to broaden the application of Bentonite clay, an easily obtainable and bio-available low cost adsorbent, it was employed for the decolourization of synthetic wastewater consisting of single and binary basic dyes (Malachite green and Rhodamine b). The adsorbent was used as obtained without any further modification and also characterized for its specific surface area, point of zero charge and its surface functional groups pre and post dyes sorption was determined using Fourier Transform Infrared Spectroscopy (FTIR). Batch adsorption methods were employed in order to study the effects of pH, Ionic strength and contact time in the single solute system. The parameters of sorption of Rhodamine B (RDB) and Malachite green (MG) were obtained and fitted to three isotherm models; Freundlich, Langmuir and Temkin. The Freundlich plot analysis indicated the process occurred via heterogeneous coverage of adsorbent by both dyes. The kinetics of adsorption data were analyzed using the; pseudo-first order, pseudo-second order, Intraparticle diffusion, film diffusion, and Boyd kinetic models. Over the study of these parameters, the film diffusion mechanism was found to predominate in the sorption process of the dyes. Competitive sorption studies were carried out by using both dyes as either the adsorbate of interest or as the interfering specie. The competitive co-coefficient values obtained from interfering MG in RDB removal were significantly lower than those obtained from interfering RDB in MG removal, indicating that the presence of RDB in the aqua matrix had antagonistic effect on MG adsorption by Bentonite.Keywords:
Freundlich, Langmuir, Temkin, Adsorption, Malachite Green, Bentonite1. Introduction
Years of increased industrial activities have resulted in the generation of large amount of wastewater containing a number of coloured toxic pollutants, which are polluting the available fresh water continuously. Having realized this basic fact that these coloured pollutants in aqueous systems adversely affect human and animal life, the control of pollution is now a high priority task. The availability of clean water for various activities is becoming the most challenging task for researchers and practitioners worldwide. Dye pollutants are a major source of environmental contamination and colour is the first contaminant that is recognized in wastewater [1]. These water-soluble dyes are recalcitrant, carcinogenic and offer considerable resistance to
biodegradation due to their complex structures and high thermal/photo-stability, hence there removal is paramount. Industries such as the textile industries, dye manufacturing industries, paper and pulp mills, tanneries, electroplating factories, distilleries, food companies, and a host of other industries generate and discharge this coloured wastewater [2]. The first synthetic dye was encountered in 1856 by William Perkin Henry in the accidental synthesis of Mauveine but presently over 100,000 dyes have been made and more than 7 x 10⁵ tonnes are produced annually [3]. More than 10,000 dyes are commercially available and about 5-10% of these are somehow discharged as wastewaters by these industries directly or indirectly into our water bodies [4].
physical/chemical method. Amongst the numerous techniques of dye removal, adsorption which is a physical/chemical method is the procedure of the choice and gives the best results as it can be used to remove different types of colouring materials [5-7]. The major advantage of an adsorption treatment over other methods is due to its cost-effectiveness and sludge free clean operation [8].
Over the past decade, Bentonite clay has been successfully employed for the adsorption of dye molecules and metal ions [9]. To date several conventional and non-conventional sorbents have been employed in the removal of these dyes from wastewaters while limited attention has been given to the fact that this wastewater usually contains more than one dye constituent, hence in the removal of one dye constituent the other may either possess an antagonistic or a non-interactive effect on the constituent of interest. This study particularly takes a case study of two different basic dyes (RDB and MG) in a binary system and examines the nature of the effect of one on the other. The effects of pH, Ionic strength and contact time were further evaluated and reported for each dyes in their single solute system.
2. Experimental
2.1. Materials
Bentonite applied in this investigation was obtained from Integrated Mineral Technology Holdings Ltd. (IMT) Australia. It was use without further purification. Malachite green and Rhodamine B were purchase from Sinopharm Chemical Reagent.
2.2. Methods
2.2.1. Characterization of Adsorbent
The pH zero point of charge (pHPZC) of the adsorbent was
determined via the solid addition method as described by Balistrieri and Murray [10]. This is used to determine the pH at which the surface of the sorbent exhibits total surface electrical neutrality. The Sear’s method [11] was employed in determining the surface area of the adsorbent as well, as surface area is one of the major factors the affects adsorption processes. The surface functional groups present on the adsorbent and their possible involvement in the sorption process was examined from the Fourier Transform Infrared spectrum (FTIR) of the Bentonite which was obtained from the Fourier Transform Infrared Spectrophotometer (Buck Scientific Infrared Spectrophotometer) between 400 – 4000 cm-1.
2.2.2. Adsorbate Quantification
Malachite green and Rhodamine B concentration in aqueous solution was quantified by the determination of the optical density at the characteristic wavelength using a double beam UV/visible spectrophotometer. A standard solution of the dye was taken and the optical density was determined at different wavelength to obtain a plot of optical density versus wavelength. The wavelength corresponding to
the maximum optical density ( max = 625nm and 543nm), as determined from this plot, was noted and the wavelength was used for the preparation of the calibration curve used in the present studies.
2.3. Single Solute System Adsorption Experiment
2.3.1. Determination of Equilibrium Isotherm and Kinetic Parameters
Batch adsorption experiment studies were carried out as described by Nidheesh et al [12]. 0.1g of the adsorbent with 50 ml of the dyes (RDB and MG) solutions for each of the desired initial dyes concentration of 2.5-30 mg/L in a 100 ml capped conical flask and the mixture was agitated on a temperature controlled magnetic stirrer at a constant speed of 1000rpm until equilibrium is attained. Samples were withdrawn after the equilibrium time (3hrs) and centrifuged at 4000rpm for 20min for complete separation of the Bentonite particles from the solution and the residual dye concentrations were calculated from the calibration curve. The kinetics of sorption of the dyes was studied by monitoring the uptake of the dyes from aqueous solution at different time intervals (1,3,5,10,20,30,60,90,120,180) in minute [13]. The amount of dye removed per unit mass of the adsorbent was calculated as;
0
( e)
e
c c
q v
m
−
= (1)
where Co(mg/L) is the initial concentration of the dye, Ce
(mg/L) equilibrium concentration, m is the mass of the adsorbent, and V is the volume of the solution. Percent dye removed (%DR) was calculated using the equation;
0
0
%DR c ce 100
c
−
= Χ
(2)
2.3.2. Influence of pH
The effect of pH was examined between pH 4 and pH 12. The different pH (4 to 12) of the aqueous solution was adjusted by the addition of either 0.1M HCl or 0.1M NaOH solution via drop wise method when necessary to the dye solutions before the introduction of the adsorbent. The adsorbent-adsorbate ratio was fixed at 0.1g to 50ml while the initial concentration was fixed at 30mg/L.
2.3.3. Influence of Ionic Strength
The dyes solution ionic strength effect was also examined by using NaCl solution of varying concentrations; 0%, 0.1%, 0.5% and 1% which is equivalent to ionic strengths of 0.0 Mol/L, 0.017 Mol/L, 0.085 Mol/L and 0.17 Mol/L. The adsorbent-adsorbate ratio was also fixed at 0.1g to 50ml while the initial concentration was fixed at 30 mg/L.
2.4. Bi-solute System Adsorption Experiment
2.5mg/L and 30mg/L for each of the adsorbate of interest. The concentrations of the adsorbates of interest were varied between 2.5-30mg/L while the interfering dyes molecule was kept constant at 30mg/L [14]. The competitive sorption equilibrium parameters were obtained by contacting 50ml solutions of known concentrations of the adsorbate of interest and interfering dye solution in a binary system. The mixture was agitated for 3hrs and samples withdrawn at the end of the sorption process, centrifuged and the supernatant concentrations of both the adsorbate of interfering solution were determined using the UV – Vis Spectrophotometer at there’re respective wavelengths.
2.5. Error Analysis
In order to examine the best fit of the different kinetic models to the observed experimental data, an error function is required in the optimization procedure. In the present study, the kinetic models were examined using the linear coefficient of determination, r2, and the non-linear chi-squared statistical method, χ2. The coefficient of determination r2, represents the percentage of variability in the dependent variables that has been explained by regression line [15].
The value of the coefficient of determination may vary from zero to one and was calculated with the aid of the equation;
2 2 xy
xx yy s r
s s
=
− (3)
Where is the sum of squares of x, is the sum of squares of y and is the sum of squares of x and y.
In order to evaluate the best of the kinetic models that fit the experimental data, the sorption process was also examined using nonlinear chi-squared (χ ) statistical test. The chi-squared statistical test is basically the sum of the squares of the difference between the experimental data and the theoretical data obtained by calculating from models, with each squared difference divided by the corresponding theoretical data obtained by calculating from models. The equivalence of the mathematical statement is;
.exp . 2
.
( e e theo)
e theo
q q
q
χ =Σ − (4)
if the data from model and experimental data are similar, then
χ value will be small and if they are different χ will be a large value.
3. Results and Discussion
3.1. Characterization of Adsorbent
The pH zero point of charge (pHZPC) is used to determine
the pH at which the surface of the adsorbent exhibits total
surface electrical neutrality. The functional groups present on the adsorbent surface may reside in the positive or negative charge state, depending on the pH of the system. A large relationship co-exists between the amount of adsorbate adsorbed to the surface of the sorbent and the pHZPC of the
adsorbent, which is that; adsorption of positively charged adsorbates will be favoured at pH values higher than the pHZPC when the surface of the adsorbent is predominantly
negatively charged while adsorption of negatively charged sorbent will be favoured at pH values lower than the pHZPC
when the surface of the adsorbent is predominantly positively charged [16]. In the determination of the surface charge of Bentonite used in this study, this showed that it possesses a pHZPC of 2.14 which was supported by literature to be
between 2.0 and 3.0 [17-18]. This signifies that the sorbent is suitable for the removal of basic dyes over a large pH range above 2.14. Its specific surface area was also determined to be 21.5(m2/g). A BET surface area of 20(m2/g) and 31.5(m2/g) was reported by Shu-li et (2009) and Xifang et al (2007) respectively. The difference in the surface area values reported could be ascribed to the method of determination, purity, method of preparation of sample and type of Bentonite. The FTIR spectra of the sorbent pre and post dyes uptake is illustrated in Figure 1. The FTIR spectra of Bentonite before adsorption of dyes showed absorption peak at 3456.80 cm-1 which is linked to the stretching vibration of H2O, the peak at 1649.60 cm-1 is linked or corresponds to the
bending of H2O, the peak at 1047.20 cm-1 corresponds to the
stretching of Si-O, the peak at 920.80 cm-1 denotes the bending vibration of Al-OH-Al. furthermore, FTIR peak at 620.00 cm-1 is associated with Al-O + Si-O out of plane vibrations while the peak at 537.00 cm-1 denotes Al-O-Si vibration bending. For the FTIR peaks of Malachite green and Rhodamine B, the peak at 1576 cm-1 and 1594 cm-1 respectively, indicates the presence of = . The peaks at 1467 cm-1 and 1178 cm-1 for MG, peaks at 1468.8 cm-1 and 1176.8 cm-1 for RDB denotes the vibration of the heterocyclic skeleton of the dye molecules. The peaks at 1178 cm-1 and 1176.8 cm-1 for MG and RDB respectively is assigned to CH3. It should be noted that the intensity of the peak at
Figure 1. FTIR spectra of Bentonite before and after dye adsorption.
3.2. Sorption Kinetics of MG and RDB unto Bentonite from Synthetic Wastewater
To investigate the adsorption process, monitoring of the adsorption kinetics is an important step. It was observed that equilibrium was reached at about 60mins and the amount of the dyes congregating unto the surface of the adsorbent was highly dependent upon initial concentration. The kinetic parameters of the adsorption of MG and RDB unto Bentonite were evaluated by employing the pseudo-first order and the pseudo-second order kinetic models.
3.2.1. Pseudo-First Order Kinetic Model
In cases where adsorption is preceded by diffusion through the boundary layer, the kinetics most have followed the pseudo-first order mechanism as described by Lagergren. [19-20]. The linearized form of the pseudo-first-order equation of Lagergren is generally expressed as:
1
ln(qe−qt)=lnqe−k t (5)
where qe and qt are the sorption capacity at equilibrium and at
time t respectively, (mg/g). k1 is the rate constant of
pseudo-first-order adsorption. The plot of In (qe - qt ) versus t should
give a linear relationship from which k1 and qe can be
deduced from the slope and intercept of the plot, respectively. The pseudo-first-order constants, k1, the correlation
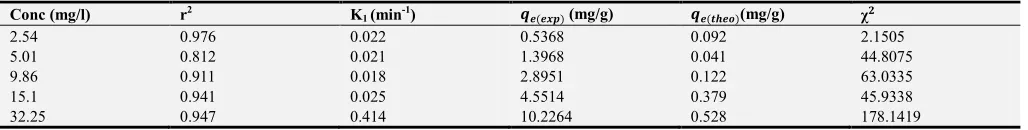
coefficients, r2, and the chi-square test statistic, χ2, were deduced from the plot of ln(qe−qt)versus time (t), and the respective values obtained are presented in Table 1 and 2. The correlation coefficients for the pseudo-first order plots for the adsorption of these dyes ranged between 0.812 to 0.976 for RDB (Table 1) while that of MG ranged between 0.871 to 0.994 (Table 2). The calculated qe values (qe.theo)
possess a large disparity from the experimental qe values
obtained for both dyes. For the applicability of this kinetic model towards the description of the mechanism of the sorption of these dyes unto Bentonite, the nonlinear chi- square test statistic was used to correlate the qe values
obtained from the theoretical prediction (qe.theo) and the actual
sorption process qe (qe,exp) (Tables 1 and 2). The results
presented in Tables 1 and 2 showed that the χ2, values were very high, which is an indication that the pseudo-first order model cannot be employed in the description of the adsorption process. Hence, the process does not follow the pseudo-first order adsorption rate expression of Lagergren.
Table 1. Rhodamine B pseudo-first order kinetic parameters.
Conc (mg/l) r2 K1 (min-1) (mg/g) (mg/g) χ
2.54 0.976 0.022 0.5368 0.092 2.1505
5.01 0.812 0.021 1.3968 0.041 44.8075
9.86 0.911 0.018 2.8951 0.122 63.0335
15.1 0.941 0.025 4.5514 0.379 45.9338
Table 2. Malachite Green pseudo-first order kinetic parameters.
Conc (mg/l) r2 K
1 (min-1) (mg/g) (mg/g) χ2
2.2 0.884 0.019 0.8022 0.266 1.080866
4.96 0.91 0.019 1.0902 0.576 0.459031
9.04 0.871 0.022 3.584 1.592 2.492503
15.11 0.994 0.023 6.4953 2.081 9.363789
31.43 0.884 0.021 11.4441 4.829 9.061824
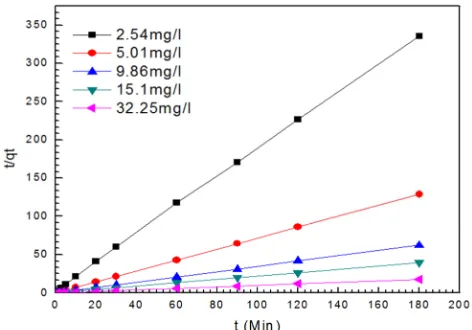
3.2.2. Pseudo-Second Order Kinetic Model
The pseudo-second-order kinetic model is represented by the linear equation;
2
2
1 1
e
t e
t
q t
q = k +q (6)
where qe, qt, and t have the same meaning as explained above
and Where k2 is the pseudo second order rate constant (gmg -1
min-1) which is determined from the intercept and qe from
the slope of the plot. The plot of t/qt should give a linear
relationship if the pseudo-second order kinetic model is applicable.
The initial sorption rate (h) can be obtained from the pseudo-second-order linear plots, as qt/t approaches zero:
2 e
h=kq (7)
the initial sorption rate, h, the pseudo-second order rate constant, k2, the amount of RDB and MG sorbed at
equilibrium, qe, the linear coefficient value, r 2
, and the chi-square test statistic function, χ , obtained are presented in Table 3 and 4. The values of h and qe increased with the
increase in the initial concentration of both dyes while the
adsorption rate constants decreased with increasing initial concentrations. The large values of the r2 and negligible χ values is a pointer to the fact that the mechanism of adsorption of the dyes follows the pseudo-second order. Muhammad et al [21-22] have also reported the mechanism of RDB and MG respectively to have concurred with the pseudo-second order mechanism.
Figure 2. Pseudo second Order Kinetic Plots of adsorption of Rhodamine B unto Bentonite.
Table 3. Rhodamine B pseudo-Second order kinetic parameters.
Conc (mg/l) r2 h (min-1) k
2(gmg-1min-1) ) χ
2.54 0.999 0.351 0.29 1.212 0.5368 0.563 1.20 x 10⁻³
5.01 1 6.306 1.956 3.224 1.3968 1.395 1.41 x 10⁻⁶
9.86 1 7.692 8.402 0.916 2.8951 2.892 3.32 x 10⁻⁶
15.1 1 7.353 20.85 0.353 4.5514 4.551 3.52 x 10⁻⁸
32.25 1 33.333 106.28 0.314 10.2264 10.292 4.18 x 10⁻⁴
Table 4. Malachite Green pseudo-Second order kinetic parameters.
Conc(mg/l) R2 h(min-1) qe2 k
2(gmg-1min-1) χ2
2.2 0.998 0.205 0.649 0.316 0.8022 0.789 2.21 x 10⁻⁴
4.96 0.996 0.13 1.243 0.104 1.0902 1.064 6.45 x 10⁻⁴
9.04 0.998 0.607 13.418 0.045 3.584 3.543 4.47 x 10⁻⁴
15.11 0.999 1.748 43.283 0.040 6.4953 6.444 4.08 x 10⁻⁴
31.43 0.998 2.179 135.208 0.016 11.4441 11.293 2.02 x 10⁻³
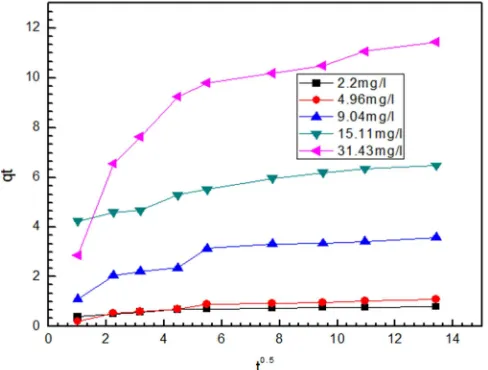
3.2.3. Intraparticle Diffusion Model
Based on the theory proposed by Weber and Moris [23], Intraparticle diffusion model which has been widely applied for adsorption studies was employed to investigate the adsorption mechanism of RDB and MG unto Bentonite. This model is mathematically expressed as;
0.5 t id
q =k t +c (8)
Where C (mg/g) is the intercept and Kid (mg/gmin 0.5
) is the intraparticle diffusion rate constant. The value of Kid was
obtained from the slope of the linear plot of qt vs t 0.5
for both dyes (Figure 4 and 5). The value of C which is given in Table 5 and 6 represent the boundary layer effect [24]. The significance of the deviation from this theory is the difference between the rate of mass transport between the initial and
final stages of adsorption (Panday and Singh, 1985) Furthermore, such deviation of straight lines from the origin indicates that the pore diffusion is not the sole rate-controlling step [25]. The results presented in Figure 4 and 5 show that two separate regions are found in the plot: the first straight portion of the plot is attributed to the macropore diffusion (surface sorption) and the second linear portion is attributed to micropore diffusion (intraparticle diffusion) [26]. In order to actualize the rate controlling step between these two distinct stages by determining the rate of intraparticle diffusion (Kid) which can be obtained from the slope of the intraparticle diffusion plots. Drawing a comparison between the Kid values of the two stages, it can be observed that the rate-limiting step is the macropore diffusion stage for the adsorption of both dyes (Table 5 and 6).
Figure 4. Intraparticle diffusion plot for the sorption of Rhodamine B on Bentonite
.
Table 5. Intraparticle diffusion parameters for the sorption of Rhodamine B unto Bentonite at different initial concentration (mg/l).
Initial linear portion Second portion
Initial Conc (mg/l) Kid1 (mg/gmin0.5)
C (mg/g) r2
Kid2 (mg/gmin0.5)
C r2
(Intercept) (Intercept)
2.54 0.025 0.399 0.999 0.007 0.456 0.946
5.01 0.060 1.235 0.907 0.002 1.369 0.971
9.86 0.045 2.673 0.991 0.009 2.781 0.926
15.10 0.054 3.996 0.943 0.021 4.290 0.944
32.25 0.103 9.374 0.983 0.027 9.912 0.840
Table 6. Intraparticle diffusion parameters for the sorption of malachite green unto Bentonite at different initial concentration (mg/l).
Initial linear portion Second portion
Initial Conc.(mg/l) Kid1 C r
2 K
id2 C r2
(mg/gmin0.5) (Intercept) (mg/gmin0.5) (Intercept)
2.2 0.089 0.301 0.999 0.013 0.624 0.986
4.96 0.181 0.065 0.894 0.038 0.607 0.834
9.04 0.53 0.649 0.906 0.107 2.277 0.68
15.11 0.21 4.065 0.932 0.137 4.808 0.943
31.43 2.25 0.897 0.949 0.235 8.353 0.973
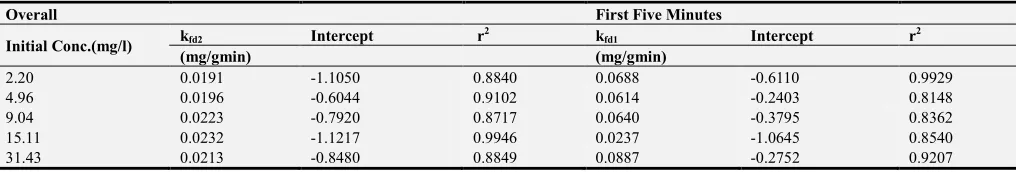
3.2.4. Liquid Film Diffusion Model
Sequel to the inability of the intraparticle diffusion model to adequately describe the sorption mechanism of RDB and MG by Bentonite, the adsorption dynamics was investigated utilizing the liquid film diffusion model. The possible migration of dye molecules from bulk solution to the exterior surface of the sorbent through the liquid film was investigated by utilizing the liquid film diffusion model (equation x) in order to determine the rate controlling step [27].
ln(1−F)= −k tfd
(9)
Where Kfd (min-1) is the liquid film diffusion rate constants
and F = t e q
q . A linear plot of ln(1−F) vs t, were tested for
both dyes (RDB and MG). From these plots, the overall sorption process yielded linear plots with coefficients of correlation (r2) ranging between 0.8121 to 0.9768 with intercepts between -1.7581 to -3.1278 for RDB and 0.8717 to 0.9946 with intercepts ranging between -0.2403 to -1.0645 for MG. The rate constant for the liquid film diffusion Kfd
was between 1.81 x 10⁻² – 2.27 x 10⁻¹ for RDB and between 6.14 x 10⁻² – 8.87 x10⁻² for MG. This is pointer of the fact that as these plots do not pass through the origin (i.e. intercepts less than zero for RDB and MG), the applicability of this model in describing the mechanism of the adsorption of these basic dyes by Bentonite is limited.
Table 7. liquid film diffusion parameters for the sorption of Rhodamine B unto Bentonite at different initial concentration (mg/l).
Overall First Five Minutes
Initial Conc.(mg/l) kfd2 Intercept r
2 k
fd1 Intercept r2
(mg/gmin) (mg/gmin)
2.54 0.227 -1.758 0.977 0.08 -1.484 0.994
5.01 0.021 -3.514 0.812 0.277 -2.403 0.888
9.86 0.018 -3.128 0.911 0.091 -2.712 0.976
15.1 0.025 -2.476 0.941 0.034 -2.176 0.891
32.25 0.031 -2.964 0.963 0.048 -2.569 0.997
Table 8. liquid film diffusion parameters for the sorption of Malachite green unto Bentonite at different initial concentration (mg/l).
Overall First Five Minutes
Initial Conc.(mg/l) kfd2 Intercept r
2 k
fd1 Intercept r2
(mg/gmin) (mg/gmin)
2.20 0.0191 -1.1050 0.8840 0.0688 -0.6110 0.9929
4.96 0.0196 -0.6044 0.9102 0.0614 -0.2403 0.8148
9.04 0.0223 -0.7920 0.8717 0.0640 -0.3795 0.8362
15.11 0.0232 -1.1217 0.9946 0.0237 -1.0645 0.8540
31.43 0.0213 -0.8480 0.8849 0.0887 -0.2752 0.9207
3.2.5. Boyd Kinetic Model
In order to actualize the rate controlling step involved in the sorption of RDB and MG unto the Bentonite, the kinetic data were further analyzed using the Boyd kinetic model according to the equation [27];
2 6
1 ( ) exp( t)
F B
π
= − − (10)
t q F
q∞
= (11)
Where qtis the amount adsorbed at time t, q∞represents the amount adsorbed at infinite time. (In this study is 180min). A linear form of the Boyd kinetics is written as:
0.4977 (1 )
t t e
B = − −In −q q (12)
Hence, the values of Bt can be estimated for each value of
F using equation 10. The calculated Bt values were plotted
against time (Figure 6 and 7), and the linearity test of the Bt
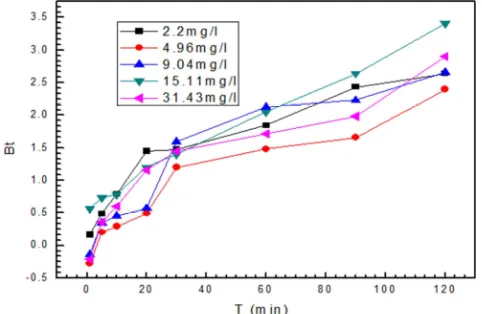
versus t plot for different initial RDB and MG concentrations was employed to differentiate between the particle diffusion and film diffusion-controlled adsorption process. If the Boyd plot is a straight line passing through the origin (zero intercept), the particle diffusion mechanism predominates. However, if the plots do not pass through the origin (i.e. intercept greater than zero), the film diffusion mechanism predominates. Figure 6 and Figure 7 shows that the Boyd plots for the removal of RDB and MG by Bentonite do not pass through the origin, indicating that the film diffusion mechanism predominates in the adsorption process
Figure 6. Boyd kinetic plots for the sorption of Rhodamine b unto Bentonite at different initial concentrations.
Figure 7. Boyd kinetics plots for the sorption of Rhodamine b unto Bentonite at different initial concentrations.
3.3. Adsorption Isotherms
Adsorption equilibrium isotherm is expressed by relating the amount of adsorbate sorbed per gram of sorbent, qe
(mg/g), to the equilibrium solution concentration, Ce (mg/L),
at a fixed environmental condition. In this present study, the Temkin, Langmuir and Freundlich isotherm models were employed in the description of the adsorption process and the isotherm parameters obtained using these models are presented in Table 9.
The linear form of Langmuir’s isotherm model is expressed as;
1
e e
e L m m
c c
q = k q +q (13)
Where qm the maximum value of adsorptive capacity
(mg/g), KL, is the Langmuir constant (L/mg) which is related
to the energy of adsorption are obtained from the intercept and slope of the plot respectively [28]. The constants qm and
KL were calculated from the slope and intercept of the linear
plot of Ce/qe versus Ce. From Table 9, the low correlation
coefficient values (r2) obtained for Langmuir isotherm model, 0.465 for RDB and 0.042 for MG is an indication that this isotherm model did not express the experimental data for both dyes, suggesting that the surface of Bentonite is heterogeneous and not homogeneous in nature. The essential characteristics of the Langmuir isotherm, used to predict the adsorption efficiency, was expressed in terms of a dimensionless equilibrium parameter RL, defined by
1 1
L
L O R
K C
=
+ , where Co (mg/l) is the highest
concentration of adsorbate. The value of RL indicates if
Langmuir isotherm is unfavorable (RL > 1), linear (RL = 1),
favorable (0< RL >1) or irreversible (RL = 0). The values of
RL at Co = 30mg/l in the present study were found to be
1.6058 x 10⁻³ for RDB and 0.718 for malachite green at 298.15k, indicating that the adsorption of these basic dyes unto Bentonite is favorable.
The Freundlich adsorption isotherm is the first mathematical fit to an isotherm published [29]. It is a purely empirical isotherm which describes the adsorption onto a heterogeneous surface with the linear equation;
1 lnqe lnkf lnce
n
= + (14)
Where qe is the adsorptive capacity which is the quantity
of the material adsorbed per unit gram of the adsorbent (mg/g), Ce is the equilibrium adsorbate concentration (mg/L); Kf, the Freundlich isotherm constant related to adsorption capacity (indicating the quantity of dye adsorbed onto the adsorbent) and n, the Freundlich isotherm constant related to adsorption intensity (which indicates the favorability of the adsorption process) can be obtained from the intercept and slope of the plot respectively [29-30]. Therefore, the plot of Inqe versus InCe gives a straight line of slope 1/n and
the Freundlich isotherm provides a very good fit to the experimental data possessing r2 of 0.980 for RDB and 0.905 for MG suggesting that the sorption of the dyes occurred via heterogeneous coverage of the surface of the adsorbent. The values of KF which denotes the sorption capacities of the
adsorbent towards the dyes was found to be 0.386mg/g for RDB and 0.8055mg/g for MG. RDB and MG adsorption onto Bentonite clay is considered to be unfavorable because the Freundlich exponent values of n (which determines the intensity and feasibility of the adsorption process) were less than 1 (0.73 for RDB and 0.98 for MG). Generally, the value of 1/n less than 1 and the value of n in the range of 2–10 indicates that the adsorption process is favorable, 1–2 moderately difficult and below 1 poor adsorption characteristics [31].
The Temkin isotherm is based on the assumption that the free energy of adsorption is dependent on the surface coverage and takes into account the interactions between
adsorbents and dye molecules. The linear form of the Temkin isotherm model equation [32] is expressed as.,
ln ln
= +
e T e
t RT
q B A c
b (15)
Where: AT is the equilibrium binding constant [L/g], bt is
the adsorption constant [J/mol K], R is the universal gas constant (8.314 J/mol K), T is absolute temperature value [298K], B is a constant related to the heat of sorption [J/mol]. The Temkin isotherm model display a correlation coefficient values of 0.899 for RDB and 0.754 for MG which are lower than those observed from the Freundlich isotherm model as shown in Table 9. Therefore, the Temkin isotherm model do not describe the mechanism of sorption of these dyes unto Bentonite.
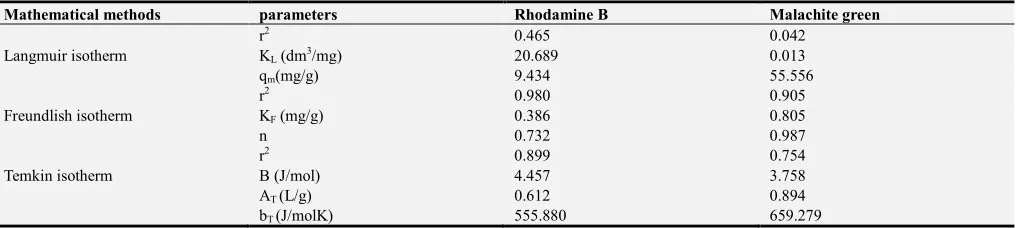
Table 9. Results of Isotherm analysis.
Mathematical methods parameters Rhodamine B Malachite green
r2 0.465 0.042
Langmuir isotherm KL (dm3/mg) 20.689 0.013
qm(mg/g) 9.434 55.556
r2 0.980 0.905
Freundlish isotherm KF (mg/g) 0.386 0.805
n 0.732 0.987
r2 0.899 0.754
Temkin isotherm B (J/mol) 4.457 3.758
AT (L/g) 0.612 0.894
bT (J/molK) 555.880 659.279
3.4. Effect of pH
Figure 8. Percentage removal of Rhodamine B and Malachite Green unto Bentonite at different initial pH values and a constant concentration of 30 mg/L for each
It must be emphasized that pH is one of the most important variables to be considered in adsorption studies. The pH of the aqueous medium alters the net charge present on the surface of the adsorbent, the ionization degree of the adsorbate molecules and the dissociation extent of the functional groups present on the adsorbent [33]. The variations in the total percentage of the dyes removed at
different pH and initial concentration of 30mg/l for RDB and MG are shown in Figure 8. For these dyes, the maximum percentage removal was attained at pH 4 (in excess of 70% for RDB, and excess of 90% for MG). The trend in the plot also shows that the percentage removal peaked at pH 4 and maintained a steady decline until pH 12. This variation in behavior of the adsorption can be explained on the basis of point of zero charge of the adsorbent (pHZPC = 2.14) as well
as the structures of the dyes. At pH below the point of Zero charge of the adsorbent (2.14) the surface of the sorbent has a high positive charge density and under this condition the uptake of positively charged dyes would be low. With increasing pH i.e. beyond the point of zero charge, negative charge density on the surface of the adsorbent increases, resulting in an enhancement in the removal of these positively charged dyes. Also as a result of the acidic groups on these dyes that dissociates with increasing pH, giving rise to negative charge on the dyes which accounts for the reduction in the percentage removed in these dyes at higher pH.
3.5. Effect of Ionic Strength
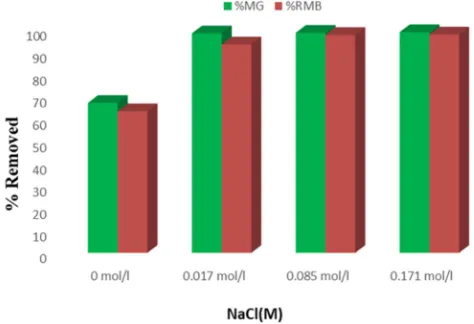
adsorbents. This effect is of high importance in order to verify the existence of the hydrophobic – hydrophobic interactions which is the attraction between the nonpolar groups of the dye and the adsorbent [21]. From the result of the effect of ionic strength on these cationic dyes presented in Figure 9, it can be observed that an increase in ionic strength (0 - 0.17 mol/L) of the solution led to an increase in the total percentage of the dyes that were removed as compared to the solution without the salt (NaCl). This justified the fact that hydrophobic – hydrophobic and coulombic interactions may be the dominant attraction force for the RDB and MG- Bentonite adsorption system. A similar case of this type of interaction was reported by Mohammad et el., [21]. This is because in solution of high ionic strength, the electrostatic attraction mechanism is suppressed due to the competition between the cationic dyes molecules with the Na+ present for the active sites on the adsorbent surface, leading to reduction in electrostatic attraction between the dyes and the adsorbent surface. High ionic strength also enhances hydrophobic – hydrophobic interactions by compression of the electrical double layer that moves particles much closer together which leads to increase in dye adsorption as observed in Figure 9. Hu et al. [34] also reported a similar observation for the sorption of methyl orange, methylene blue and neutral red. It has been reported that ionic strength greatly influences particle aggregation by altering electrostatic interactions between adsorbates and sorbents. An increase in ionic strength of a solution has been described to suppress electrostatic repulsion thereby promoting particle aggregation [35-36].
Figure 9. Effect of salt on the adsorption of Rhodamine B and Malachite Green unto Bentonite at the Initial dye concentration of 30 mg/l.
4. Competitive Sorption in Synthetic
Wastewater
Following the conformation of the isotherm equilibrium data (i.e RDB and MG removal by Bentonite) in single solute system to the Freundlich equilibrium isotherm model, the extended Freundlich multicomponent adsorption isotherm proposed by Sheindorf et al, [14], (i.e. the Sheindorf-Rebuhn-Sheintuch (SRS) equation) was employed in the
determination of the extent of competitive effects of MG on RDB removal by Bentonite on one hand, and the extent of competitive effect of RDB on MG removal by Bentonite on the other hand.
The assumptions in the derivation of the SRS equation incorporated states that each component must individually obey the Freundlich isotherm and an exponential distribution of site adsorption energies must exist.
The general form of the SRS equation can be expressed as;
1 1
( ) −
=
∑
nI I I IJ J
q K C a C (16)
Where, is the adsorption of component, I, per gram weight of adsorbate (mg/g); CI and CJ are the concentrations
of I and J in the equilibrium solution (mg/L); KI and nI are
the Freundlich constants obtained for, I, in a single-component system; and aIJ is the competition coefficient for
the adsorption of component, I, in the presence of component, J. Sheindorf et al. [14] successfully applied this model to the competitive equilibrium adsorption of p-nitrophenol and benzene sulphonate onto activated carbon. For the bicomponent system study in this case, the sorption of each component is given by the following equation;
4.1. RDB/MG System
1 1
( ) −
= + n
R R R R RM M
q K C C a C (17)
Where RDB is the adsorbate of interest and MG is the interfering ionic species.
4.2. MG/RDB System
1 1
( )n
R M M MR R M
q =K C a C +C − (18)
Where MG is the adsorbate of interest and `RDB is the interfering ionic species.
The linear form of the bicomponent isotherm equation can be written for RDB/MG system as;
R R
RM
M M
C
a
C C
β
= − (19)
and as MG/RDB system as
M M
MR
R R
C
a
C C
β
= − (20)
Where 1 2
1 1
1 n 1 n
R R M M
R M
R M
K C K C
and
qe qe
β = − β = −
As expressed above, the competition coefficients were determined from the intercept of a straight-line plot of CR
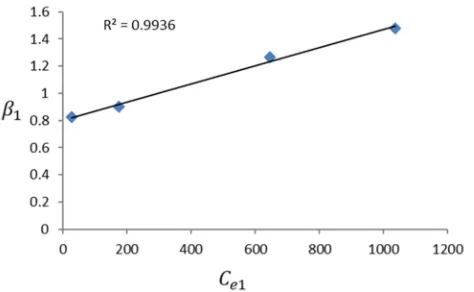
Figure 10. Experimental results presented in the linear form of the multicomponent adsorption isotherm: Rhodamine B in the presence of Malachite Green at constant concentration system
.
Figure 10 shows the extended Freundlich plot for Rhodamine B-Malachite Green system. The correlation coefficient was found to be 0.993 which shows a very good linearity of the plot and indicates the applicability of the extended Freundlich equation to describe the competitive adsorption behavior of the binary mixture. The values of the competition coefficients were determined from the intercept of the above plot (Figure 10). However, it should be noted that since by definition = 1 ⁄ (i.e. = 1 as described by Sheindorf et al, 1981 ), only one of
the coefficients is required [14]. The competitive coefficients of RDB in the presence MG (aRM ) and the competitive coefficients of Malachite Green in the presence of RDB
(
aMR) from 2.5m/l to 30mg/l is presented in Table 10 below.Table 10. Summary of competitive coefficients values for the binary-solute system of Rhodamine b and malachite green in synthetic wastewater system.
Conc (mg/L) 123 132
2.9 0.2509 3.9851
5.49 0.3077 3.2498
11.71 0.3178 3.1467
15.96 0.3059 3.2686
39.57 0.2946 3.3943
Deb et al. [37] proposed that the value for the competitive coefficient range from zero (complete lack of competition) to greater than zero (normally less than 10) for a high degree of competition. An overview of the values of the competitive coefficients obtained showed that the values of the (Table 10) were far lower than that of the in the synthetic wastewater system. The values of the ranged between 0.251 and 0.318 while that of the ranged between 3.15 and 3.99. These showed that the competitive effects of MG in RDB sorption by Bentonite were insignificant, since the values of the competition coefficient were below unity [38]. The values of the competitive coefficient of RDB in MG sorption by Bentonite were very high (Table 10). The values observed for the competitive coefficients of both MG and RDB, as interfering ionic specie, in their respective systems, signifies that the presence of RDB in the aqua matrix had antagonistic effects on the
sorption of MG by the sorbent while the presence of MG had non-interactive effects on the sorption of RDB by Bentonite [39].
5. Conclusions
This study evaluated the use of a readily bio-available and inexpensive Bentonite as a low-cost adsorbent for the removal of basic dyes in single and binary system. The FTIR characterization revealed the presence of silanol and aluminol groups on the surface of the Bentonite which was responsible for the sorption of these basic dyes. The sorbent was found to possess a high adsorption potential for MG than RDB which is possibly due t the presence of the acidic group –COOH- on the RDB which MG do not possess. The – COOH- groups stimulates an electrostatic repulsion between RDB and Bentonite. The sorption of both dyes was found to be highly dependent on various environmental conditions such as; pH, Ionic strength, contact time and initial dye concentrations. The equilibrium data analysis revealed heterogeneous nature of the Bentonite which was confirmed by the fitting of the experimental data to the Freundlich isotherm model. The extremely high values of R2 and the predicted values of the equilibrium sorption capacity qe
which was very much in agreement with experimental data for all initial RDB and MG concentrations confirms that the sorption process follows a pseudo-second-order mechanism. The competitive effects of the presence of MG in the sorption of RDB by Bentonite were insignificant (less than unity), thus, it could be concluded that Malachite Green has non-interactive effect in the sorption of Rhodamine B by Bentonite. Whereas the competitive effect of the presence of RDB in the sorption of MG were very high (greater than unity), thus it could be concluded that RDB is antagonistic in the sorption of MG by Bentonite.
References
[1] Banat IM, Nigam P, Mc Mullan G, Marchant R, Singh D (1996). Microbial decolourization of textile dye containing effluents. Bioresource Technology 58, 217-227.
[2] McKay, G; Porter, J. F; Prasad, G. R. (1999). The removal of dye colours from aqueous solutions by adsorption on low-cost materials, Water, Air, Soil Pollution. 114, 423–438.
[3] McMullan, G.; Meehan, C.; Conneely, A.; Nirby, N.; Robinson, P.; Nigam, I.; Bannat, M. and Marchant, S. W. F. (2001). Mini-review: Microbial decolorization and degradation of textile dyes. Appl. Microbiol. Biotechnol., 56, 81 – 87.
[4] Goldberg, S. (2005). Equations and Models describing Adsorption Processes in Soils. Chemical Processes in Soils, Soil Science Society of America (SSSA). SSSA, Wisconsin. p 489. [5] Derbyshire, F., Jagtoyen, M., Andrew, R., Rao, A.,
[6] Ho YS, Mckay G (2003). Sorption of dyes and copper ions onto biosorbents, Proc. Biochem. 38: 1047-1061.
[7] Jain, A. K., Gupta, V. K., Bhatnagar, A. S. (2003) Utilization of industrial waste products as adsorbents for the removal of dyes. J. Hazard. Mater., B, 101, 31-42.
[8] Gupta, V. K.; Suhas. (2009). Application of low-cost adsorbents for dye removal—A review. J. Environ. Manag. 2009, 90, 2313–2342.
[9] Tahir, H.; Hammed, U.; Sultan, M.; Jahanzeb, Q. (2010). Batch adsorption technique for the removal of malachite green and fast green dyes by using montmorillonite clay as adsorbent. Afr. J. Biotechnol, 9, 8206–8214.
[10] Balistrieri, L. S. and Muray, J. W. (1981). The surface chemistry of Geothile (αFeooH) in major ion sea water. American Journal of Science, 281, 788-806.
[11] Sears G. W (1956) Determination of Specific Surface Area of Colloidal Silica by Titration with Sodium Hydroxide Anal. Chem. 28, 1981–1983.
[12] Nidheesh, P. V., Gandhimathi, R., Ramesh, S. T. and Singh, T. S. A. (2012). Adsorption and Desorption Characteristics of Crystal Violet in Bottom Ash Column. Journal of Urban and Environmental Engineering, 6(1): 18-29.
[13] Olaseni S. E., Oladoja N. A., Owoyomi O., Aboluwoye C. O., and Osundiya M. O (2014). Adsorption of Brilliant Green onto Luffa Cylindrical Sponge: Equilibrium, Kinetics, and Thermodynamic Studies. ISRN Physical Chemistry.
[14] Sheindorf, Ch. Rebhun, M. and Sheintuch, M., (1981) . A Freundlich-type multicomponent isotherm, J. Colloid and Interface Sci., 79, 136-142.
[15] Oladoja N. A., Akinlabi A. K., (2009). Congo Red Biosorption on palm kernel seed coat. Industrial and Engineering Chemistry Research, 48, 6188-6196.
[16] Nomanbhay MS, Palanisamy K. (2005) Removal of heavy metal from industrial waste using chitosan coated oil palm shell charcoal. Elect. J. Biotechnol, 8, 43-53.
[17] Hashen F. S. (2012) Adsorption of Methylene Blue from aqueous solutions using Fe3O4/Bentonite nanocomposite. Hydrol Current Res 3: 143- 148.
[18] Akpomie K. G, Dawodu F. A (2015) Potential of a low-cost bentonite for heavy metal abstraction from binary component system. Beni-suef university journal of basic and applied sciences 4, 1 -13.
[19] Lanregren, S. (1889) “About the theory of so-called adsorption of soluble substances,” Kungliga Svenska Vetenskapsakademiens Handlingar, 24, 1–39,
[20] Ho, Y. S. (2004). Citation Review of Lagergren kinetic rate equation on adsorption reactions. Scientometrics 59, 171–177. [21] Muhammad K. D., Linda B. L. (2016). The removal of
Rhodamine B dye from aqueous solution using Casuarina Equisefolia Needles (CEN) as adsorbent. Journal Cogent Environmental Science 2, 1-14.
[22] Muhammad K. D., Linda B. L. Lim. (2015). Application of Casuarina Equisefolia Needles (CEN) for the removal of methylene blue and malachite green dyes from aqueous solution. Alexandria Engineering Journal 54, 2015, 1253-1263.
[23] Weber Jr., W. J., Morris, J. C. and Sanit, J. (1963) Kinetics of Adsorption on Carbon from Solution. Journal of the Sanitary Engineering Division, American Society of Civil Engineers, 89, 31-38.
[24] Kannan N. and Sundaram M. M (2001). Kinetics and mechanism of removal of methylene blue by adsorption on various carbons—a comparative study, Dyes and Pigments, 51, 25–40.
[25] Poots, V. J. P.; McKay, G.; Healy, J. J. (1978) Removal of basic dye from effluent using wood as an adsorbent. J. Water Pollut. Control Fed. 50, 926–939.
[26] Lakshmi, U. R., Srivastava, V. C, Mall, I. D, Lataye, D. H. (2009) Rice husk ash as an effective adsorbent: evaluation of adsorptive characteristics for indigo carmine dye, Journal of Environmental Management, 90, 710–720.
[27] Boyd G. E., Adamson A. W., Myers Jr L. S (1947). The exchange adsorption of ions from aqueous solutions by organic zeolites. II. Kinetics J Am Chem Soc, 69, 2836–2848. [28] Alshabanat, M. Alsenani, G. and Almufarij, R. (2013).
Removal of Crystal Violet Dye from Aqueous Solutions onto Date Palm Fiber by Adsorption Technique. Journal of Chemistry, Volume 2013, Article ID 210239, 1-6.
[29] Freundlich, H. (1906). Ueber die Adsorption in Loesungen. Zeitschrift Fur Physikalische Chemie-Stochiometrie Und Verwandtschaftslehre, 57, 385-470.
[30] Runping, H., Pan, H., Zhaohui, C., Zhenhui, Z., and Mingsheng, T. (2008). Kinetics and isotherms of Neutral Red adsorption on peanut husk. Journal of Environmental Sciences, 20: 1035–1041.
[31] Rahman M. A., Ruhul A. S. M. & Shafiqul A. A. M. (2012). Removal of Methylene Blue from Waste Water using Activated Carbon prepared fromRice Husk. Dhaka University Journal of Science, 60, 185-189.
[32] [32]Temkin, M. and Pyzhev, V. (1940) Kinetics of Ammonia Synthesis on Promoted Iron Catalysts. Acta Physicochimica URSS, 12, 217-222.
[33] Nandi B. K., Goswami A. Purkait M. K (2009) Adsorption characteristics of brilliant green dye on kaolin, Journal of Hazardous Materials, 161, 387–395.
[34] Hu, Y., Gou, T., Ye, X., Li, Q., Gou, M., Liu, H., and Wu, Z. (2013). Dye adsorption by resins: effect of ionic strength on hydrophobic and electrostatic interaction. Chemical Engineering Journal, 228, 392-397
[35] Mercer K. L, Tobiason J. E. (2008). Removal of arsenic from high ionic strength solutions: effects of ionic strength, pH, and preformed versus in situ formed HFO, Environ. Sci. Technol. 42, 3797–3802.
[36] Piret F. Su B.-L. (2008) Effects of pH and ionic strength on the self-assembly of silica colloids to opaline photonic structures, Chem. Phys. Lett. 457, 376–380.
[37] Deb D. L, Datta N. P (1967). Effect of associating anions on phosphorus retention in soil, Plant Soil. 26, 303–316.