ISSN 0976-5727 (Print) ISSN 2319-8133 (Online
Journal of Pure Applied and Industrial Physics, Vol. 5(2), 33-46, February 2015
(An International Research Journal), www.physics-journal.org
February, 2015 | Journal of Pure Applied and Industrial Physics | www.physics-journal.org
Specific Effect of Current Density Distribution on Structural
and Optical Properties by FESEM and XRD Studies
S. R. Rajkumar1, M. Alagar2, S. Somasekaran3 and S. R. Ravisankar4
1
Assistant Professor, Department of Physics, Rajapalayam Rajus’ College,
Madurai Kamaraj University, Rajapalayam,Tamil Nadu, INDIA. [email protected]
2
Head & Associate Professor,
DST – Fist Sponsored Center for Research and Post Graduate Department of Physics, Ayya Nadar Janaki Ammal College (Autonomous), Madurai Kamaraj University,
Sivakasi, Tamil Nadu, INDIA.
3
Head & Associate Professor,
Department of Physics, Rajapalayam Rajus’ College, Madurai Kamaraj University, Rajapalayam, Tamil Nadu, INDIA.
4
Scientific Officer, Production Section,
Department of Atomic Energy (Govt. of India), Heavy Water Plant, Tuticorin, Tamil Nadu, INDIA.
(Received on: January 29, 2015)
ABSTRACT
use of surfactants was studied on the morphology and electrochemical properties of the electrochemical cell.
Keywords: Nanocrystalline zinc, Bipolar zinc electrodes, saturated calomel
electrode , Electrodeposition, current density.
1. INTRODUCTION
Zinc electrodes are prepared by variety of methods1-7 like paper making technology,
electrodeposition, pasted zinc electrodes, thick film printed zinc electrodes and pressed plate electrodes etc. Among these deposited zinc electrodes gives higher current densities due to elimination of the binder during electrode manufacturing process. Various deposition methods employed for the synthesis of zinc powder include physical vapour deposition, chemical vapour deposition, zinc oxide deposition/ reduction and Electrodeposition. Electrodeposition method is mostly preferred as it achieves better control over morphology, porosity and surface area of the electrode.
Zinc is environmentally safer than other anode materials besides having high rate
discharge performance8 . This superiority makes zinc silver oxide system the top choice for
applications where volume and weight are critical and high power output is required, such as the high power density pulse batteries. In spite of the introduction of new battery systems such as lithium ion and metal hydride systems, zinc silver oxide is still the best in terms of power density. These high power batteries require thin electrodes which cannot be
manufactures by conventional pressing or pasting methods9-12.
Zinc is widely used as anode material in primary and secondary batteries like Zinc-MnO2 , Zinc-AgO , Ni-Zn , Zn-HgO , Zn-air etc due to relatively high electrode potential and low equivalent weight. Both acidic and alkaline baths have been used for the Electrodeposition of zinc but alkaline baths are preferred due to better control over the
deposition distribution. Presence13 of fine zinc particles in the powder greatly improves the
performance of the zinc electrodes.
Electrodeposited electrodes present various inherent problems like dendrite
formation, large particle size and low surface area. Electrosynthesis methods are preferred as they are cheap and have better control due to variations in temperature, solution concentrations and current density etc. Different additives like rare earth metals, tartaric acid, polyalcohols and surfactants were added to the deposition bath to improve the morphology of the deposited powders. Large particles and low surface area is not suitable for high power batteries.
In this study ,the thin electrodeposited electrodes have been assembled into high
power bipolar zinc batteries. Current densities up to 50Adm-2 have been obtained. we have
S. R. Rajkumar
February, 2015 | Journal of Pure Applied and Industrial Physics
2. EXPERIMENTAL
Thin Zinc was electrodeposited from additive
standard AR grade (Merck India) laboratory chemicals. Prior to deposition, the substrate was first mechanically polished, then washed in 10% H
were fabricated14 by electrodeposition from Sulphate bath using a conventional three
electrode cell. Cathode current density was varied by DC regulated power supply (Aplab L3230 model, India make). The reference electrode was a saturated calomel electrode (SCE). The whole process was carried out at room
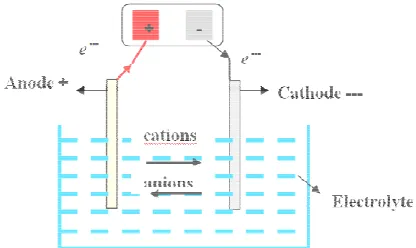
passed through the electrolytic circuit, calibrated digital multimeters of MECO were used. This electrodeposition assembly is presented in
Fig. 1.
Electrodeposition studies were done b
electrolytic grade with 99.99 % purity. Under galvanostatic electrodeposition studies cathode used was mild steel and these cathodic specimens were pre treated through the following sequence before
zinc and copper anodes of electrolytic grade with 99.99 %. The anode to cathode area was maintained as 1:1 ratio throughout the
(99.99% purity, E-Merck) was dis
stirred whenever necessary by using a stirrer at a constant speed to enhance the convection of the solution for efficient mass transfer.
maintaining a constant bath temperature, water bath was used and the temperature was
measured by using 110oC mercury thermometer. Bath pH was measured or adjusted by
means of calibrated digital pH electrodes. The solution w
undissolved ZnO. Zinc sulphate hepta hydrate (E Disodium salt of ethylene diamine tetra acetic acid (EDTA Merck) and sodium chloride
plate sheet (>99.9%) of cross
S. R. Rajkumar, et al., J. Pure Appl. & Ind. Phys. Vol.5 (2), 33-46
Journal of Pure Applied and Industrial Physics | www.physics-journal.org
Zinc was electrodeposited from additive-free, aqueous solutions composed of standard AR grade (Merck India) laboratory chemicals. Prior to deposition, the substrate was
hanically polished, then washed in 10% H2SO4 and distilled water. Thin zinc films
by electrodeposition from Sulphate bath using a conventional three electrode cell. Cathode current density was varied by DC regulated power supply (Aplab 3230 model, India make). The reference electrode was a saturated calomel electrode (SCE). The whole process was carried out at room temperature. For measuring volts and current passed through the electrolytic circuit, calibrated digital multimeters of MECO
were used. This electrodeposition assembly is presented in following figures.
Electrochemical cell model for Zinc electrodeposition
Electrodeposition studies were done by using soluble zinc and copper anodes of electrolytic grade with 99.99 % purity. Under galvanostatic electrodeposition studies cathode used was mild steel and these cathodic specimens were pre treated through the following sequence before deposition. Electrodeposition studies were done by using soluble zinc and copper anodes of electrolytic grade with 99.99 %. The anode to cathode area was maintained as 1:1 ratio throughout the studies. Required amount of Zinc oxide
Merck) was dissolved in KOH (E-Merck) solution. Bath solution was stirred whenever necessary by using a stirrer at a constant speed to enhance the convection of the solution for efficient mass transfer. With the help of gentle heating (75~ 80 °C).
tant bath temperature, water bath was used and the temperature was C mercury thermometer. Bath pH was measured or adjusted by means of calibrated digital pH meter (Systronics, India make) along with combined solution was cooled to room temperature and filtered to remove any undissolved ZnO. Zinc sulphate hepta hydrate (E-Merck), Copper sulphate (
salt of ethylene diamine tetra acetic acid (EDTA, E-Merck), trichloroethylene ( sodium chloride (sd fine) AnalaR grade chemical were used as surfactants. Zn plate sheet (>99.9%) of cross-sectional area (5.0 cm × 2.5 cm) of the anode was used with
46 (2015) 35
journal.org
free, aqueous solutions composed of standard AR grade (Merck India) laboratory chemicals. Prior to deposition, the substrate was and distilled water. Thin zinc films by electrodeposition from Sulphate bath using a conventional three electrode cell. Cathode current density was varied by DC regulated power supply (Aplab 3230 model, India make). The reference electrode was a saturated calomel electrode (SCE). measuring volts and current passed through the electrolytic circuit, calibrated digital multimeters of MECO ,India make
following figures.
y using soluble zinc and copper anodes of
electrolytic grade with 99.99 % purity. Under galvanostatic electrodeposition studies15
cathode used was mild steel and these cathodic specimens were pre treated through the studies were done by using soluble zinc and copper anodes of electrolytic grade with 99.99 %. The anode to cathode area was amount of Zinc oxide - ZnO Merck) solution. Bath solution was stirred whenever necessary by using a stirrer at a constant speed to enhance the convection of With the help of gentle heating (75~ 80 °C). For tant bath temperature, water bath was used and the temperature was C mercury thermometer. Bath pH was measured or adjusted by Systronics, India make) along with combined as cooled to room temperature and filtered to remove any sulphate (E-Merck), , trichloroethylene (E-(sd fine) AnalaR grade chemical were used as surfactants. Zn
copper plate (0.05mm thickness and 75cm2 area) as substrate for the deposition. The anode to cathode area was maintained as 1:1 ratio throughout the studies. Thus only one side of the electrode was deposited with zinc and the other side used as current collector in bipolar cell assembly. Various bath compositions are shown in Table.1.
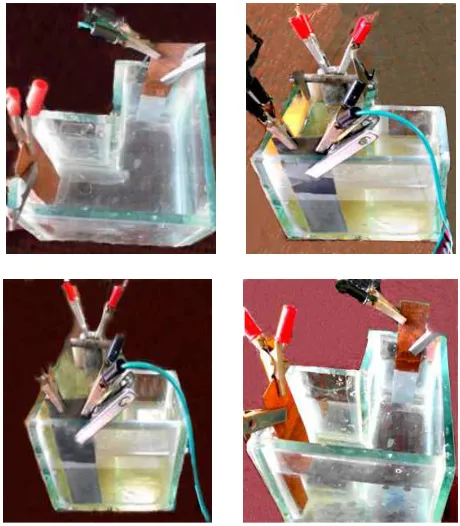
Fig .2. Views of Experimental Electrochemical Cell setup
Table 1. Various compositions of Baths
Bath ID
KOH (Molar)
ZnO (g/Lit)
Bath temperature (°C)
Deposition Time (minutes)
Current Density (Adm-2)
Surfactant Distance (cm)
Zn-SRR1 6 20 35~40 30 20 --- 23.5
Zn-SRR2 4 20 35~40 15 20 --- 22.5
Zn-SRR3 6 20 35~40 15 25 --- 23.5
Zn-SRR4 6 20 38~60 15 20 --- 23.5
Zn-SRR5 6 15 35~40 15 15 --- 22.5
Zn-SRR6 8 20 35~40 15 30 --- 23.5
Zn-SRR7 6 20 35~40 20 20 --- 25.0
Zn-SRR8 6 20 35~40 15 35 --- 24.5
Zn-SRR9 6 20 35~40 15 40 --- 23.5
S. R. Rajkumar, et al., J. Pure Appl. & Ind. Phys. Vol.5 (2), 33-46 (2015) 37
February, 2015 | Journal of Pure Applied and Industrial Physics | www.physics-journal.org
2.1. Calculation of the time of deposition by Faraday’s law
Cathodic Electrodeposition was carried out as function of current densities was measured at every 30 seconds at a given Cathodic current density with reference to saturated
calomel electrode (SCE) 16 through a Luggin probe assembly at 25 °C and 35 °C for 15 to 25
minutes to allow deposition of ~ 5g zinc powder. The time of deposition was calculated with the help of Faraday’s law as follows;
݉ ൌ
ொி
ൈ
ெ
(1)
where;
݉ െ = mass of zinc deposited ܳ െ total electric charged involved in deposition
ܨ െ Faraday’s constant (F= 96485 coulombs) ܯ െ Molar mass of zinc (65.38)
ܼ െ It is the electron transferred/ion (2 in case of Zn+2)
ܳ െcan be calculated from the formula;
ܳ ൌ ܫݐ
(2)Where; ܫ െ Current in Amperes ݐ െTime of deposition in seconds
2.2. Characterization of the Electrochemical deposits
Electrodeposited zinc were washed with deionized water to final thickness of 0.40µm and dried under vacuum. The Electrochemical deposits were characterized with the help of XRD, FESEM surface area, bulk density followed by discharging at various loads (current density). Electrochemical cell assembly was made by taking the deposited electrode
as area 0.25 cm2(Tokai Carbon Company, Japan make)was used as the working electrode
and silver electrode of 2.5 cm × 2.5 cm surface area was used as the counter electrode and saturated calomel electrode(SCE) was used as the reference electrode as counter electrode. To eliminate the interference of oxygen, bath was purged by passing pure nitrogen for one hour. Each of these different sets of these studies were conducted in order to obtain data for
metal deposition17. The volume of electrolyte was 500 ml. 30% KOH solution was used as
Adm−2. In shot to optimize conditions for the production of thick zinc electrodeposits, a range of current densities were scrutinized. The experimental results show that current density is inversely proportional to time to obtain the same deposit thickness.
3. RESULTS AND DISCUSSIONS
3.1 Effect of Current density distribution on structural and optical properties
3.1 (a). Structural analysis by XRD studies
From the above experiments, increasing the zinc concentration increased the current efficiency in a non-linear fashion and that the highest rate of increase occurred when the zinc concentration was increased from 100 gpl to 150 gpl. XRD patterns of the deposits at different current densities are given in the following figures. Structural characterization of the deposited plates was carried out by X-ray diffraction analysis using PANalytical, X’
pert PRO diffractometer with Cu- Kα radiation (ߣ ൌ1.54A◦). The X-ray scan rate was
1◦min−1 for 2θ ranging from 10◦ to 90◦. The hkl values were interpreted in accordance with
JCPDS. Lattice parameters were computed based on d spacing values for the given hkl
planes Preferred orientation of the zinc electrodeposits was calculated from the X-ray data
according to the method proposed by Golozar19 and Bouroushian20. Intense diffraction peaks observed in Figures 3-6 indicate the crystalline nature of the material.
Fig.3. Fig.4.
30 35 40 45 50 55 60 65 70 75 80 85 90 95 100 0 200 400 600 800 1000 2 0 0 1 1 1 1 0 2 1 0 1 1 0 0 In te n s it y ( a .u )
Position 2 theta (degrees)
0
0
2
30 35 40 45 50 55 60 65 70 75 80 85 90 95 100 0 50 100 150 200 250 2 0 0 0 2 0 In te n s it y ( a .u )
Position 2 theta (degrees)
1
0
S. R. Rajkumar, et al., J. Pure Appl. & Ind. Phys. Vol.5 (2), 33-46 (2015) 39
February, 2015 | Journal of Pure Applied and Industrial Physics | www.physics-journal.org
Fig.5. Fig.6.
Fig.3.XRD pattern of hcp lattice Geometries –Sample- SRR10 Fig.4.XRD pattern of hcp lattice Geometries –Sample- SRR4 Fig.5. XRD pattern of hcp lattice Geometries –Sample- SRR9 Fig.6. XRD pattern of hcp lattice Geometries –Sample- SRR3
The characteristic zinc peaks (101), (100), (002), (102), (112) and (110) are present in the X-ray diffractograms with no extra peaks ruling out the possibility of impurities. The crystallite sizes calculated from the Scherer formula are presented in above Tables .This shows that presence of surfactant protects the crystallites from crystal
growth and agglomeration.The presence of nanocrystallites increases the surface area
and thus producing improved current density. The planes have been observed18 and
compared with the JCPDS files21-24. Pyramidal textural intensity was significant than the
prismatic and basal textures. Generally, (101) hcp peak was present almost in all deposits
with significant intensity. The peak noted at the 2θ values were indexed to the planes.
Textural intensity was relatively higher for the deposits obtained 2 Adm−2. (200) α-peak for
Zinc was noted distinctly above 2 Adm−2. Certain peaks representing specific
crystallographic hkl plane gradually shifted either to higher or lower 2θ angles with the
change in Zinc content in the deposit. Both (002) and (102) peak shifted to higher 2θ ,
whereas (100) peak shifted to lower 2θ , when the Zinc content in the deposit was increased.
The (101) peak was not shifted significantly.These observed results are in accordance with previous reports. Inter-planar spacing (d) for different hkl planes for deposits obtained at different current density values . This showed that the hcp lattice geometry distorted, if the Zinc content was increased and the probability of substitution of Zinc is more, because the linear density along axis is lower. In other words the basal plane is tightly packed than the
axial plane. Peak broadening due to internal lattice strain was not notified from the
observed full width at half maxima (FWHM) values. This shows that adherent and strain free deposits were obtained under the conditions studied. The deposited alloy belongs to intermediate phase type, since the crystal structures of the metal is not same and the atomic
30 35 40 45 50 55 60 65 70 75 80 85 90 95 100 0 200 400 600 800 1000 1200 1400 1600 1800 2 0 0 1 1 1 1 0 2 0 0 2 1 0 0 In te n s it y ( a .u )
Position 2 theta (degrees)
1
0
1
40 50 60 70 80 90 100 0 500 1000 1500 2000 2500 2 0 0 1 1 1 1 0 2 1 0 1 1 0 0 In te n s it y ( a .u )
Position 2 theta (degrees)
0
0
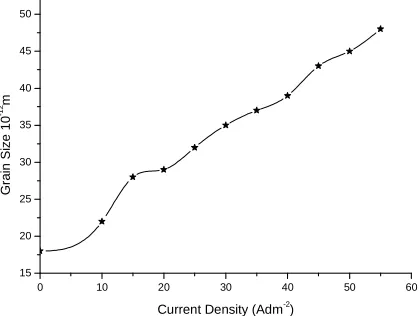
volume ratio of zinc is ∼80 % .Nano sized crystallites were obtained in the presence of surfactants. .By using Scherer’s formula equation, The averaged crystallite grain sizes of fcc phase in Zn films electrodeposited at different current densities are calculated (Table.2) and shown in (Fig.5.(a).)
Fig. 5.(a). Average grain sizes of fcc phase in electrodeposited films
Table 2. Physical Parameters of electrodeposited films
Zinc ID
Particle Size (FESEM)
Crystallite Size (XRD)nm
Deposited Mass (gm)
Density
(g/cm-3) Surface area(m2/gm) Total Surface
area(m2)
Particle Morphology
Zn-SRR1 1~2ߤm 35~40 3.540 0.53 4.20 23.5 Dendrite Zn-SRR2 1~2ߤm 30~40 3.530 0.59 4.23 21.5 Dendrite Zn-SRR3 1~2ߤm 20~30 3.554 0.52 5.24 23.2 Dendrite Zn-SRR4 1~2ߤm 20~25 3.608 0.56 4.22 23.3 Boulders Zn-SRR5 1~2ߤm 15~20 3.540 0.60 4.15 24.5 moss Zn-SRR6 1~2ߤm 10~20 3.405 0.61 4.30 20.5 dendrite Zn-SRR7 1~2ߤm 10~20 3.460 0.63 4.20 18.9 Leaf structure Zn-SRR8 1~2ߤm 10~15 3.407 0.54 4.35 19.5 Leaf structure Zn-SRR9 0.1~1.0ߤm 10~15 3.408 0.55 4.40 21.5 Leaf structure Zn-SRR10 0.1~1.0ߤm 10~15 3.402 0.57 5.00 23.5 dendrite
3.1 (b). Textural and morphological analysis of Electrodeposits films Optical properties analysis by FESEM
The physics of defects in Zn electrodeposition is quite complex and to a large extend unknown, and the understanding of doping and conduction mechanisms in this material are still incomplete and challenging. A field emission scanning electron
microscope (FESEM) (JEOL-JSM 6701F) was used to examine the grain size ( >1 ߤm) of
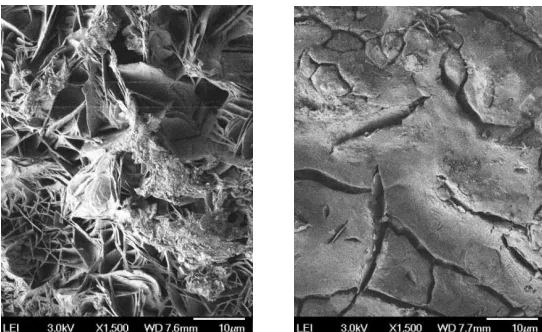
the coated surface and cross-sectional morphologies of the nanocrystalline zinc deposits. From FESEM images (Fig.7-8.), it was observed that the deposit morphology was
0 10 20 30 40 50 60
15 20 25 30 35 40 45 50
G
ra
in
S
iz
e
1
0
-1
2m
Current Density (Adm-2
S. R. Rajkumar, et al., J. Pure Appl. & Ind. Phys. Vol.5 (2), 33-46 (2015) 41
February, 2015 | Journal of Pure Applied and Industrial Physics | www.physics-journal.org
influenced by the alloy composition. Four types of morphologies were observed. For
zinc-rich alloy ( <10% ), distorted hexagonal (1 Adm−2) morphology was noted. For an alloy with
optimum (10 – 25%) zinc content, triangular pyramidal morphology (2 – 4 Adm−2) was
observed. Relatively smooth and compact deposit with fine-grained morphology was noted
at 3 Adm−2.Coarser deposits with stacked platelet columnar morphology were noted above 5
Adm−2 ( > 25%). Reduction of crystallite size at 3 Adm−2 indicates that the nucleation rate was higher than the grain growth rate. This indicates the overall deposition rate was predominantly controlled by charge-transfer processes rather than mass-transfer processes.
But at higher current densities (above 5 Adm−2) the overall deposition rate was controlled by
mass transfer limitations particularly for zinc. So the grain growth rate was higher than the nucleation rate and this leads to the formation of coarser morphology. The FESEM picture clearly illustrates the nodular structure of the film. The coating layer is dense with very fine crystals. The discontinuities appeared in the coating layer indicates that a significant amount of hydrogen gas evolved simultaneously at the cathode interfered with the crystal structure.
The surface morphology of the Zn sample deposited at 2 Adm−2 shows a particle-like
structures grew onto the surface, these particles superimposed on each other’s . Moreover, they are in a different direction with their tips and are deposited to be set up with
no uniform shape. When the current density applied on the cell is increased to 3 Adm−2, the
Zn2+ separates from the zinc sulphate under the influence of the applied electric field to the
cell. It moves to the cathode faster than the previous sample and will melt in water. The FESEM picture clearly illustrates the nodular structure of the film. The coating layer is dense with very fine crystals. The discontinuities appeared in the coating layer indicates that a significant amount of hydrogen gas evolved simultaneously at the cathode interfered with the crystal structure. The surface morphology of Zn film illustrates that the surface was composed of the aggregates of a hexagonal columnar grains which had grown normal to the substrate surface. In absence of surfactant the particle are dendritic in nature and have variable particle size The Nanocrystalline deposits have higher surface area (Table. 2) which results in better discharge performance (Fig.9). Irregular shaped micrometer sized particles were deposited in the absence of surfactants. Well defined leaves like nano sized structures were developed When EDTA was used as surfactant rod like submicron sized structures were produced.
3.2. Morphological changes with temperature, pH and Bulk density
Electrodeposits were produced with pH variation in the range of 2.6 to 5.0 at
a current density of 3 Adm−2. Such variations had no significant effect on the thickness of
powders have high bulk densities and thus poor high current performance. Increase in temperature was observed to have some effect on the crystal orientation of the deposit. With increasing temperature, the lateral stacking sequence of crystal orientation appears to have transformed from the usually random orientations to that with the edges of the crystals perpendicular to the surface of the substrate . Also, at about 32oC, onset of white patches was noticed as particles on the edges of zinc crystal. Therefore, another possible reason for the change of lattice parameter may be raised. It is known that with increasing current density, the film thickness increases, which results in higher strains in the film.
Fig. 7. FESEM Micrograph of Zn Electrodeposits from the Bath with presence of EDTA (Zn-10) a) Low magnification of nano particles b) High magnification of nano particles
S. R. Rajkumar, et al., J. Pure Appl. & Ind. Phys. Vol.5 (2), 33-46 (2015) 43
February, 2015 | Journal of Pure Applied and Industrial Physics | www.physics-journal.org
Fig.9. Discharge performance of various zinc samples at different current densities
Fig.10. Discharge performance of various zinc samples at 220mAcm-2
3.3. Electrochemical performance on Morphology electrodeposition
The surface area of various samples is shown in Table.2. An increase in the surface area was observed with increase in the concentration of KOH or increasing current density.
100 200 300 400 500 600 700 800 900
1.2 1.3 1.4 1.5 1.6
V
o
lt
s
Discharge Current Density (Adm-2)
Zn -SRR1 Zn -SRR2 Zn -SRR3 Zn -SRR4 Zn -SRR5 Zn -SRR6 Zn -SRR7 Zn -SRR8 Zn -SRR9 Zn -SRR10
0 50 100 150 200 250 300
1.15 1.20 1.25 1.30 1.35 1.40 1.45 1.50 1.55 1.60 1.65
V
o
lt
s
Discharge time (sec)
Surface area decreased with increase in distance between the electrodes and increase in ZnO concentration. It is clear from Table-2 that Zn-SRR10 has the highest electrode surface area and power density. The discharge performance of various electrodes at various current densities is shown in Fig.9. Open circuit voltages of the cells are in the range of 1.33V to 1.48V. It is clear from the discharge curves that the powders with low surface area have poor high rate performance. At high discharge currents (Fig.9) high surface area samples Zn- SRR 4, Zn- SRR 8 and Zn- SRR 10 showed good performance. Good performance was observed at moderate discharge rates (Fig.10) for Zn- SRR 2, Zn- SRR 3, and Zn- SRR 9. It is observed in Fig.10 that an increase in KOH concentration results in a decrease in energy density. Zn- SRR 2 with 2N KOH concentration has highest energy density while Zn- SRR 6 with 2M KOH concentration has lowest energy density. Decrease in distance between electrodes during deposition process results in decrease in specific energy density. Zn- SRR 2, Zn- SRR 3 and Zn- SRR 10 are best in term of energy density. The as prepared Zinc electrodes show excellent performance when used in bipolar cell configuration (Fig.11). Here the current density distribution varies between 70.07 % and 97.75 % of standardized value. With these experiments it could be also shown that the influence of the anode quality on the cathodic precipitation and current efficiency is quiet low even if different geometrical conditions appear in the electrolytic system.
Fig.11. Discharge performance of the Electrochemical cell assembly
4. CONCLUSION
The thin deposited electrodes thus obtained can be used for compact zinc bipolar batteries for high current applications. At low current densities the discharge of Zn ions occurs slowly and hence the rate of growth of nuclei exceeds the rate at which the new ones form; the deposits obtained under these conditions should be smooth and
0 10 20 30 40 50 60
2.0 2.5 3.0 3.5 4.0 4.5 5.0
V
o
lt
s
S. R. Rajkumar, et al., J. Pure Appl. & Ind. Phys. Vol.5 (2), 33-46 (2015) 45
February, 2015 | Journal of Pure Applied and Industrial Physics | www.physics-journal.org
uniform. Zn-SRR4 and Zn- SRR 9 with the highest surface area are good for high discharge performance and Zn- SRR 3 and Zn- SRR 10 are best in term of specific energy densities.
However when current density exceeds a critical value, (10 Adm−2), a porous and
non-uniform microstructure develops. This can be attributed to the high potential, which causes the Zn ions, from solution to move at a very fast rate towards cathode.
REFERENCES
1. T. Pauporté, D. Lincot, J. Electroanal. Chem., 517, 54-62 (2001).
2. J. Torrent Burgues , E. Guaus, J. Appl. Electrochem. 37 : 643 (2007).
3. Xianbo Jin, Junatao Lu, Yong Xia et al, J. Power Sources, 102: 124 (2001).
4. Z.G. Chen, Y.W. Tang, L.S. Zhang, L.J. Luo, Electrochim. Acta 51 (2006) 5870.
5. Hee Yeon Yang, Se Han Lee, Tae Whan Kim, Appl. Sur. Sci. 256, 117 (2010).
6. J. N . Agar and T . P . Hoar, Discussions on electrode processes , Faraday Soc. No.
1 , 158 (1947).
7. V.B. Fiks, “Mechanics of the mobility of ions in metals”, Soviet Physics Solid State, V.
1, No. 1, 14-28 (1959).
8. H. B. Huntington and A. R.Grone, “Current- induced marker motion in gold wires”,
Journal of Physics and Chemistry of Solids, V. 20, No. 1, 76-87 (1961).
9. J. R. Black, “Electromigration failure modes in Aluminum metallization for
semiconductor devices”, IEEE, V. 57, No. 9, 1587-1594 (1969).
10. T. J. Tuaweri , “A Study of Process Parameters for Zinc Electrodeposition from a
Sulphate bath”, International Journal of Engineering Science Invention Volume 2(8),
17-24 (2013).
11. T.D. MC Colm and J.W. Evansa,“A modified Hull cell and its application to the
electrodeposition of zinc,” Journal of Applied Electrochemistry 31, 411-419 (2001).
12. P.M. Vereecken, I. Shao, P.C. Searson, Particle codeposition in nanocomposite films,J.
Electrochem.Soc., 147, 2572–2575 (2000).
13. Xingpu Y., Celis J. P. , De Bonte M. and Roos J. R., Ductility and Crystallographic
Structure of Zinc Foils Electrodeposited from Acid Zinc Sulfate Solutions, Journal of
Electrochemical Society, 141(10), 2698-2708 (1994).
14. Uziel Landau, R. Akolkar, M. Bubnick and J. D'Urso, "Synergistic and Transient
Effects of Additives in Copper Interconnect Metallization", Extended Abstract No. 612, 203rd Electrochemical Society Meeting, Paris, France, April 28-May 2 (2003).
15. Eugene Malyshev, Uziel Landau and Sergey Chivilikhin, “Modeling the Deposit
Thickness Distribution in Copper Electroplating of Semicondutor Wafer Interc connects”, Paper # 190 c, Session TK (this Symposium); Proceedings of the AICHE Annual Meeting, San-Francisco, CA Nov. (2003).
16. G. Bauer, V. Gravemeier, W.A. Wall, “A 3D finite element approach for the coupled
17. X. Zhang, C.C. Koch, Symposium Proceedings of the Metal and Materials Society
(TMS), Nashville, Tennessee, March 12 -16, 289 -298 (2000).
18. A.J. Gay and F. Bergsma, “The influence of nitrate ion on the morphology of zinc
electrodeposits”, Electrochim. Acta, 23, 1067-1072 (1978).
19. Vasilakopoulos D., Bouroushian M., and Spyrellis N., Texture and Morphology of Zinc
Electrodeposited from an Acid Sulphate Bath, Journal of Transactions of the Institute of
Metal Finishing, 79(3), 107–111 2001.
20. Raiessi R., Saatchi A., Golozar M. A. and Szpunar J.A. , Effect of Surface Preparation
on Zinc Electrodeposited Texture, Surface and Coatings Technology, 197, 229-237 (2005).
21. H.Swanon. E.Tatge.Natl .Bur,stand(U.S),Circ.539.359,I1(1953), No. ID-87-0713/
ICSD-064990.
22. R.W.Lynch. Drickamer,HG ., J .Phy. Chem. Solids 26,63, ID-65-5973 (1965).
23. H.Swanson, E.Tatge, Natl, Bur stand (U.S),Circ,539.1,16 ID-04-0831-/ CAS
No:7440-66-6 (1953).