Nutrient composition, uptake by weeds and rice under
different crop establishment and weed management
practices
Arunbabu Talla
*and Satya Nanda Jena
Department of Agronomy, College of Agriculture, Orissa University of Agriculture & Technology, Bhubaneswar, Odisha, India *Corresponding author: [email protected]
Paper No. 272 Received: 16 September, 2014 Accepted: 17 October, 2014 Published: 17 December, 2014
Abstract
Field study was conducted during the kharif, 2011 at Agronomy Research Farm, Central Research Station, Orissa University of Agriculture and Technology, Bhubaneswar to assess the nutrient concentration and uptake by weeds and crops under different crop establishment methods. Weedy check recorded highest nutrient content of weeds. Weedy check plot recorded the maximum N, P and K content of 0.83, 0.13 and 1.3% respectively. The removal of N,P and K (82.45,13.42 and 127.74 kg ha-1 ) was the highest in the
same treatment and the lowest nutrient uptake by conoweeding N,P and K was 0.73 , 0.13 and 1.25% and removal of N,P and K (kg ha-1) was 17.34, 3.11 and 29.44 respectively. The nutrient content of grain
and straw of rice in conoweeding was maximum recording N, P and K of grain are 1.33, 0.37 and 1.26% respectively. The corresponding values for straw were 0.44, 0.10 and 1.82% respectively. The weedy check recorded the lower values of N, P and K content as compared with weed control treatments. Nutrient uptake of rice crop showed that maximum uptake of nutrient was recorded in SRI (62.72 and 25.13 kg ha-1 of N, 17.06 and 5.26 kg ha-1 of P and 13.04 and 101.11 kg h-1a of K in grain and straw
respectively) it was followed by transplanting, drum seeding and line sowing. Minimum depletion of 47.34 kg of N, 11.18 kg ha-1 of P and 67.54 kg ha-1 of K was observed in weedy check taking the total
values of grain and straw. The highest benefit: cost ratio were recorded in the SRI supplemented with conoweeder.
Highlights
• Weedy check recorded the maximum removal of N, P and K of 82.45, 13.42 and 127.74 kg ha-1
respectively.
• Maximum uptake of nutrient was recorded in SRI (62.72 and 25.13 kg ha-1 of N, 17.06 and 5.26 kg
ha-1 of P and 13.04 and 101.11 kg ha-1of K) with respect of conoweeder 63.34 and 24.52 kg ha-1 of N,
17.62 and 5.57 kg ha-1 of P and 12.38 and 101.42 kg ha-1of K) for grain and straw respectively.
Keywords: Crop establishment methods, weed management practices, nutrient content, uptake, Rice.
Rice (Oryza sativa L.), is the most popular staple food of more than 60% of world’s population. It is the leading food crop of the world, cultivated over an area of around 150 million hectare with a total production of about 573 million tones with
glance, 2011).Rice accounts a major share in tropical
and subtropical countries including India, being a second largest producer and consumer in the world (IFPRI, 2010). India occupies a premier position both in terms of area and production of rice in the world.
rice in the world, but its productivity level of 2.4 t ha-1 (Economic Survey, 2012-13). It is specified that
national average yield of rice in India is far behind the world’s average yield. Due to high population growth, India should add 1.7 million tonnes of additional rice every year to ensure national food security (Das and Chandra, 2013). Rice is grown mainly by transplanting that requires more labour and time under irrigated condition. During the peak period of farm operations, the labour availability becomes scarce, therefore, the farmers are switching to direct seeding under puddle conditions. Sustainable rice productivity have been increased by adopting new techniques like SRI method, which has been tried in many countries (Uphoff et al., 2013) and recorded significant yield improvement when compared to conventional practices. The extent of yield reduction due to weed infestation varies from 35 to 72 % in rice grown under transplanted condition (Mukherjee and Singh, 2004). Estimated losses from weeds in rice area round 10% of total grain yield; however, can be in the range of 30 to 90%, reduces grain quality and enhances the cost of production (Singh et al., 2009).
Weeds characters like short duration, prolific seed production, vigorous vegetative growth in initial stages led to causing diseases like dermotitis (Parthenium sps.) to human beings and extreme competition for all inputs like (nutrient, moisture and light) with crop habitats. So, it is reported that better management of the weeds, knowing the habitat, morphology and biology of the weeds are also important (Gnanavel and Natarajan, 2013). Keeping in view the above facts, the present study was under taken to evaluate the nutrient concentration and uptake by weeds and crops under different crop establishment method and weed management practices.
Materials and Methods
The study was carried out during the kharif, season 2011-12 at Agronomy Research Farm, Orissa University of Agriculture and Technology,
Bhubaneswar. The experimental design used was split-plot design, which contains total sixteen treatments included four main plots and four subplots. Rice establishment methods taken in main plots i.e. M1 (System of Rice Intensification, SRI), M2 (Transplanting), M3 (Line sowing) dry seeding and M4 (Drum seeding). The subplots contain four different type of weed management practices i.e. W1 (Pyrazosulfuron –ethyl @20 g ha-1),
W2 (Conoweeding), W3 (Two hand weedings) at 20 and 40 DAS/T (Days after sowing/Transplanting) and W4 (weedy check) which were replicated thrice. “Pratikshya” was grown as the test variety of rice. The soil of the experimental site was sandy loam in texture with pH 5.45, EC (0.14 dsm-1) medium in organic
carbon (0.64%), low in available nitrogen (174.58 kg ha-1), but high in available phosphorus (40.626 kg
ha-1) and high in available potassium (312.54 kg ha-1)
by chemical analysis (Jackson, 1973). Seed rate used in SRI, transplanting for nursery bed were 5 and 50 kg ha-1 respectively and in direct seeding method
it is 80 kg ha-1. Well decomposed and powdered FYM
was added and mix thoroughly at the time of layout and leveling. Application of nutrients was done as per the recommendation (80 kg N, 40 kg P2O5 and 40 kg K2O ha-1) in the form of urea, single superphosphate
and murate of potash, respectively. Nitrogen was applied in 3 splits i.e. 25% at the time of sowing, 50% at active tillering and 25% at panicle initiation stage. Entire quantity of phosphorus and potassium was applied as basal. Zinc sulphate was applied @ 25 kg ha1 at last puddling operation three days prior
Statistical Analysis
The data obtained on various characters were averaged, tabulated and analysed statistically as per split-plot design (Panse and Sukhatme, 1995). Standard error of mean and critical difference (CD) were found out by using following formulae
SEm=EMS/r
Where, EMS =Error Mean Square, r =number of replication, d.f=Degree of freedom
CD (P= 0.05) = 2 SE (m) t (error)d.f Where,
t (error d.f) t value at error degree at 5% level of probability
CD (Critical difference) value was taken for comparison between means. If the value exceeds the difference between two treatment means, then there is significant difference between the treatments.
Results and Discussion
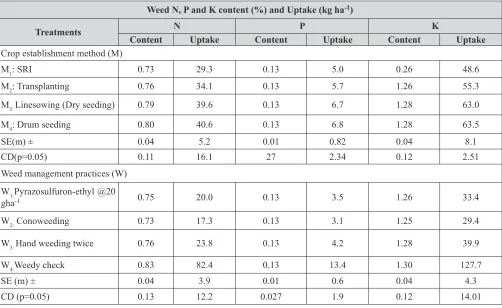
An examination of data on nutrient content and uptake by weeds presented in table 1. Indicated that the potassium content of weed was higher than nitrogen and phosphorus contentwas low compared with N and K content. Weedy check plot recorded the maximum N, P and K content of 0.83, 0.13 and 1.30% respectively. The removal of N, P and K (82.45, 13.42 and 127.74 kg ha-1) was the highest in
the weedy check treatment. Lowest nutrient uptake was by conoweeding with N, P and K content of 0.73, 0.13 and 1.25percent and removal of N, P and K (kg ha-1) of 17.34, 3.11and 29.44 respectively which
might be owing to the reason that conoweeder operation destroyed the weeds considerably, so that the nutrient uptake by crop was increased than that by weeds and controlled effectively (Revathi, et.al., 2012). The pattern of nutrient removal by weeds showed that wherever effective weed control was possible the nutrient loss due to weeds was less. Table 1. NPK content (%) and uptake (kg ha-1) by weeds as affected by crop establishment methods and weed management
practices in rice
Weed N, P and K content (%) and Uptake (kg ha-1)
Treatments N P K
Content Uptake Content Uptake Content Uptake
Crop establishment method (M)
M1: SRI 0.73 29.3 0.13 5.0 0.26 48.6
M2: Transplanting 0.76 34.1 0.13 5.7 1.26 55.3
M3: Linesowing (Dry seeding) 0.79 39.6 0.13 6.7 1.28 63.0
M4: Drum seeding 0.80 40.6 0.13 6.8 1.28 63.5
SE(m) ± 0.04 5.2 0.01 0.82 0.04 8.1
CD(p=0.05) 0.11 16.1 27 2.34 0.12 2.51
Weed management practices (W) W1:Pyrazosulfuron-ethyl @20
gha-1 0.75 20.0 0.13 3.5 1.26 33.4
W2: Conoweeding 0.73 17.3 0.13 3.1 1.25 29.4
W3: Hand weeding twice 0.76 23.8 0.13 4.2 1.28 39.9
W4:Weedy check 0.83 82.4 0.13 13.4 1.30 127.7
In crop establishment methods highest removal of N, P and K by weeds in drumseeding method which was statistically at par with remaining crop
establishment methods (Table 1) due to the reason
that weed growth was faster than crop in direct seeded rice (drumseeding) and absorb added nutrients more rapidly in larger quantities than by crops same reported (Revathi, et.al. 2012).
Data set out in Table 2. Revealed that nitrogen content of grain was about two times higher than the straw. The phosphorus content in the grain was observed to be more than two fold to that of straw but the straw recorded four to five times higher potassium content than the grain. Highest N, P and K in grain and straw uptake recorded in SRI which was significantly not
difference with remaining methods due to SRI uptake
from deeper and proliferate root system to more nutrients. (Jayashree and Reddy, 2003) has reported better control of weeds and favourable conditions for crop growth resulted in higher nutrient uptake by
crop.In weed management practices, conoweeding was maximum N, P and K of grain by 1.33, 0.37 and 1.26% as well as straw by 0.44, 0.10 and 1.82% respectively.
Conoweeding has shown nonsignificant difference with pyrazosulfuron-ethyl @ 20 g ha-1 and significant difference with hand weedings and weedy check.
The weedy check recorded the lower values of N, P and K content as compared with other weed control treatments.
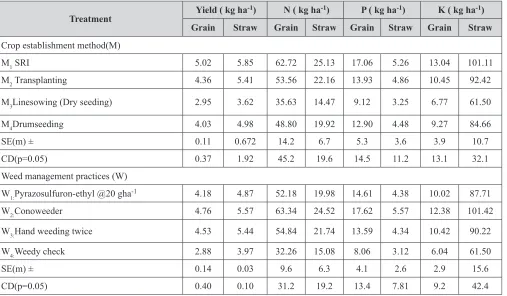
The data on nutrient uptake of rice crop is presented in table 3. The results showed that maximum uptake of nutrient was recorded in SRI (63.34 and 25.48 kg ha-1 of N, 17.248 and 5.558 kg ha-1 of P
205 and
13.08 and 101.035 kg ha-1of K
20 in grain and straw
respectively). It was followed by transplanting, drum seeding and line sowing. Minimum removal of 70.95 kg N, 75.15 kg ha-1 P and 11.32 kg ha-1 K by grain and
straw was observed in weedy check. Table 2. NPK content (%) of grain and straw (kg ha-1) of rice as affected by
crop establishment methods and weed management practices
Treatment
NPK content (%)
N P K
GRAIN STRAW GRAIN STRAW GRAIN STRAW
Crop establishment method(M)
M1: SRI 1.25 0.43 0.34 0.09 0.26 1.73
M2: Transplanting 1.23 0.41 0.32 0.09 0.24 1.71
M3 : Linesowing (Dry seeding) 1.21 0.40 0.31 0.09 0.23 1.70
M4: Drumseeding 1.21 0.40 0.32 0.09 0.23 1.70
SE(m) ± 0.05 0.04 0.04 0.01 0.03 0.04
CD(p=0.05) 0.17 0.12 0.12 0.027 0.086 0.13
Weed management practices (W)
W1: Pyrazosulfuron-ethyl @20 gha-1 1.25 0.41 0.35 0.09 0.24 1.80
W2: Conoweeder 1.33 0.44 0.37 0.10 1.26 1.82
W3 : Hand weeding twice 1.21 0.40 0.30 0.08 0.23 1.66
W4 : Weedy check 1.12 0.38 0.28 0.08 0.21 1.55
SE(m) ± 0.05 0.03 0.05 0.01 0.03 0.04
Grain and straw yield of rice in SRI was significantly
difference with remaining methodsdueto that SRI
Significant growth characters like leaf number per plant, leaf area index and tiller number per unit area might have resulted in increased photosynthesis and production resulting of photosynthates which finally transformed into high number of panicles per unit area and thereafter higher relative accumulation of dry matter. Straw yield also showed the same trend like grain yield in establishment techniques (Rani and Sukumari, 2013). Whereas, in weed management practices conoweeder is shown the same behavior. Maximum crop nutrient uptake was recorded by SRI, which was statistically at par with transplanting, but it is significantly difference with remaining crop establishment methods.Weed management practices does not shown any effect on N, P and K nutrient uptake of grain and straw. All the weed management practices except weedy
check are statistically at par with each other. SRI and conoweeder has recorded maximum grain as well as straw yield, which was significantly different with remaining treatments. It might be due to removal,
incorporation subsequently decomposition in to the
soil serves may facilitate higher nutrient availability in conoweederthroughout the crop duration. This result was in accordance with the findings of (Uphoff. 2006) who reported that weeding with rotating hoe actively aerates the soil and at the same time churns weeds back in to the soil to decompose, thereby conserving nutrients. With respect of nutrient uptake by rice of N,P and K in SRI is statistically at par with transplanting method, but it is significantly difference with remaining crop establishment methods. Weed management practices does not shown any effect on N, P and K nutrient uptake of grain and straw. All the weed management practices except weedy check
are statistically at par with each other. Transplanted
Table 3. Grain and straw yield (t ha-1) and Nutrient uptake by rice crop (kg ha-1) as affected by crop establishment methods and weed management practices
Treatment Yield ( kg ha
-1) N ( kg ha-1) P ( kg ha-1) K ( kg ha-1)
Grain Straw Grain Straw Grain Straw Grain Straw
Crop establishment method(M)
M1 SRI 5.02 5.85 62.72 25.13 17.06 5.26 13.04 101.11
M2 Transplanting 4.36 5.41 53.56 22.16 13.93 4.86 10.45 92.42
M3Linesowing (Dry seeding) 2.95 3.62 35.63 14.47 9.12 3.25 6.77 61.50
M4Drumseeding 4.03 4.98 48.80 19.92 12.90 4.48 9.27 84.66
SE(m) ± 0.11 0.672 14.2 6.7 5.3 3.6 3.9 10.7
CD(p=0.05) 0.37 1.92 45.2 19.6 14.5 11.2 13.1 32.1
Weed management practices (W)
W1:Pyrazosulfuron-ethyl @20 gha-1 4.18 4.87 52.18 19.98 14.61 4.38 10.02 87.71
W2:Conoweeder 4.76 5.57 63.34 24.52 17.62 5.57 12.38 101.42
W3:Hand weeding twice 4.53 5.44 54.84 21.74 13.59 4.34 10.42 90.22
W4:Weedy check 2.88 3.97 32.26 15.08 8.06 3.12 6.04 61.50
crop recorded lower population of all weed species leads to higher grain yield as compared to dry seeding and hand hoeing. Direct seeding produced similar grain yield under herbicides and hand hoeing (Singh and Bhullar, 2014).
Conclusion
Nutrient content and uptake by weeds are, the potassium content of weed was higher than nitrogen, and phosphorus content was low compared with N and K content. Weed check plot recorded the maximum N, P and K content of 0.83, 0.13 and 1.29% respectively. The removal of N,P and K (82.45,13.42 and 127.74 kg ha–1) was the highest in
the same treatment and the lowest nutrient uptake by conoweeding N,P and K was 0.73, 0.13 and 1.25% and removal of N,P and K (kg ha–1) was
17.34, 3.11and 29.44 respectively . Nitrogen content of grain was about two times higher than the straw the phosphorus content in the grain was observed to be more than two fold to that of straw but the straw recorded four times higher potassium content than the grain .The nutrient content of grain and straw of rice in conoweeding was maximum recording N,P and K of grain are 1.33, 0.37 and 1.26% respectively. The corresponding values for straw were 0.44, 0.10 and 1.82% respectively. The weedy check recorded the lower values of N, P and K content as compared with weed control treatments. Nutrient uptake of rice crop showed that maximum uptake of nutrient was recorded in SRI (63.34 and 25.48 kg ha–1 of N, 17.24
and 5.55 kg ha–1 of P and 13.08 and 101.03 kg h–1 a of
K in grain and straw respectively) it was followed by transplanting, drum seeding and line sowing. Minimum depletion of 70.95 kg of N, 75.15 kg ha–1
of P and 11.32 kg ha–1 of K was observed in weedy
check taking the total values of grain and straw.
References
Agricultural statistics at a glance. 2011. Ministry of agriculture, Government of India.
Das, A and S. Chandra. 2013. Irrigation, spacing and cultivar effects on net photosynthetic rate, dry matter partitioning
and productivity of rice under system of rice intensification in mollisols of northern india. Experimental Agriculture 49(4): 504-523.
Economic Survey. 2013. Economic Survey of India. Government of India, A-19.
Gnanavel, I and S. K. Natarajan. 2013. Partheniumhysterophorus L.: A Major Threat to Natural and Agro Eco-systems in India. International Journal of Agriculture, Environment and Biotechnology 6(2): 261-269.
Jackson, M. L. 1973. Soil chemical analysis, Prentice hall of India Private Limited, New Delhi: 498.
Jayashree, B and M.D. Reddy. 2003. Weed control and nitrogen levels on performance of wet seeded rice. Short communication. Indian Journal of Weed Science35: 123-124. Mukherjee, S.K and S. Singh. 2004. Chemical weed control
in rice-wheat rotation. In Proceedings of Indian Society of Agronomy National Symposium held in Hisar, India 14-16 March. 62-67.
Panse, V.G and P.V. Sukhatme. 1995. Statistical Methods for Agricultural Workers ICAR, New Delhi. 145-150.
Rani, S and P. Sukumari. 2013. Root Growth, Nutrient Uptake and Yield of Medicinal Rice Njavara under Different Establishment Techniques and Nutrient Sources. American Journal of Plant Sciences4: 1568-1573.
Revathi, M., N.K. Prabhakaran, C. Chinnusamy and S. Meena. 2012. Influence of Establishment Methods and Weed Management Practices on Nutrient Removal by Weeds and Uptake by Rice in Puddled Lowland. Madras Agricultural Journal99(7-9): 496-499.
Singh, B.S and M.S. Bhullar. 2014. Weed Dynamics and Dry Seeded Rice Productivity in Relation to Sowing Time, Variety and Weed Control in Sub-Tropical and Semi-arid Region of Punjab. International Journal of Agriculture, Environment and Biotechnology7: 219-224.
Singh, S., R.S. Chhokar, G. Ravi, K.Virender and M. Singh. 2009. Integrated weed management –A key for success of direct seeded rice in the Indo-Gangetic Plains. International Rice Research Institute (IRRI), Los Baños, Laguna (Philippines).
Uphoff, N. 2006. The System of Rice Intensification (SRI) as a methodology for reducing water requirements in irrigated rice production. Cornell International Institute for Food, Agriculture and Development, Ithaca, NY, USA, Paper for International Dialogue on Rice and Water: Exploring option for Food security and Sustainable Environments, held at IRRI, Los Banos, Philippines, March 7-8, 2006.