INTRODUCTION Previous History
Size-oriented metrics are derived by normalizing quality and/or productivity measures by considering the “Size” of the software that has been produced. Function-oriented software metrics use a measure of the functionality delivered by the application as a normalization value. Network Metrics for design focus on the structure chart and define some metrics of how “good” the structure or network is in an effort to quantify the complexity of the call graph. Many of the metrics that are traditionally associated with code can be used effectively after detailed design. During detailed design all the metrics covered during the system design are applicable and useful.
Software Evaluation for
Developing Software Reliability and Metrics
SRI PAMMI SRINIVAS
Department of Computer Science, DNR College, Bhimavaram (India).
(Received: December 05, 2010; Accepted: January 17, 2011)
ABSTRACT
The Dissertation presents a study and Implementation of different software metrics. We find that there are specific metrics for different stages of the software development cycle. The Metrics in this dissertation as a literature study is Metrics for Software Requirements, Metrics for Design Level. The Software Metrics covered in this Dissertation are Object-Oriented Design Metrics, Metrics for Coding Level, Metrics for Testing Level, Building cost estimation model and Software Reliability Models. Reliability metric was one of the first early prediction models to be used. The late prediction models mostly consist of the Software Reliability growth models. Jelinski and Moranda’s model developed one of the earliest reliability models. Musa Basic Execution Time Model postulated that software reliability theory should be based on execution time, which is the actual processor time utilized in executing the program, rather than on calendar time.
Key words: Function-oriented metrics, Size-oriented metrics, Network metrics, Stability, Cyclomatic Complexity, Cohesion, Coupling, Object-oriented, Coding, Complexity, Style,
Testing, Bugs, Severity, COCOMO, metrics, prediction, halstead, product, process, project, productivity, technical, faults, fault-proneness.
Present System
Implementation & Methodology Object Oriented Design Metrics Weighted Methods per Class
The number of methods and their Complexity is a reasonable indicator of the amount of effort required to implement and test a class.
WMC = Σci
Where for i = 1 to n , If the complexity of each method is considered 1, WMC gives the total
number of methods in the class.
Halstead has proposed metrics for length and volume of a program based on the number of operators and operands. We define the following measurable quantities:
N1 =Σ f1.j N2 = Σf2.j
Where N1 is the total occurrences of different operators in the program and N2 is the total
Table 2.1: Severity Metrics and Ranking Criteria
Severity ranking Ranking criteria
Severity 1 Errors Program ceases meaningful operation
Severity 2 Errors Severe function error but application can continue Severity 3 Errors Unexpected result or inconsistent operation
Severity 4 Errors Design or suggestion
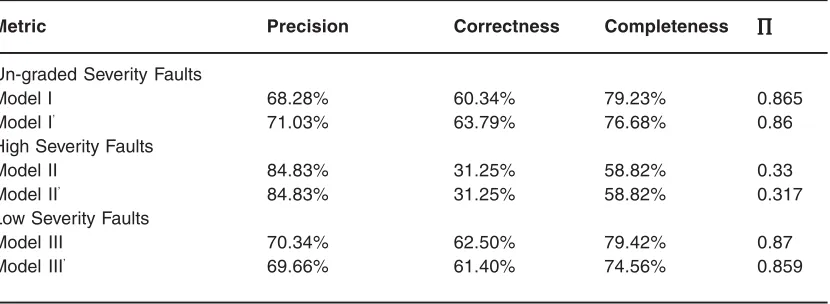
Table 2.3: Multivariate Analysis
Metric Precision Correctness Completeness ∏∏∏∏∏
Un-graded Severity Faults
Model I 68.28% 60.34% 79.23% 0.865
Model I’ 71.03% 63.79% 76.68% 0.86
High Severity Faults
Model II 84.83% 31.25% 58.82% 0.33
Model II’ 84.83% 31.25% 58.82% 0.317
Low Severity Faults
Model III 70.34% 62.50% 79.42% 0.87
Model III’ 69.66% 61.40% 74.56% 0.859
Table 2.2: Relative Seriousness (Composition) of Bugs Found
Error Ranking Description Bugs Bugs
Ranking Found Reported
Severity 1 Errors GPF or program ceases meaningful operation 18 9
Severity 2 Errors Severe Function error but application can continue 11 11
Severity 3 Errors Unexpected result or inconsistent operation 19 19
Severity 4 Design or suggestion 0 0
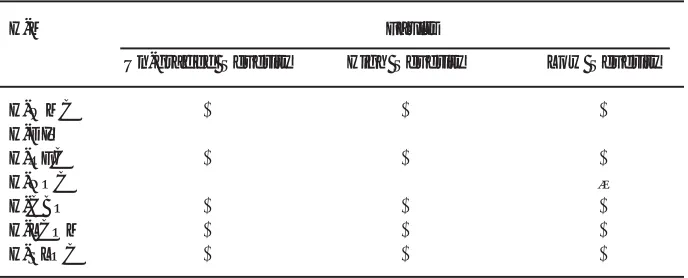
Table 4: Validation Results of the Hypotheses
H-M Faults
Un-graded Severity High Severity Low Severity
H-WMC √ √ √
H-DIT X X X
H-RFC √ √ √
H-NOC X ×
H-CBO √ √ √
H-LCOM √ √ √
H-SLOC √ √ √
occurrences of different operands. The length of the program is defined as:
N = N1 + N2
From the length and vocabulary, the volume V of the program is defined as
V= N log2 (n)
Where log2 (n) is the number of bits needed to represent every element in the program uniquely, and N is the total occurrences of the different elements. Volume is used as a size metric for a program.
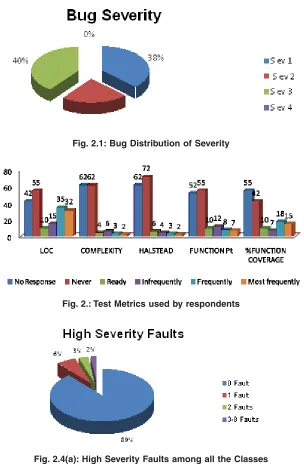
Metrics for Testing Level Severity
Severity is a fundamental measure of a bug or a failure. Many ranking schemes exist for defining severity. Because there is no set standard for establishing bug severity, the magnitude of the severity of a bug is often open to debate. The following table shows the definition of the severity metrics and the ranking criteria used.
Software Failures and bugs are measured by quantity and by relative severity. Severity is usually determined by a local set of criteria.
The above figure shows the graphical representation of the bugs found shown in table 2.2.
Types of metrics used
Very few respondents reported using any metrics at all. Lines of Code and percent function
coverage were the two most used metrics cited by survey respondents. Function points, cyclomatic complexity and Halstead’s metrics were used only rarely.
Software Reliability Models
MUSA’S Basic Execution Time Model:
In the basic model, it is assumed that each failure causes the same amount of decrement in the failure intensity.
λ (µ) = λ0 [1 - µ/V0 ]
Where,
λ0 = Initial failure intensity at the start of execution
V0 = Number of failures experienced, if program is executed for infinite time period
µ = Average or expected number of failures experienced at a given point in time
The relationship between failure intensity (λ) and mean failures experienced (µ)
λ0
Failure Intensity
Fig. 2.1: Bug Distribution of Severity
Fig. 2.: Test Metrics used by respondents
Fig. 2.4(a): High Severity Faults among all the Classes
Analysis of object-oriented design metrics for predicting severity faults
This study will test fault severity. Faults are either high severity or low severity. For each Metric M, the hypotheses in this study were Hypotheses Metric (H-M). H-M mean is that a class with a high M value is more likely to have high/low/ un-graded severity faults than a class with a low M value. This study makes use of the public domain data set KC1, which provides both method and class-level static metrics. All Faults in KC1 were categorized as of either a high or low severity
The above figures 2.4(a) & 2.4(b) show the distribution of high severity faults and low severity faults among the 145 classes. It can be seen that 11% of all the Classes (i.e., 16 classes) contain high severity faults and may contain between one and eight faults.
Multivariate Analysis
In this section, I can describe the performance of 3 multivariate fault-proneness prediction models built from design metrics only. 1. For un-graded severity faults
2. For high severity faults 3. For low severity faults.
Hypothesis
Most of the metrics are aimed at getting empirical laws that relate program size to expected no. of bugs, expected no. of tests required to find bugs, resource requirement, release instant, Reliability & Quality requirement. In this section, I will use findings to validate hypotheses. I will also compare the fault-proneness prediction capability of the metrics for high severity faults and low severity faults. Apart from the analysis results of the
regression analysis, the precision, correctness, and completeness values can also help us in the validation process.
The following table summar izes the validation results of the hypotheses stated above, in which λ means that the hypotheses is supported, X means that the hypotheses is not supported, and a blank entry means that the hypotheses was not examined.
Overall, the results mean that the regression model is more useful to software managers than the simple model in practice. The results suggest that the design metrics investigated perform much better in predicting fault-prone classes in terms of low severity faults than in predicting fault-prone classes in terms of high severity faults.
CONCLUSION
Recommendations for further research Previous studies have raised the need to validate OO design metrics across different faults severities. My study attempts to fill this gap by empirically validating OO design metrics for different fault severities. One limitation of my study is that the fault severity ratings in KC1 data set are subjective and may be inaccurate, which possibly limits the generalizability of my results. The data used in my study is from a single project. As a result, the findings in this paper should be viewed as exploratory and indicative rather than conclusive. In future work, we will replicate this study across projects. There is a need to validate my findings in other OO Programming languages such as Java.
BOOKS
1. Pankaj Jalote “An Integrated Approach to Software Engineering”, Second Edition, Narosa Publishing House.
2. Roger S. Pressman “Software Engineering: A Practitioner’s approach”, Vth Edition, McGraw Hill Publishing House.
3. Marnie L. Hutcheson “Software Testing
REFERENCES
Fundamentals, Methods and Metrics”, Wiley Dreamtech India Pvt. Ltd., 2003.
4. R.Subramanyam and M.S.Kr isnan,