Development and functioning of FX markets in Asia
and the Pacific
1Richard M Levich2 and Frank Packer3
Abstract
Global foreign exchange (FX) trading volume in traditional FX products and derivatives in Asia and the Pacific has expanded rapidly over the last 15 years, more so than in other regions. Asian currencies also have experienced exceptional growth in offshore turnover, including that of non-deliverable forwards (NDFs). Trading activity on this scale, spread across many countries and currencies, underscores the need for a smoothly functioning infrastructure and exceptional risk management processes. While settlement risks are mitigated for the vast majority of turnover through systems such as CLS Bank, the Asia-Pacific region would benefit by having more countries and currencies become CLS-enabled or tradable under other payment-versus-payment (PVP) systems. Although their volatility was less pronounced than during the global financial crisis, FX markets in the region experienced added turbulence during the “taper tantrum” of 2013. High-turnover currencies tended to depreciate more after the taper announcements, although volatility rose more sharply in currencies with low turnover. The FX market is a prominent venue for carry trades that are subject to crash risk. While there is some evidence of herding behaviour exacerbating this risk over the past decade, the measures calibrated more recently do not suggest exceptional crowding into carry trades ahead of the “taper tantrum” in 2013. At the same time, our measures of crowdedness for the carry trade show considerable variation over time. It might be useful to make crowdedness measures publicly available.
1 We thank Jimmy Shek for his research assistance and participants at a BIS workshop in 2013 for
helpful comments on an initial outline. We have also benefited from the remarks of participants at the 2014 conference in Wellington, in particular from discussant Takatoshi Ito. We also thank Mychal Campos, Sammie Chan, Juan Gutierrez, Rachel Hoey, Dino Kos and Andreas Schrimpf for comments. The views expressed here are those of the authors and do not necessarily reflect those of the BIS.
2 Professor of Finance and International Business and Deputy Chair of the Department of Finance,
Stern School of Business, New York University, New York, New York and NBER.
3 Regional Adviser, Representative Office for Asia and the Pacific, Bank for International Settlements,
1. Introduction
Global foreign exchange (FX) trading volume has expanded rapidly in recent years. According to BIS data, daily turnover in traditional FX products and derivatives grew from an estimated $590 billion in 1989 to $5.3 trillion in 2013. Between 2010 and 2013 alone, turnover increased by 35%. The trading volume in the currencies of the 12 Asia-Pacific jurisdictions that are the focus of this paper – Australia, China, Hong Kong SAR, India, Indonesia, Japan, Korea, Malaysia, the Philippines, Singapore, Thailand and New Zealand – have increased even more quickly over the past three years, at 56%. Trading activity on this scale, spread across this many countries and currencies, underscores the need for a smoothly functioning infrastructure and exceptional risk management processes.
Our paper is organised as follows. Part 2 will cover recent trends in FX markets in Asia and the Pacific, presenting salient facts from the BIS Triennial Central Bank Survey of foreign exchange and derivatives market activity, including growth, location of turnover for the major Asia-Pacific currencies as well as turnover by counterparty. Part 3 will shift attention to the evolution of institutional safeguards in FX trading, notably CLS Bank and its role in enhancing FX market resilience during the global financial crisis (GFC) in 2008–09, as well as the current situation and outlook for the evolution of institutional safeguards in Asia-Pacific. Part 4 will present a brief conjunctural analysis of the resilience of market functioning in Asian currencies over the past decade and a half, while Part 5 will then focus on a particular type of trade – the carry trade – which has at times accounted for a sizeable proportion of FX transactions in the Asia-Pacific currencies. Using newly developed measures of crowdedness and liquidity, we ask how prevalent the carry trade has been and what is the evidence concerning its contribution to instability in FX markets in the region, most notably during the global financial crisis and the more recent “taper tantrum” episodes in 2013.
2. Trends and patterns in FX trading in Asia-Pacific:
Evidence from the Triennial Survey
The 2013 BIS Triennial Survey gives a snapshot of evolving trends in the FX markets, and allows us to gauge how future economic expansion and possible institutional changes in the region might impact FX trading activity and risk exposures. Conducted every three years since 1989, the latest survey was completed in 2013. Some 53 central banks participated and collected data from about 1,300 banks and dealers about their FX trading activity during April. Turnover in more than 40 currencies was reported for spot, outright forwards, FX swaps, currency swaps and FX options transactions.
2.a Trading in Asia-Pacific currencies vs others
as for the New Zealand dollar. The three currencies of the Asia-Pacific economies (JPY/AUD/NZD) have gained share since 2010 relative to other advanced economy currencies, rising to 23%,4 9% and 2% of overall turnover, respectively, well above
the shares of the 2010 survey, as well as those of the survey of nine years earlier (2004). The 2010–13 growth rates of the yen, Australian and New Zealand dollars of 63%, 53% and 66% were well above overall growth rates of turnover, both for advanced economy currencies (34%) and for the global sample of currencies (35%).
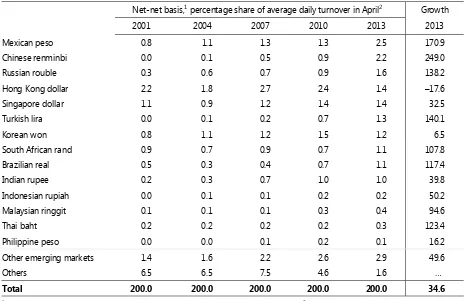
Similarly, turnover in many of the currencies of emerging market economies in Asia-Pacific have grown relatively rapidly (Table 2.2). The fastest growing currency is the Chinese renminbi: its turnover grew by 249% between 2010 and 2013, and it now comprises the second largest share of trading among emerging market currencies (after the Mexican peso). The Thai baht, Malaysian ringgit, Indonesian rupiah and Indian rupee all show very robust growth well above global averages at 123%, 95%, 50% and 40%, respectively. Similar to other emerging market economy (EME) currencies, growth in turnover has been far in excess of related country trade growth, consistent with the ongoing “financialisation” of currencies (McCauley and Scatigna (2011)). The one biggest single exception to robust growth has been the Hong Kong dollar, where a decline of 17.6% since 2010 likely reflects its displacement by the renminbi in a significant number of transactions in Hong Kong SAR.
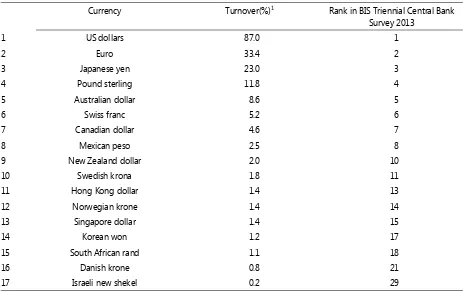
The triennial survey also shows that the US dollar (USD) remains the dominant global currency, as one of the currencies in more than 87% of transactions globally (Table 2.1). Asian currencies also overwhelmingly trade against the USD, though at proportions somewhat lower than the global average. For the bulk of this paper, when we focus on issues of liquidity and performance of FX trades in Asia, we will focus on the USD pairs of Asia-Pacific currencies. The potential for other currencies to rise as significant alternatives to the US dollar – a phenomenon which has not yet been observed in the BIS Triennial Survey – we leave for other research.
2.b Offshore trading
FX trading is increasingly taking place offshore, or outside the jurisdiction where a currency is issued. Indeed, the past few triennial surveys have shown that the offshore share of total FX transactions to be steadily rising across a broad spectrum of currencies. As a result, growth in EME currencies has been much more buoyant than the growth of FX transactions taking place in EME jurisdictions (71% vs 32%, from 2010 to 2013).
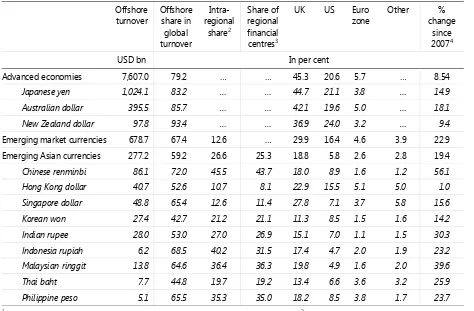
Table 2.3 lists the offshore trading of currencies in the Asia-Pacific alongside some comparable currencies. Among advanced economies, the Japanese yen, and Australian and New Zealand dollar have significantly higher offshore shares in global turnover than other advanced economy currencies on average, ranging between 83% and 93%. The growth in offshore trading since 2007 also outpaces advanced country currency averages as well.
4 Increases in Japanese yen trading relative to the 2010 survey were in part due to a surge in late
Among emerging market currencies, once again the renminbi stands out, with by far the largest share of offshore trading at 72%, or $86.1 billion per day. Growth in renminbi offshore trading since 2007 has been 56%, on an annualised basis. At the same time, the offshore trading of most other Asia currencies also grew significantly more rapidly than the average for emerging market currencies, at annual rates of 40%, 30%, 26%, 24%, and 23% for the Malaysian ringgit, Indian rupee, Thai baht, the Philippine peso, and Indonesia rupiah, respectively (Table 2.3). Overall, growth in the daily offshore turnover of Asian EME currencies contributed 35 percentage points to their total growth of 41% in the 2010–13 period (Ehlers and Packer (2013)).
Compared with other emerging market currencies, emerging Asian currencies are by far the most traded within their geographical region. More than a quarter of trading takes place both offshore and within emerging Asia. The renminbi is increasingly prominent in this respect: nearly two thirds of its offshore volume is in Asia.
But it is not just the renminbi that attests to a strong regional influence of trading in Asian currencies. Some 20–40% of turnover in the Korean won, Indian rupee, Indonesian rupiah, Malaysian ringgit and the Philippine peso takes place offshore and in Asia, well above the EM average for offshore, intra-regional turnover of 12.6%. The only exceptions here are the Hong Kong and Singapore dollars – which tend to trade outside Asia when they trade offshore – possibly because the associated jurisdictions are large offshore trading hubs, themselves with abundant turnover and liquidity across a range of currencies.
That said, the United Kingdom continues to serve as a major offshore trading hub for Asian currencies. Despite the presence of Hong Kong and Singapore, nearly one fifth of trading in emerging Asian currencies trading takes place in the United Kingdom, while the United States lags considerably at 8%. Hong Kong SAR and Singapore together account for 25.3% of offshore trading in emerging Asian currencies.
Non-deliverable forwards. London is noted in particular as a hub for trades in
non-deliverable forwards (NDFs), ie forward contracts which are valued based on movements in a currency’s exchange rate, but settled in US dollars. More than one third of $127 billion in daily NDF trading reported by the 2013 Triennial Survey took place in London. (Asian financial centres remain quite important for trading in NDFs in some currencies such as the Chinese renminbi and Korean won.) Not requiring transactions in a currency, NDFs allow investors to speculate in a currency even in the presence of capital flows and trading restrictions, and thus tend to take place offshore (McCauley et al (2014)). They account for one fifth of all forward trading, and have grown rapidly.
There is evidence that, for many currencies including those in Asia, the NDF market has dominated the deliverable venue for price discovery during periods of volatility, perhaps reflecting a tendency for global factors such as VIX to be incorporated more into the pricing of NDFs than that of deliverable forwards.5
Below, we will examine the time series of relative pricing in NDF vs deliverable
5 See Goyal et al (2013), Cadarajat and Lubis (2012) and Kim and Song (2010) for evidence in the case
forward markets as one of the indicators of liquidity in the currency during periods of turbulence in financial markets.
2.c Turnover by counterparty
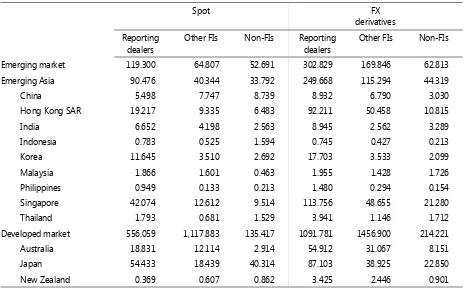
Given its rapid growth, the FX market clearly serves other functions than simply supporting international trade in goods and services, and cross-border international financial transactions in equities, bonds, and other instruments. A large share of trading is the result of dealers trading with one another during the day in an effort to control risk as they respond to order flow from incoming trades and provide liquidity for buys and sells. However, non-dealer financial institutions in Asia-Pacific jurisdictions account for more than one quarter of daily FX trading volume, both in advanced and emerging economies (Table 2.4). The implication is that many non-reporting banks, institutional investors and hedge funds use the FX market to either (a) hedge their outstanding exposure to foreign currency assets and liabilities and the expected cash flows generated by these positions, or (b) take on new risky foreign exchange exposures. In addition, a substantial share of non-dealer bank volume fulfils so-called “prime-brokered” activity whereby third-party financial institutions trade under the name and credit standing of their bank. Given the scale of the FX market and its reach across all countries with distinct regulations, it is essential that the market is not exposed to risks that could jeopardise its operations or the larger financial system. We turn to this issue in the next section.
3. Institutional safeguards in FX trading
3.a Risk and regulation in the FX market
At more than $5 trillion per day the global FX market has the largest volume of daily turnover of any financial market. It may be surprising that a market so large and so critical to the global economy is not subject to significant regulatory oversight and does not meet the reporting and transparency standards that are commonly found in organised markets for equities, futures, and even more recent financial innovations such as swaps and other derivative instruments. The explanation for this outcome is partly historical and a function of the market itself, and partly the result of recent innovations intended to mitigate and largely eliminate the major sources of systemic risk in FX trading.
dealers remain a significant part of the market.6 There are no set standard trading
hours, no centralised record of transactions, and no unique closing price as there is for a listed stock or futures contracts.
In their discussion of FX market structure and its evolution, King, Osler and Rime (2011) observe that “The vast majority of FX trading is essentially unregulated, in striking contrast to the extensive regulations in most equity and bond markets.”7
The authors point out that FX dealers could move elsewhere if threatened by regulation. But surely the design of regulations would be daunting, with every currency pair involving two countries and dealers from third countries representing banks headquartered in still other countries. As a result, regulations that are familiar in some markets are absent in the FX market. Short-sale restrictions, for example, would have no meaning in FX as the purchase of one currency is simply the sale of another. Front-running of customer orders is not illegal, but it is heavily discouraged by market convention and best practices. So-called FX Committees in six cities act as self-regulatory organisations to establish standards for traders, relationships with customers, and so on.8
That there is minimal regulation implies that there is minimal reporting by banks to regulatory agencies. Data pertaining to specific trades between Bank A and Financial Institution B or Customer C are private information and are therefore not reported to an exchange or central bank. As a result, most research on currency trading relies on proprietary data sets and sometimes reflects data on indicative quotes rather than actual transaction prices, and may reflect only a narrow segment of the market.
The GFC in 2008–09 provided the impetus for policymakers in all countries to reassess their oversight of all financial institutions and marketplaces. In general, the new regulations call for higher capital requirements at banks and greater reliance on the use of central counterparties (CCP) to make trading in certain derivatives more transparent and they also rely on CCP margin requirements and marking to market to lessen the ongoing risks in derivative positions.
Importantly, outright forward and swap transactions (which together accounted for 55% of global FX trading in 2013) are exempt from the CCP mandate which the Dodd-Frank Act imposes on most derivative transactions. The US Treasury Department, in coordination with other US regulators and other countries, approved the exemption in November 2012. In their proposal brief, the Treasury referred to a number of unique factors that limit the risk in FX swaps and forward markets compared with other derivative markets.9 Among these factors, the Treasury cited
the shorter duration of FX swaps and forwards (noting that roughly 68% of the market matures in one week or less, and 98% matures in one year or less). And, in contrast to other derivatives, FX swaps always require both parties to physically exchange the full amount of currency on fixed terms that are set at the outset of the
6 See 2013 BIS Triennial Survey, Table 26. The data show that voice execution accounts for 34.5% of
spot turnover while electronic execution accounts for 63.8%. Voice accounts for a higher percentage in outright forwards, FX swaps, currency swaps, and 62.0% for FX options.
7 Exchange-traded FX futures and options are an exception to this general observation.
8 The six cities are London, New York, Tokyo, Toronto, Sydney and Singapore.
contract. Market participants know the full extent of their own payment obligations and their exposure to their counterparty throughout the life of the contract.
These features could be moot were it not for one last feature of the foreign exchange market which the Treasury described as a “well-functioning settlement process”, in reference to CLS Bank. The CLS Bank is undoubtedly the most critical innovation in the last 20 years to touch the infrastructure of the foreign exchange market, especially with respect to safeguarding the market and mitigating the risks of trade settlement. In the remainder of this section we review the historical events leading up to the founding of CLS Bank, together with its structure and activities. Then we gauge its presence in different products, countries and currencies, and discuss what risks remain with special reference to the Asia-Pacific region.
3.b Historical background to the founding of the CLS Bank
For most of its history, the nature of the foreign exchange market dictated that FX transactions were to be settled on a bilateral basis. Netting systems reduced the gross amount of funds necessary to flow between counterparties, but settling a transaction still required counterparty A to pay away funds in one currency to counterparty B without complete assurance that counterparty B would deliver its leg of the transaction. This possibility became a reality one day in 1974 when Herstatt Bank received Deutsche marks at its offices in Cologne, Germany, but was subsequently closed down and forced to cease operations by German banking regulators, and was thus unable to deliver US dollars to its counterparties once US banks opened for business. This form of credit risk, known as delivery risk (but naturally enough quickly enshrined as “Herstatt risk”) resulted in a total loss of principal for Herstatt’s counterparties.
Soon afterwards, market participants and regulators began searching for a solution to what could only be a growing problem given the ongoing globalisation of markets and financial transactions. Working through the BIS, in 1996 the Committee on Payment and Settlement Systems issued a comprehensive report on “Settlement risk in foreign exchange transactions”. The so-called Allsopp Report assessed the relative merits of delivery-versus-payment (DVP) and payment-versus-payment (PVP) settlements systems and two potential payment-versus-payment/receipt relationships: a guaranteed receipt system (where counterparties are guaranteed that they will receive what they are owed if they fulfil their own settlement obligation) and a guaranteed refund system (where counterparties are guaranteed that their settlement payment will be cancelled or returned if their counterparty fails to pay what they owe). The report did not seem to take a stand on which settlement system would best serve the foreign exchange market. In their words, “While any of the various settlement mechanisms described above could potentially eliminate FX settlement exposures, each has particular strengths and weaknesses that should be considered.”10
The report did, however, come down clearly in favour of private sector rather than public sector provision of enhanced settlement services. Among the reasons given were the need for ongoing innovation, pressure to provide cost-effective arrangements and private sector methods for controlling risk. Having said this, the
report noted the important role for central banks in promoting the safety and soundness of their domestic financial institutions needed to support a multicurrency settlement system. In addition, the Report expressed concern as to the speed of progress and the need for central banks to “induce rapid private sector progress”. Given that the Herstatt Bank failure occurred 22 years earlier, the Report noted that “Among the impediments at the individual bank level is a belief held by some banks that the probability of an actual settlement loss is too low to justify the cost of reducing exposures.”11
Not long after the Allsopp Report was issued, CLS Bank International was founded in 1997 and commenced operations in 2002. CLS Bank is an Edge Act corporation located in New York and is regulated and supervised by the US Federal Reserve. The Federal Reserve also acts as the lead overseer of CLS Bank in a cooperative oversight arrangement with the central banks whose currencies are settled by CLS Bank. CLS Bank is a subsidiary of CLS Group Holdings AG based in Switzerland, which itself is owned as of June 2014 by 76 shareholders representing many of the world’s largest financial institutions from 23 countries.
In a little over a decade, CLS Bank has grown to become the “sole global multi-currency settlement system of its kind, offering both liquidity savings and settlement risk mitigation across all major currencies”.12 In July 2012, the Financial
Stability Oversight Council (FSOC), established under the Dodd-Frank Act, designated CLS Bank as a systemically important financial market utility (SIFMU) based on several criteria that attest to the volume of transactions processed by CLS Bank, but also to its critical role in the interconnectedness of the FX market and the costs and risks to financial stability if the ability to rely on PVP settlement for major FX transactions were jeopardised.13 Being classified as a SIFMU, CLS Bank is subject
to enhanced regulatory oversight by the Federal Reserve Bank and other market regulators.
3.c Basic activities and dimensions of CLS Bank
CLS Bank, taking its name from a so-called Continuous Linked Settlement process, operates a payment-versus-payment (PVP) settlement service which mitigates settlement risk in the FX transactions of its Settlement Members and their approved customers (known as Third Parties). Although the details of this global operation are complex, the basics of the PVP settlement process are straightforward.14 CLS Bank
receives detailed information from both counterparties about their FX transaction and then matches the two legs of the transaction scheduled for delivery on date T. On the settlement date, T, during a window of several hours, CLS Bank receives
11 The Allsopp Report (1996), p 27.
12 Financial Stability Oversight Council (2012, p 157).
13 In total, the FSOC designated eight SIFMUs including the Clearing House Payments Company
(CHIPS) and the Depositary Trust Company (DTC).
14 The main text offers a stylised description of a CLS transaction, which is not intended to capture the
currency A from one counterparty and waits for the receipt of currency B from the second counterparty. Once both legs of the trade have been received and CLS has verified that all details match, CLS releases the funds and pays out to both counterparties. Once settlement has been concluded, it is irrevocable. If counterparty B cannot deliver due to failure, CLS suspends the member and returns the full amount of principal to counterparty A and avoids settlement risk (or what the Allsopp Report labelled a “guaranteed refund system”). The transaction between A and B is left to settle in some other manner.
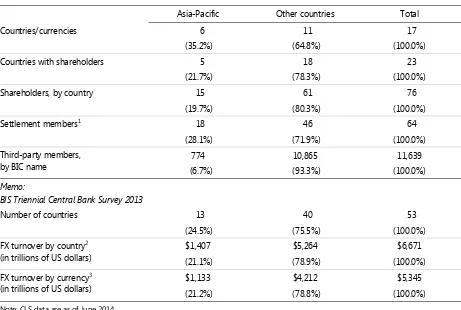
At its launch in 2002, CLS Bank settled transactions for seven currencies on behalf of 39 settlement members. At present, there are 17 CLS-eligible currencies including nine of the top 10 currencies by volume from the 2013 Triennial Survey, as well as other currencies with smaller turnover (see Table 3.1). Collectively, these 17 currencies accounted for 93.7% of global turnover in the 2013 survey although this overstates the potential reach of CLS because both currencies as well as both counterparties in a trade must be CLS-eligible to utilise CLS. As of June 2014, there are 64 settlement members and more than 11,000 third-party members. And while members have the right to settle eligible transactions through CLS, they are under no obligation to do so.
As shown in Graph 3.1, total CLS trading volume across all eligible currency pairs and products has increased substantially since 2007.15 The average number of
daily transactions hovered in the 300,000–400,000 range in 2007 and expanded to reach 1.25 million per day in the first half of 2013 before declining to about 1 million per day in the first half of 2014. In the interim, the volume of transactions experienced a slight decline associated with the GFC, and also a temporary burst of volume in the first half of 2013 largely as the result of a dramatic jump in JPY trading associated with the change in Japanese monetary policy.16 Assuming that
the jump in JPY trading is a one-time event, CLS trading volume appears to be stable or slightly rising since 2011.
The average value of CLS trades was roughly $3.5 trillion per day in 2007 and then rose to more than $4 trillion per day before dropping to about $2.8 trillion per day in December 2008. This is a far greater decline than observed in the volume of trades per day during the GFC. Since then, the value of trades has gradually drifted upwards to a little over $5 trillion per day in the first half of 2014. We do not observe as pronounced a rise in the value of trading in the first half of 2013 compared with the spike in transaction volume.
It is critical to note that CLS processes both sides of a trade and includes both sides in its trading value calculation. Therefore to make CLS value data consistent with BIS survey turnover data, we divide the CLS settlement values by two. To begin to illustrate the importance of CLS to the FX market, consider the Triennial Survey estimate for the global value of daily FX trading in April 2013, which was $5.3 trillion. CLS reported $5.0 trillion as their average daily value settled in April 2013. Dividing the CLS figure by two, in gross terms, CLS would appear to settle around $2.5/$5.3 = 47.2% of global FX trading. Later in this section, we will provide
15 The data represent matched trades rather than settled trades.
16 The daily volume of USDJPY transactions processed by the CLS Bank jumped from about 100,000 in
additional detail to explore why the resulting implied share of global FX trading that remains subject to settlement risk (100%–47.2%, or 52.8%) is an overestimate.
Despite the considerable progress made by CLS Bank, as well as other institutional measures to reduce FX settlement risks, in 2013 the Basel Committee on Banking Supervision (BCBS) concluded that “substantial FX settlement-related risks remain due to the rapid growth in FX trading activities.”17 Adding that many
banks are prone to underestimate these risks and that their impact can be outsized during periods of market stress, the report called for continued efforts to reduce or manage FX settlement risk. “In particular, the efforts should concentrate on increasing the scope of currencies, products and counterparties that are eligible for settlement through PVP arrangements.”18 This leads us to examine how much FX
settlement risk may remain with special reference to the Asia-Pacific region.
3.d Trading, CLS and PVP in Asia-Pacific (estimates of risk mitigation)
In this section, we offer estimates on the availability and utilisation of CLS and other PVP settlement systems in Asia-Pacific. One way to benchmark the CLS footprint in the Asia-Pacific region is based on the turnover data in the 2013 BIS survey. In Table 3.2, the data indicate that 13 Asia-Pacific countries account for slightly over 21% of all global FX turnover whether we measure in terms of trading location or the currencies traded. By several measures, Asia-Pacific countries appear to be well represented in the CLS community. In terms of the governance of CLS, of the 76 shareholders of CLS Group Holdings, 15 are from the Asia-Pacific region. CLS shareholders are headquartered in 23 countries including five in the Asia-Pacific region. In term of settlement, there are six Asia-Pacific currencies among the 17 CLS-enabled currencies. There are 64 settlement members including 18 from Asia-Pacific. And finally, CLS settlement services extend to a large number of third-party members including more than 770 from the Asia-Pacific region or about 6.7% of the total. By comparison, three countries (the United States, United Kingdom and Luxembourg) tally more than 7,000 third-party members. These countries are home to many investment management companies who may elect to establish third-party membership for individual funds, each of which may stand as separate legal entities. Apart from third-party membership, in a general sense, the data suggest that Asia-Pacific countries have a presence in CLS on a scale that reflects their activity in the global FX market.
In addition, various Asia-Pacific countries have developed PVP systems, or alternative risk mitigation measures to address delivery risk in their home currencies that are not presently CLS-enabled. The Philippines uses a real-time gross settlements (RTGS) system with PVP for Philippine peso vs US dollar trades. In 2006, Malaysia instituted the first cross-border PVP link in the region with the Hong Kong Monetary Authority (HKMA) for settling ringgit-US dollar trades. In 2010, Indonesia established a similar arrangement with the HKMA for settling rupiah-US dollar trades. The Bank of Thailand is exploring a link with the HKMA to enable settlement
17 Basel Committee on Banking Supervision, “Supervisory guidance for managing risks associated with
the settlement of foreign exchange transactions”, February 2013.
of baht-US dollar trades.19 Notably, once an HKMA link is established, settling trades
against the EUR, HKD, and CNY would become feasible. And even though India presently does not have a PVP system or a link to one in place, the Reserve Bank of India relies on a detailed system of margin, lines of credit and penalties in the event of a shortfall to reduce settlement risk in rupee-US dollar trades.20
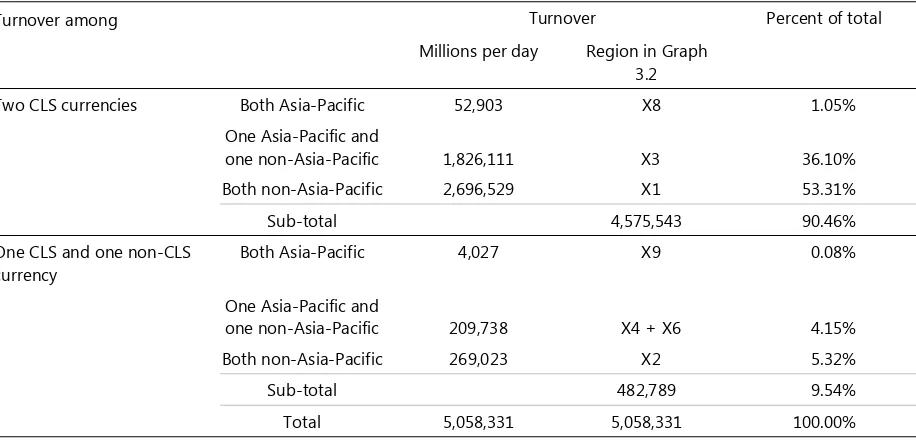
To examine the potential use of CLS and PVP more closely, we obtained disaggregated turnover data from the 2013 BIS Survey for a 40 x 40 currency matrix including all 17 CLS-enabled currencies and 23 other currencies. A diagram of the matrix is shown in Graph 3.2. Currency combinations with positive turnover data are indicated by the numeral “1.” Rows and columns are arranged to list the non-Asia-Pacific currencies first (11 CLS-enabled currencies followed by 16 others) and the Asia-Pacific currencies next (six CLS-enabled followed by seven others). Only the currency pairs in regions X1, X3 and X8 are CLS-eligible. Other currency pairs (USD/INR, USD/MYR and USD/PHP) that offer PVP settlement are marked separately. Out of a maximum of 780 unique cross-rates in the matrix, positive turnover data are available for 273 pairs ranging from $1.288 trillion per day for the EUR-USD pair to very small turnover numbers for the more obscure pairs. The disaggregated data allow us to develop more refined estimates of the share of trading that may benefit from risk mitigation through PVP settlement in different segments of the FX market. Tables 3.3 and 3.4 show a sample of these results.
On a global level, turnover among all pairs of the 17 CLS currencies measures 90.46% of global turnover. This estimate is slightly smaller than the 93.7% estimate given earlier based on the sum of trading in all 17 CLS currencies, because it excludes trades involving one non-CLS currency that cannot be settled through CLS Bank. The data show that slightly greater turnover, 92.93%, is CLS-eligible among 11 Asia-Pacific currencies than among the 27 non-Asia-Pacific currencies where the share is 90.93%. One reason for this difference is the vehicle currency role played by the USD against many non-CLS currencies and as well as FX turnover between the EUR, GBP, CHF and others against many non-CLS currencies.
Because of greater time-zone differences, Herstatt risk can be greater between Asia-Pacific currencies and currencies in Europe and North America. Therefore, turnover in these pairs may hold special interest. The BIS data suggest that, for trades between Asia-Pacific currencies and all others, a somewhat smaller share of turnover (89.79%) is in CLS currencies compared with 90.43% for trades between non-Asia-Pacific currencies and all others.21 However, taking into account that IDR,
MYR and PHP trades against the USD can make use of separate PVP arrangements, Asia-Pacific currencies appear to have a larger share of turnover (92.56%) where risk mitigation is available compared with the share (91.59%) for non-Asia-Pacific currencies.
19 “Payment Systems Report”, Bank of Thailand, 2012, p 25. The link became operational on 28 July
2014.
20 See Committee on Payment and Settlement Systems (2011, p 181). In addition, the Clearing
Corporation of India Limited (CCIL) is a third-party member of CLS that offers settlement services in CLS-enabled currencies to participating banks (fourth parties) as a settlement aggregator. Ibid at p 183.
21 The share is 89.70% for Asia-Pacific currencies versus only non-Asia-Pacific, or X3/(X3+X4+X6+X7)
Overall the BIS data confirm that a large share of global FX turnover flows through currency pairs that are eligible for risk mitigation through CLS or other PVP arrangements. The data also suggest that the share eligible for risk mitigation is slightly larger for trades among Asia-Pacific currency pairs, or pairs involving an Asia-Pacific currency compared with the analogous figures for non-Asia-Pacific currencies. Trades in IDR, MYR and PHP versus the USD account for more than 28% of turnover for non-CLS currencies in Asia-Pacific versus currencies in later time zones. Thus, the separate PVP arrangements by the central banks of Indonesia, Malaysia and the Philippines could, if widely used, play an important role in supplementing the risk mitigation services offered by CLS Bank.
3.e Risks that remain despite CLS and other PVP settlement systems
The figures in Table 3.3 are estimates of the upper bound on the percentage of FX turnover that could be settled through CLS or other PVP settlement systems. However, it is difficult to make the linkage between these estimates and (a) the share of turnover that actually utilises risk-mitigating settlement, and (b) the share of turnover that remains subject to settlement risk. Simply because trades could be
settled using a risk-mitigating system does not mean that counterparties can or will
take the option to use it. And, perhaps surprisingly, even if a trade does not use CLS or another PVP system, the trade may not be subject to settlement risk.
The first part of this explanation is apparent. Only counterparties who are settlement members or third-party members can exercise the option to settle through CLS Bank.22 However, not utilising CLS need not imply that a trade is
subject to settlement risk. Consider a EURUSD trade between Bank A and Company B. If B maintains its EUR and USD accounts within Bank A, there is no need for the bank to transmit funds from one bank to another (so called “on-us” settlement). Alternatively, consider a USDJPY forward contract between Bank A and Hedge Fund C. The bank could be aware that the hedge fund intends to cash settle the forward contract and not take delivery. And so there is no need for PVP settlement, and also no settlement risk.23 In the same fashion, trades between two non-CLS-eligible
currencies would not be subject to settlement risk if they were settled internally within a single bank, or subject to cash settlement rather than delivery.
In 2013, CLS Bank started its own survey to assess more accurately the share of FX turnover that members route through CLS and the extent to which other settlement methods are utilised.24 While a final version of the survey has not been
released, it appears based on a preliminary draft of the report that close to 55% of trading activity in CLS-eligible currencies flows through CLS.25 Most of the
remainder benefits from risk mitigation through on-us settlement or bilateral
22 The central banks in Indonesia, Malaysia and the Philippines have their own systems for vetting
access to their PVP systems.
23 Credit risk between the counterparties still remains. In the forward contract example, the
counterparty could elect to cash settle regardless of whether the contract serves a speculative or hedging purpose.
24 See Clark, “CLS Expansion will be key to EM currency growth”, FX Week, 19 July 2013.
25 We thank Dino Kos and Rachael Hoey of CLS for allowing us to review a preliminary version of the
netting, leaving a little over 10% subject to gross non-PVP settlement.26 In this case,
10% of roughly $4.5 trillion, or $450 billion, in daily trading leaves a large potential exposure. For non-CLS currencies, clearly none settle through CLS but, as we have seen, a small amount settles through other PVP systems, much more settles on-us, and close to half benefits from bilateral netting. But this still leaves more than one third of non-CLS currencies to settle through a gross non-PVP process. In this case, one third of roughly $500 billion, or $167 billion, in daily trading involving non-CLS currencies also represents a substantial potential exposure.
Combining these two figures we arrive at $617 billion as a rough estimate of daily FX turnover subject to settlement risk through a non-PVP process. This estimate excludes daily turnover in currency swaps and FX options, estimated at $390 billion in 2013, that are not CLS-eligible products.27 In total, perhaps as much
as $1,000 billion in daily FX turnover may be settled at present without the benefit of some type of risk mitigation.
Looking into where settlement risk remains, among the non-CLS currencies, our own analysis based on Graph 3.2 reveals that among currency pairs with an Asia-Pacific component the USD/CNY rate shows the highest turnover at $112.68 billion/day. And for non-Asia-Pacific pairs, the USD/RUB is the largest at almost $79 billion/day. Early in 2014, press reports predicted that the rouble was likely to become CLS-eligible by year-end.28 And in 2012, China indicated that it was
in the process of developing an advanced payment system that would support PVP of the renminbi against foreign currencies.29 In a recent interview, David Puth, the
Chief Executive Officer of CLS, was quoted as saying that discussions with the jurisdictions of number of other currencies were “well under way”.30 So indications
are that additional currencies are under active consideration for the CLS system.31
Despite the progress to date and the likely progress ahead, it is important to keep in mind a succinct comparison offered by the Allsopp Report in 1996. The CLS Bank has been engineered to offer a “guaranteed refund system” rather than a “guaranteed receipt system”. Thus, in the event that a CLS third-party member fails (eg Lehman Brothers), the trade may be rescinded in advance (leaving the counterparty to make other settlement arrangements). Or, if the trade is not
26 Presumably some portion of this activity is forward contracts that cash settle. While the initial setup
costs for CLS membership could deter some new members, the marginal cost of using CLS is very small. (Banks averse to the initial costs of CLS membership also have the option to become third-party members). In its interim financial report for the six months ending 30 June 2013, CLS reported revenues of £86.8 million. With more than 1.25 million matched trades per day, revenue to CLS is less than $1.00 per trade.
27 Currency swaps and non-exchange-traded FX options will be subject to risk mitigation through CCP
arrangements as required by the Dodd-Frank Act. Those regulations are in the process of being drafted.
28 See E Szalay, “CLS set to add Russian ruble in November, source says”, FX Week, 12 February 2014.
This has since been deferred.
29 See Committee on Payment and Settlement Systems, “Payment, clearing and settlement systems in
China”, 2012, p 44.
30 See K Alys, “Spotlight on: David Puth, CLS”, FX Week, 22 October 2012. Brazil, Chile, Thailand, Russia
and China were mentioned in the article.
31 In its “Report on Payment Systems, 2013”, the central bank of Hungary discusses a letter of intent
rescinded in time, the settlement member responsible for the third party will be left to meet their CLS obligations. A guaranteed receipt system, such as a regulated futures exchange, would have detailed margin requirements and function like a CCP, which is not the case for CLS Bank.
Finally, as the Allsopp Report also anticipated, a multicurrency settlement mechanism (such as CLS) might also create a new source of systemic risk despite its risk-reducing potential. As the Report phrased it: “a disruption in the settlement of one currency could disrupt the settlement of all other linked currencies. … The possibility of not receiving the currencies they purchased on time could lead participants in guaranteed refund systems to hold back their payments at times of market stress, thereby increasing the total number of failed settlements” (p 25). In naming the CLS Bank as a systemically important financial market utility, the FSOC built on many of the same points. Their report (2012, p 157) noted in part that the “…CLS Bank’s expansion will reduce overall risk but also concentrate the risk associated with a potential disruption to or failure of CLS Bank.”
4. FX market behaviour during periods of high volatility
Institutional safeguards are likely to be most important during times of rising and high volatility in markets. In the following we briefly review the movement of exchange rates and metrics of FX market liquidity in Asia-Pacific over the past 10–15 years, paying particular attention to market characteristics during periods of high volatility, most notably the global financial crisis of 2008–09 and the “taper tantrum” of 2013. The latter episode of volatility occurred after the Federal Reserve indicated its intention to begin “tapering” the degree of quantitative easing, conditional on economic stabilisation proceeding as expected. We also present some event study analysis to assess the impacts of the tapering announcements in 2013.
4.a Literature on FX market impacts of the GFC and “taper tantrum”
A characteristic of the global financial crisis was the substantial appreciation of the US dollar when the crisis deepened, even in response to negative US-specific macroeconomic shocks which in normal circumstances would have led to US dollar depreciation (Fratzcher (2009)). Not surprisingly, fundamentals played a role in determining which countries’ currencies depreciated the most in response to financial stability shocks. In particular, those countries with large current account deficits and fewer FX reserves experienced significantly larger depreciations against the US dollar. However, exposure to the risk appetite of US investors was another important factor. The currencies of countries in which US investors held relatively large portfolio investments consistently depreciated more. Clearly, financial openness and integration increased the vulnerability of countries to external shocks.
a shortage of US dollar funding in global markets during the crisis (McGuire and von Peter (2009)).
Another period of volatility in FX markets followed heightened expectations of changes to US monetary policy in 2013 and early 2014. In particular, big depreciations in a large number of emerging market currencies were associated with tapering announcements by Federal Reserve Chair Ben Bernanke (Aizenman et al (2014)). The impact of the tapering news differed according to country fundamentals, but in a manner different from that noted for the GFC: ie the currencies of countries with current account surpluses, high international reserves and low debt burdens depreciated more than other currencies. The authors interpret this result as consistent with fragile economies having built up less exposure to financial flows, or “hot money” during earlier periods of relatively high rates in EMEs (and quantitative easing by the Federal Reserve). That said, while the immediate response at the daily frequency was most evident in the exchange rates of more robust economies, by the end of 2013, the currencies of fragile economies had experienced the most depreciation, as markets eventually reflected the adverse global implications of higher rates.
Other studies focusing on the exchange rate depreciation over the entire summer of 2013 also point towards a correlation of local currency depreciation and financial fragility. Eichengreen and Gupta (2013) show a positive relation of depreciation with deterioration of the current account and appreciation of real exchange rates during the earlier three years. The authors also document that the currencies of countries with larger financial markets depreciated more between April and September 2013, indicative that “large markets are more prone to the effects of liquidity retrenchment.” On the other hand, more conventional measures of vulnerability such as public debt and budget deficits had little relation to the degree of currency depreciation during the taper tantrum.
4.b FX rate movements
In the following section, we review the bilateral exchange rates of the 12 Asia-Pacific currencies examined in Part 2 versus the US dollar. In the left-hand panels of Annex Graph 1, dramatic depreciation versus the US dollar is observed across a large cross-section of currencies during the peak of the financial crisis in 2008, the most for the Australian and New Zealand dollar at 60%, and 25–50% for the Indian rupee, the Indonesian rupiah, the Korean won and the Philippine peso. Somewhat more modest depreciations were observed for the Malaysian ringgit, the Thai baht, and Singapore dollar. As the Chinese renminbi does not float freely against the US dollar, it was rather unaffected during the crisis. Moves in the Hong Kong dollar, which runs a currency board, were also miniscule by comparison. The Japanese yen, often a safe haven currency, depreciated 10% in early 2008, but otherwise tended to appreciate against the dollar over the period.
of currency flexibility versus the dollar, such as China and Hong Kong, significant impacts were not detected.
Table 4.1 reports FX rate changes and presents formal tests of significance with regard to the announcement effects of three major Federal Reserve announcements, suggestive either of future tapering or confirming the tapering of its asset purchase programme, on 22 May, 19 June and 18 December 2013.32
Indeed, all 12 of the currencies depreciated against the dollar on a net basis on the day after the tapering announcements (nine significantly so in a statistical sense), with nine of the 12 currencies having depreciated on each of the three days.
Interestingly, many high-turnover currencies, as measured by the triennial survey, depreciated the most sharply, with statistically significant depreciations ranging in aggregate on tapering announcement dates from lows of 0.03% and 0.24% (the HKD and RMB) to highs of 4.3%, 3.4% and 3.3% for the NZD, KRW and AUD, respectively. Currencies of seven out of 12 jurisdictions experienced a greater than 2.3% depreciation versus the US dollar on aggregate over those three days. The Indonesian rupee and Indian rupiah, which had by far the largest depreciation during the seven months covering the three announcements (May 22–December 18), had rather small reactions (– 1.9% and –0.6%) in total – for the three days after the actual key announcements themselves.
4.c Measures of FX market liquidity
Bid-ask spreads. The relative bid-ask spread is a common measure used to assess
liquidity in FX markets (Karnaukh et al (2014)). Here we use daily bid and ask and mid-quote prices from Datastream Thomson Reuters. With similar data, Rime and Schrimpf (2013) document a decline in average bid-ask spread for currencies of emerging market economies and, at least by this metric, convergence in liquidity conditions of EM currencies to those of advanced countries.
Indeed, for many of the EM currencies in Asia-Pacific that we are examining, average bid spreads show a trend decline in reported relative bid-ask spreads over the past 15 years (with the exception of the Malaysian ringgit, where the data are available only from 2004 and started at relatively low levels) (Annex Graph 2, left-hand panels). Reported spreads for the advanced economy currencies of the Japanese yen, Australian and New Zealand dollars showed some decline between in the early 2000s, but have been mostly stable since 2004. Around the global financial crisis, it was principally the Indonesian rupiah that shows a rise in reported spreads that was notable over the 15 year time frame (to nearly 2%, although it should be acknowledged that similarly large rises were apparent in 2004 and 2006 as well.)
Rises in bid-ask spreads over the later period of market turbulence in 2013 were principally in Indonesia and Philippines (Annex Graph 2, right-hand panels).
32 Nearly all of the daily series are all taken at the Asia close (NDF series were taken from the London
For the rupiah, spreads rose by a factor of nearly four, from 10 basis points to around 40 basis points, while Philippine peso spreads saw a smaller increase of roughly three times to 10 basis points over the later period. Event study evidence does not suggest an outside reaction of spreads after the specific tapering announcements, however, in either of these or the other currencies under investigation (Table 4.2).
Implied volatilities. Implied volatilities, which capture the cost of insurance
against sharp moves in exchange rates, rose quite dramatically during the GFC in 2008 for all of the currencies examined (Annex Graph 3, left-hand panels). Implied volatilities also rose during the 2013 period, particularly in the second and third quarters, but not to the peaks of the GFC (Annex Graph 3, right-hand panels). Event study evidence indicates that implied volatilities rose significantly after at least one of the tapering announcements in nine out of the 12 currencies (Table 4.3). In contrast to the depreciation of exchange rates, in which a number of the sharpest moves were concentrated in the advanced economy currencies with high turnover (AUD, NZD), the most pronounced rises in implied volatility tended to be currencies of emerging Asia, in particular the Indonesian rupiah and Philippine peso (3.1% and 2.9%, respectively). However, currencies in regimes which allow less flexibility versus the dollar – the Chinese renminbi and Hong Kong dollar – did not have a significant rises in implied volatility.
Realised volatilities. Realised volatilities have been found to correlate well
with other metrics of liquidity, and have the advantage of being available over longer time periods and for more currencies (Karnaukh et al (2014)). Annex Graph 4 (left-hand panels) reports time series for the monthly averages of the absolute value of daily changes to interest. The volatility of most currencies against the dollar hit their peak during the GFC but, by this measure, the Indian rupee clearly suffered its most illiquid period during the 2013–14 bout of market turbulence, with realised volatilities rising well above the 2008–09 period. The Philippine peso, Thai baht and Singapore dollar’s realised volatilities also rose considerably in 2013, particularly in the second and third quarters (Annex Graph 4, right-hand panels).
Deviations from covered interest parity. It has been well established in a
number of papers (eg Baba and Packer (2009a, 2009b)) that covered interest parity did not hold in a number of markets around the time of the financial crisis in 2008–09. In fact, reflecting well known US dollar shortages, the Federal Reserve arranged swap lines with numerous other central banks to counteract dollar shortages, and deviations subsequently declined as confidence returned. Deviations increased again with the European sovereign crisis, but returned to close to pre-crisis levels for the most part. Some Asia-Pacific currencies also showed deviations from CIP versus the dollar during the crisis (Annex Graph 5), which was attributed more to tight funding conditions than to counterparty risk (Genberg et al (2011)).
global financial system was at stake, were not a factor in the region during the more recent period of volatility.
Forward premium gap. Forward FX rates from onshore markets can at times
mislead. In many currency markets, differences between deliverable forward and (offshore) non-deliverable forward (NDF) rates can emerge, reflecting limits to arbitrage, particularly in stressed market conditions (McCauley et al (2014)).
Indeed, the deliverable forward-NDF premia widened sharply for a number of Asia-Pacific currencies during the global financial crisis, when the offshore NDF rate depreciated by more than the onshore forward rate (represented by negative differentials for five currencies, shown in Annex Graph 6, left-hand panels). Though not by as much, the differentials also widened for certain currencies at points during the May–December 2013 taper tantrum period (Annex Graph 6, right-hand panels). Particularly affected were differentials in the Indonesian rupiah and Philippine peso, falling below –4% and –1% at their troughs, respectively, with statistically significant falls in the differential evident around the key announcement dates of the taper tantrum (Table 4.5). The forward premia of the Indian rupee also fell below –1% during the taper tantrum period (though not in response to announcements), but large offshore-onshore differentials were not as evident for the Chinese renminbi and Korean won. The coincidence of (forward) currency depreciation in the NDF market with a widening of negative premium is consistent with the stylised fact found in other studies that the offshore NDF market tends to lead the deliverable market in times of market stress.
It is also worthy of note that daily turnover – for which data are available for the Indonesia rupiah, Indian rupee and Philippine peso during 2013 – increased sharply in the days after each of the three tapering announcements in the case of the Indonesia rupiah and Philippine peso. Excepting China, these are the two currencies among the group in Table 4.5 that have the largest ratio of trading taking place offshore; these are also the currencies where the offshore-onshore forward differentials responded the most to the tapering announcements. An increase in volume at times of market turbulence is consistent with both turnover and prices reacting to the arrival of new public information, as suggested in the findings of Galati (2000).
4.d Market indices
5. Carry trades in the Asia-Pacific Region and crowdedness
Carry trades have attracted the attention of investment professionals, researchers and government policymakers throughout most of the modern floating exchange rate period. Carry trades in the FX market take long positions in one or more high-yielding (target) currencies financed by short positions in one or more low-high-yielding (funding) currencies. The strategy is profitable when the target currency does not depreciate by more than the interest differential. Indeed, it is not uncommon for the target currency to appreciate, thereby producing an exchange rate gain for the investor in addition to the yield differential. There is strong evidence that currency carry trades have been profitable for the last 20 years or more.33 Nevertheless,
questions remain as to whether carry trade profits when calculated are largely offset by trading costs, or whether they are simply a reasonable compensation for attendant risks, or instead represent real economic profits in excess of associated risks.34
The carry trade is of special interest for the Asia-Pacific region for several reasons. First, for most of the last 20 years, the region has been home to one traditional funding currency (JPY) and several traditional target currencies (AUD, NZD, INR and other EM currencies). Thus, the region may be prone to the macroeconomic and financial market side effects traditionally associated with the building-up and unwinding of carry trade strategies (eg see Cucuru, Vega and Hoek (2010)). Second, at least two rapid unwinds of carry trades have involved Asia-Pacific currencies. In 1998, the JPY (even at that time an important funding currency), depreciated to nearly 146 USDJPY in August but ended the year around 114. Included in that move was a 14% appreciation over the space of two days, October 6–8, the yen’s largest two-day move since the beginning of the float in February 1973. In a similar vein, but over a longer time horizon, from 2000 until the summer of 2008, the JPY (still a funding currency) depreciated against the AUD from roughly 60 AUDJPY to over 107 AUDJPY producing substantial gains for carry traders who were long the AUD. However, after the Lehman Brothers bankruptcy in September 2008, carry traders unwound their positions quickly. The AUD dropped below 60 AUDJPY by late October 2008, resulting in losses for carry traders unable to close out their positions fast enough.
Recently some analysts have pointed to the performance of the CNY carry trade against the USD as a funding currency, which has raised concerns in some quarters that another large unwind could be looming.35 As noted in the previous section, the
prospects of earlier or faster than expected Fed tapering contributed to greater volatility in many FX markets; this is in turn may have resulted in a faster and more
33 See, for example, Gyntelberg and Schrimpf (2011).
34 Burnside et al (2006) argue that market frictions such as bid-ask spreads and price pressure that are
an increasing function of order size are sufficient to greatly reduce the profitability of carry trades and push the marginal Sharpe ratio toward zero. Research by Burnside et al (2010), Brunnermeier, Nagel and Pedersen (2009) and others supports the view that carry trade profits reflect a peso problem or crash risk premium. Mancini, Ranaldo and Wrampelmeyer (2013) find evidence of systematic variation in FX market liquidity that could contribute to carry trade returns. Bilson (1981) produced the first rigorous, out-of-sample test of a carry trading strategy and concluded that the performance was too good to be consistent with credible risk premiums.
damaging unwind of carry positions. Risk can be compounded because carry positions are easily levered and the overall size of aggregate positions is difficult to judge beforehand. Beyond the risks that fall on private investors, Curcuru, Vega and Hoek (2010) point out that risks associated with excessive exchange rate and asset price volatility as well as increased stress on the banking system stemming from loan defaults impact the broader economy, which makes the carry trade a concern for financial regulators and policymakers.
5.a Carry trade returns and risks
By construction, a carry trade targets investment in a high-interest rate currency financed by borrowing in a low-interest rate currency. When the high interest rate reflects a scarcity of capital and high real rate of return and the low interest rate reflects an abundance of capital and low real rate of return, carry trades serve a useful economic purpose in helping to equilibrate rates of return and promote a more efficient allocation of capital. On the other hand, when only a nominal interest rate difference is observed, uncovered interest parity (UIP) implies that there is no incentive for capital flows because depreciation of the high-interest rate currency will fully offset the interest differential. In practice, most analysts base carry trade signals on the nominal interest rate differential, and the change in this as well as the exchange rate will determine the profitability of the carry trade in the investor’s base currency.
Graph 5.1 illustrates the cumulative return on a simple carry trade strategy with equally weighted long positions in the three highest-yielding G-10 currencies financed by equally weighted short positions in three lowest-yielding G10 currencies and held over the 1989–2013 period. Over the 24-year sample period, this stylised strategy would have produced an average annual excess return (above the risk-free rate) of 5.9% with annualised volatility of 9.3% which implies a Sharpe ratio exceeding 0.6.36 Graph 5.2 shows the cumulative return for an analogous carry
trading strategy for a portfolio of EM currencies over a shorter sample period, 2001–13. Rosenberg (2014) notes that the sample period does not cover an earlier period when periodic currency crises hit EM countries, but that it could fairly represent a period when global investors took greater awareness of EM carry trades. Over the 13-year sample period, this EM carry trade strategy would have produced an average annual excess return of 10.7% with annualised volatility of 11.4%, which implies a Sharpe ratio of 1.1. The results are striking but Rosenberg (2014) cautions that insufficient liquidity in various EM currencies as well as capital flow restrictions and regulations might have limited investor’s ability to undertake these trades in sizeable amounts.
Both Graphs 5.1 and 5.2 illustrate a pattern of cumulative returns that generally moves upwards over time, but is punctuated occasionally by short periods of large losses.37 Following Brunnermeier, Nagel and Pedersen (2009), it can be useful to
briefly sketch the macroeconomic setting that enables this pattern of returns to
36 For comparison, the Sharpe ratio for a buy-and-hold strategy on the S&P 500 stock index has
averaged about 0.3.
37 The imagery sometimes used is that carry trades are like “picking up nickels in front of a steam
develop. To begin, once an interest differential is observed, investors will not react immediately. Contrary to UIP theory, carry trade investors are exposed to a variety of risks, such as exchange rate risk and liquidity risk. Given risk aversion, these factors are likely to retard the rate at which investors pursue carry trades and the ultimate size of their positions. Over time, as carry trade profits are realised, other investors may be attracted and early investors may have had both the inclination and time to arrange financing to leverage their positions. Even if policymakers observe carry trade positions mounting, they may be reluctant to adjust interest rates (presumably set to meet domestic economic objectives) that would reduce the carry or affect exchange rate expectations. And so the cycle of carry favouring the target currency and greater investor confidence continues. At some point, a shock occurs – possibly a change in the expected path of interest rates, or of exchange rates, or in investor access to credit needed to roll over their positions – that leads some investors to begin unwinding their positions. Depending on the nature of the shock, the more apparent the shock is and the greater its impact on more investors, the more likely it is that many investors will attempt to unwind more of their positions at the same time, thus precipitating a rush for the exits, a large drop in the exchange rate, and sudden large losses for carry trade investors.
The Australian dollar-Japanese yen experience from 2002–08 provides a textbook illustration of both the time pattern of carry trade returns and their distribution. As shown in Graph 5.3a, the three-month nominal interest rate differential between AUD and JPY hovered around 5% at the start of this period before moving higher. Even on a risk-adjusted basis (see Graph 5.3b), carry returns were significant and also trended upward over the period. Risk reversal prices, representing the price of out-of-the-money calls on JPY versus similar calls on AUD, were positive, indicating that market expectations favoured a yen appreciation. Nevertheless, the AUD appreciated gradually over the period until the summer of 2007. The AUDJPY dropped from 103 in mid-July 2008 to about 85 just prior to the Lehman Brothers bankruptcy on September 15. Within six weeks, the rate had fallen below 60 AUDJPY.
5.b Evidence of carry trade activity and warning signs
Related literature. While there is abundant evidence on the historic patterns of
carry trade risk and return, there is less agreement on how sizeable and important carry trade activity may be in financial markets, or how to measure it. Galati, Heath and McGuire (2007) examine a number of indicators to gauge the magnitude of carry trade activity. Data on bank positions and cross-border flows in known funding and target currencies are consistent with greater activity in these currencies. However, the authors acknowledge that it is difficult to determine whether these positions are explicitly related to carry trades.
(2007) provide evidence that net long non-commercial open positions in several target currencies tended to build along with risk-adjusted returns on carry, and that funding currencies displayed a complementary net short open position. The authors offer additional supportive evidence, based on turnover data in the broader FX market, that shows a positive correlation between turnover and the carry-to-risk ratio for target currencies.
In a related paper, Curcuru, Vega and Hoek (2010) propose a more direct approach for gauging the importance of carry trades based on exchange-traded funds (ETFs) and exchange-traded notes (ETNs) whose returns are directly linked to carry trade strategies. By itself, the introduction of securities linked to carry trades demonstrates the wider interest in and greater availability of financial products linked to currency carry trades. The authors note that the volume of outstanding shares for one ETF tended to grow along with the carry-to-risk ratio but that, as products intended for retail investors, ETFs and ETNs might not be representative of the larger institutional market. Based on this information, together with data for net open positions of non-commercial traders in currency futures contracts as well as BIS data and US Treasury International Capital (TIC) data on cross-border capital flows, the authors are not able to find “convincing evidence that carry trade strategies were adopted on a widespread and substantial basis” over the period leading up to and just subsequent to the GFC.
In his survey of carry trading, Rosenberg (2014) lends support to this view with the possible explanation that FX managers “appear to place a great deal more emphasis on risk management than on return enhancement, so much so that they appear to prefer leaving money on the table rather than pursuing risky strategies such as FX carry trades that could leave their portfolios exposed to potentially large downside moves.” To support this interpretation, Rosenberg observes that an index of FX fund manager performance is weakly correlated to carry returns and that the returns for FX managers on the whole display much less volatility and lack the characteristic left skew of carry trade returns more generally.
Carry returns and style analysis: methodology. Carry-trade investments
represent only one of a number of different currency investment strategies. In the following we review a method for examining the prevalence of carry trading strategies which is based upon comparing the pattern of returns for carry with the pattern of returns for professional investors, while taking into account the possibility of alternative investment “styles”.
capture the overall risk level. The model has the form:
++
= i i it t
t F
R
α
β
,ε
(1)where
R is the excess return generated by the currency manager, defined as the total return ( *
t
R
) less the periodic risk-free rate (R
F t, )α is a measure of active manager skill,
F is a beta factor, that requires a systematic risk premium in the market,
β is a coefficient or factor loading that measures the sensitivity of the manager’s returns to the factor, and
ε is a random error term.
Do “global macro” investors pursue carry? While the dependent variable in
this analysis is usually the time series of returns of funds or groups of funds that specialise in currency investments, the group that we first consider below are so-called global macro fund managers, many of whom make explicit reference to currency strategies in their stated investment mandates. Global macro funds have the benefit of representing a larger pool of capital, nearly $200 billion or a little over 8% of all assets under management in the hedge fund industry in 2014 according to Hedge Fund Research. On the other hand, global macro funds pursue a variety of strategies that are not entirely pure currency plays, and so their connection to carry and other currency strategies may be more likely to fluctuate over time.
To explore the possible reliance on currency carry trades by global macro funds, we regress the returns on the HFRI Macro Total Index against the DB Carry Index using monthly data over the period January 2000–August 2014. We estimate a set of rolling regressions based on 12, 18 and 24 months and estimate both univariate and multivariate regressions that include indices of trend-following and value styles of currency investing as discussed above. For the 18-month window with 151 observation periods, we find that the beta coefficient on carry is significant in roughly one quarter of the periods. When significant, the coefficient on carry ranges from about 0.25 to 0.55, while the R-squared ranges from 0.26 to 0.71. The size of the coefficient and high R-squared suggest that carry can be an important strategy for global macro funds, whose earnings can depend heavily on returns to the strategy. At the same time, the coefficients variability over time also suggests that as a group, a large proportion of managers may enter or exit a strategy at about the same time, enough so to affect the estimate for the Macro Total Index.
Dedicated currency funds. The second group of investors we consider are