A New Multi-Dimensional Framework for Analysing Regional
Integration: Regional Integration Evaluation Methodology
Donghyun Park* Asian Development Bank
Mario Arturo Ruiz Estrada** University of Malaya
Abstract : Theories of regional integration typically analyse the regional integration process from the perspective of a single discipline, usually economics. However, such one-dimensional analytical frameworks cannot fully capture the richness and complexity of the inherently multi-dimensional regional integration process. To address the problem, we propose the regional integration evaluation (RIE) methodology which is based on four dimensions of development – economic, political, social and technological. The central idea behind the RIE methodology is that regional development promotes regional integration. Our RIE methodology differs from the existing literature in that it is based on a more comprehensive definition of development rather than just an economic one. Our definition of a region’s development incorporates the development levels of all regional countries as well as differences in development levels among regional countries. We applied the RIE methodology to assess regional development and hence integration prospects of NAFTA, ASEAN, MERCOSUR and EU.
Keywords: ASEAN, economic integration, economic modeling, EU, MERCOSUR, NAFTA
JEL classification: F15
1. Introduction
Research on regional integration has engendered a wide range of theories, models and methodologies. Most of the existing theories, models and research methodologies on regional integration are based on the perspectives of a single discipline, most often economics.1 In this paper, we approached regional integration from a multi-disciplinary perspective incorporating not only economics but also the political, social and technological dimensions of integration.2 More specifically, we introduced a new multi-dimensional analytical * Economics and Research Department, Asian Development Bank, 6 ADB Avenue, Mandaluyong City
1550, Philippines. Email: [email protected]
**Faculty of Economics and Administration, University of Malaya, 50603 Kuala Lumpur, Malaysia.
Email: [email protected] (Corresponding author)
1 Please refer to Jovanovic (2006), Robson (2006), Fratianni (2006), Das (2004) and El-Agraa (1989) for comprehensive discussions of regional economic integration.
framework – the regional integration evaluation (RIE) methodology – which is based on all four dimensions of development. Our measure of a region’s development level in the economic, political, social and technological spheres is the regional development index Xi. The index incorporates the development levels of all regional countries as well as differences among the regional countries. For example, ASEAN’s economic development index measures ASEAN’s economic development level, which, in turn, depends on the economic development levels of all its member countries. Wide gaps in economic development levels among member countries, say between Singapore and Cambodia, reduce ASEAN’s economic development index.
The central idea behind the RIE methodology is that regional development promotes regional integration. That is, the higher the development level of a region, the more likely it is that the countries of the region will experience closer integration with each other. The development level of a region, in turn, depends on the domestic development level of each country in the region. While the idea that regional development is beneficial for regional integration is hardly new, our RIE methodology differs from the existing literature in that it is based on a more comprehensive definition of development than just economic development. A high level of regional economic development is certainly conducive for integration since it allows for more trade, investment and other economic interaction among its member countries. However, it is equally clear that a high level of development in non economic spheres is also conducive for integration. For example, regional integration is more likely to occur among well-functioning democracies than among countries with less mature and stable political systems. This explains why Western European countries, which are not only highly developed economically but also politically and in other spheres, have reached the highest level of regional integration in the world today.
2. RIE Methodology: an Illustration from Inter-Korean Unification
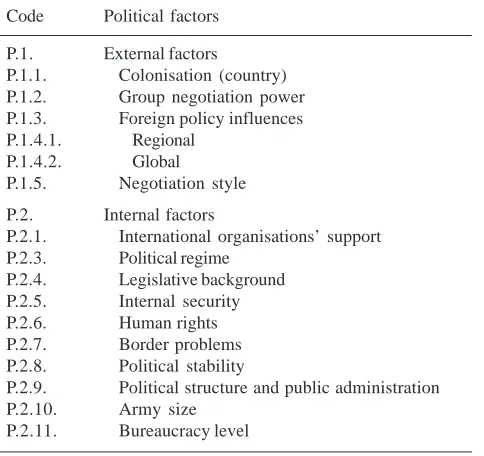
In this section, we illustrate the RIE methodology using the example of unification between the two Koreas. The main objective of the RIE model is to provide policymakers and researchers a new analytical tool to study the evolution of any regional integration process from a global perspective encompassing the political, social, economic and technological dimensions.3 The simple and flexible model is based on a group of indexes and graphs, and it can be applied to any case of regional integration. The model involves four basic phases. The first phase is the design of the multi-input database table. The second phase is the measurement of individual Regional Global Development Indexes (Xi), which include the Regional Global Political Development Index (X1), Regional Global Social Development Index (X2), Regional Global Economic Development Index (X3) and the Regional Global Technological Development Index (X4). The third phase is the measurement of the Regional Global Development (RGD) index. The last phase is the measurement of the Regional Integration Stage (RIS) index.Let us now discuss each of the four basic phases, beginning with the design of the multi-input database table. Table 1 gives an example of the multi-input database table and shows global regional political development. Global refers to the multidimensional nature of political development and is represented by a wide range of political variables. Regional refers to the specific region of interest to the research. Therefore, in our case, global regional
3 For a full description of the model, please refer to Ruiz (2004). The paper is available from the authors upon request.
Table 1. Multi-input database - global political development
Code Political factors
P.1. External factors
P.1.1. Colonisation (country) P.1.2. Group negotiation power P.1.3. Foreign policy influences
P.1.4.1. Regional
P.1.4.2. Global
P.1.5. Negotiation style
P.2. Internal factors
P.2.1. International organisations’ support P.2.3. Political regime
P.2.4. Legislative background P.2.5. Internal security
P.2.6. Human rights
P.2.7. Border problems
P.2.8. Political stability
P.2.9. Political structure and public administration
P.2.10. Army size
political development refers to the political development of the two Koreas as measured by the 15 political variables in Table 1. There is no reason why the number of variables in a multi-input database table should be constant and it can vary according to the objectives of the research and data availability. We can similarly construct multi-input database tables for global regional economic, social and technological development.
The second phase of the RIE model is to measure the Global Development Indexes (Xi) using the variables in the four multi-input database tables described above. The four Global Development Indices are the Global Political Development Index (X1), Global Social Development Index (X2), Global Economic Development Index (X3) and Global Technological Development Index (X4). The data input for each country in the region – in our case, North Korea and South Korea are the countries and Korea is the region – are based on statistical and historical data. Furthermore, all our data are binary – i.e. either 1 or 0 – and determined by either quantitative or qualitative criteria. A big reason for using binary data is that the same level of importance is attached to all the variables in our multi-input database tables. Another reason for using binary data is that it allows us to analyse countries with limited data, such as North Korea.
Table 2 is an example of a multi-input database table with input of binary data, and showing the global political development of South Korea, North Korea and the Koreas in the 1970s. For example, the value for the variable ‘political regime’ is 1 if the country is democratic and 0 if the country is non democratic. Therefore, as the last three columns
Table 2. Global political development of South Korea and North Korea in the 1970s
Code Political factors SK NK
P.1. External factors
P.1.1. Colonisation (country) 0 0
P.1.2. Group negotiation power 1 0
P.1.3. Foreign policy influences
P.1.4.1. Regional 1 0
P.1.4.2. Global 0 0
P.1.5. Negotiation style 1 0
P.2. Internal factors
P.2.1. International organisations’ support 1 0
P.2.3. Political regime 1 0
P.2.4. Legislative background 0 0
P.2.5. Internal security 1 1
P.2.6. Human rights 1 0
P.2.7. Border problems 0 0
P.2.8. Political stability 0 0
P.2.9. Political structure and public administration 0 0
P.2.10. Army size 0 0
P.2.11. Bureaucracy level 0 0
Total 7 1
show, the value is 1 for South Korea and 0 for North Korea. Similarly, the value of the variable ‘human rights’ is 1 if a country’s protection of human rights is strong and 0 if it is weak. This is why we input 1 for South Korea and 0 for North Korea. The total for South Korea is 7 or 47 per cent since there are 15 variables and the total for North Korea is 1 or 7 per cent. The global political development of South Korea and North Korea in the 1970s is thus 47 per cent and 7 per cent, respectively.
We can similarly input binary data for all the variables in the multi-input database tables for social, economic and technological development of the two Koreas in the 1970s.4 The global social development of South Korea and North Korea in the 1970s was found to be 57 and 29 per cent, the global economic development of South Korea and North Korea in the 1970s to be 40 and 14 per cent, and the global technological development of South Korea and North Korea in the 1970s to be 60 and 30 per cent
The third phase of the RIE model is to use the four Global Development Indices (Xi) we found in the model’s second phase – i.e. political, social, economic and technological – to estimate the Global Overall Development Index (X), which sums up the information contained in the four indices. Intuitively, the Global Overall Development Index (X) measures a country’s overall level of development from a multidimensional or global perspective encompassing political, social, economic and technological development. Furthermore, as we saw earlier, we measured political, social, economic and technological development themselves from a multidimensional or global perspective, using a wide range of variables relevant to the development of each sphere.
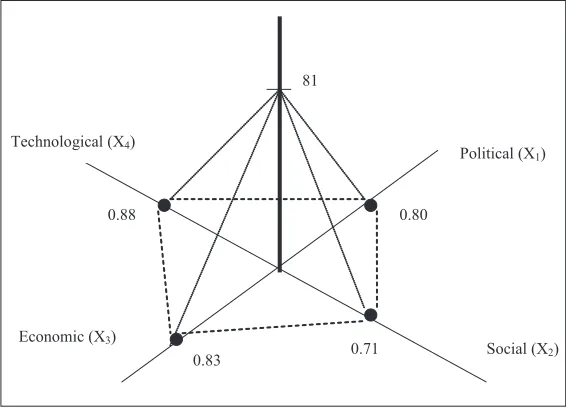
The first step in estimating the Global Overall Development Index (X) is to plot the values of the four Global Development Indices (Xi), as shown in Figure 1. This graph will help to illustrate how we compute X. Graph 1 consists of four different triangular areas – each bounded by the values of two of the four global development indices – for South
4 The binary variables for social, economic and technological development are, of course, different from the binary variables for political development.
Korea, North Korea and the Koreas. Let us define the triangular area between the political and social axes as A1, social and economic axes as A2, economic and technological axes as A3, and technological and political axes as A4. Each area has a maximum value of 0.25 and the total value of the four areas is 1.
We compute the overall global development index (X) as the sum of the four areas – A1, A2, A3 and A4. In computing A1, it is useful to think of the value of the Global Political Development Index (X1) as the base and the value of the Global Social Development Index (X2) as the height. We compute A1 by first multiplying X1 and X2, and then dividing their product by four. Similarly, we can compute A2, A3 and A4 by doing the same with the pairs (X2, X3), (X3, X4) and (X4, X1), respectively. For example, for South Korea, A1 is 6.7 per cent since X1 is 47 per cent and X2 is 57 per cent. Likewise, we compute A2, A3 and A4 for South Korea to be 5.7, 6 and 7.05 per cent. Therefore, South Korea’s overall global development index (X) is 25 per cent. We can similarly compute X for North Korea as 3 per cent. Therefore, in the 1970s, South Korea’s overall development level was about eight times higher than that of North Korea.
The fourth and final phase of the RIE model is to use the four Global Development Indices (Xi) and coefficients to measure the Global Development Stage (Y) of South Korea and North Korea. The coefficient indicates the relative importance of the political, social, economic and technological dimensions, and sums up to one. For example, if we attach equal importance to the four dimensions, the coefficient for each dimension is 0.25. To obtain the Global Development Stage (Y), we first multiply the Global Development Index (Xi) with the corresponding coefficient – for example, the Global Political Development Index (X1) and the political coefficient – and then sum up the four products. Assuming that each of the four coefficients is 0.25, so that the four dimensions are equally important, we can compute the Global Development Stage (Y) for South Korea and North Korea as 51 and 20 per cent, respectively, in the 1970s. The large gap in Y between South Korea and North Korea indicates a large gap between the two countries in terms of overall development. Figure 2 below provides a graphical representation of Global Development Stage (Y). The height corresponds to Y and the quadrangular area inside the dotted lines corresponds to the Overall Global Development Index (X).
The Global Development Stage (Y) is broadly similar to the Global Overall Development Index (X) since both reflect the overall development level of a country or a region. We define a value of Y between 0 and 33 per cent as the underdeveloped stage, 34 and 66 per cent as the developing stage, and 67 and 100 per cent as the developed stage. Therefore, in the 1970s, South Korea was in the developing stage whereas North Korea was in the underdeveloped stage. We should note that Y is more flexible than X in the sense that it allows us to attach any combination of relative weights to the political, social, economic and technological dimensions. For example, if we attach more importance to the political dimension than the other dimensions, the political coefficient may be 0.40 while the social, economic and technological coefficients may each be 0.20. More generally, we can flexibly vary the relative sizes of the four coefficients to suit our needs.
3. Application of the RIE Methodology to Different Trade Blocs
(ASEAN) and Market of the South Cone (MERCOSUR) – to estimate their regional development levels.5 The four trade blocs encompass a wide range of geographical locations as well as economic, political, social and technological structures. Applying the RIE methodology to such a diverse group of regions and comparing their development levels enables us to have a clearer picture of the effect of regional development on regional integration. We also looked at how the regional development of each trade bloc has evolved over time so as to evaluate whether its integration prospects have become stronger or weaker over time. More specifically, we estimated and compared the regional development level in 3 different time periods – 1980s, 1990s and 2000-2009. Our application of the RIE methodology allowed us to compare the prospects for integration among different groups of countries as well as the evolution of those prospects over time.
3.1 European Union (EU): High Regional Development and High Regional Integration
The European Union (EU) was established as the European Economic Community in 1957 and represents the most advanced form of regional integration in the world today.6 Geopolitical factors, in particular the strong political commitment of Western European governments to prevent another military conflict in the aftermath of the devastating Second Word War, provided a powerful initial impetus for regional integration. An equally powerful impetus came from a common desire of Western European countries to achieve more rapid economic growth by reducing barriers to trade and thus promoting trade with each other. The convergence of powerful geopolitical and economic self-interest has led to a deepening and broadening of integration unparalleled by any other regional group in the world. The depth of EU integration is epitomised by the Euro, the common currency shared by 16
Figure 2: Global development of South Korea and North Korea in the 1970s
5 A comprehensive explanation of the RIE methodology to the four trade blocs, including the full list of variables we used to measure economic, political, social and technological development level is available from the authors upon request.
member states, while the breadth of integration is perhaps best illustrated by the steady expansion of membership from six to twenty-seven. The EU is in many ways a unique supranational and inter-governmental organisation.
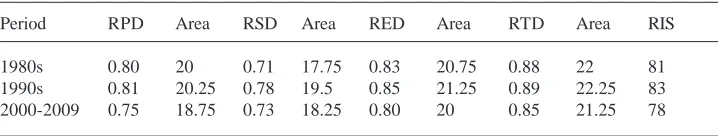
Table 3 shows the evolution of the EU’s regional development indices in the 1980s, 1990s and 2000-2009.7 The regional political development index (X
1) rose slightly from 0.80 in the 1980s to 0.81 in the 1990s before falling to 0.75 during 2000-2009. The regional social (X2), economic (X3) and technological (X4) regional development index all show the same pattern of (i) a slight increase between the 1980s and the 1990s, and (ii) a somewhat bigger decrease between the 1990s and 2000-2009. The most striking feature of Table 3 is EU’s high level of regional development in all four spheres – political, social, economic and technological. This is not surprising since the EU consists of high-income countries with relatively homogenous social and political values as well as technological capabilities. The column to the right of each of the 4 regional development indices corresponds to the triangular area used to compute the regional integration stage (RIS) index, which is a measure of overall regional development incorporating all 4 spheres.8 The larger a particular development index, the larger the corresponding triangular area. The pattern of the RIS index is similar to the four development indices – rising from 81 in the 1980s to 83 in the 1990s before falling to 78 in 2000-2009. Figure 3 shows the graphical illustration of the four regional development indices, the corresponding triangular areas, and the RIS index during the 1980s for the EU.
A major development within the EU during 2000-2009 was the accession of new members with lower levels of political, social, economic and technological developments. More specifically, in 2004 Cyprus, Estonia, Hungary, Latvia, Lithuania, Malta, Poland, Slovakia, Slovenia and the Czech Republic joined the EU. Except for Cyprus and Malta, all the new members were formerly communist countries making the transition from centrally planned
7 Please refer to Ruiz and Park (2007) and Ruiz (2004) for a comprehensive overview of the derivation of the regional development index.
8 For example, in the 1980s, 20 is the triangular area associated with the regional political development index of 0.8. In computing the RIS index, we can vary the weights we assign to political, social, economic and technological development. In this paper, we have assigned equal weights to the four different dimensions of development. The RIS index is simply the sum of the four triangular areas. Please refer to Ruiz and Park (2007) and Ruiz (2004) for a more comprehensive discussion on deriving the RIS index.
Table 3. EU’s political, social, economic and technological development and Regional Integration
Stage (RIS) Index
Period RPD Area RSD Area RED Area RTD Area RIS
1980s 0.80 20 0.71 17.75 0.83 20.75 0.88 22 81
1990s 0.81 20.25 0.78 19.5 0.85 21.25 0.89 22.25 83
2000-2009 0.75 18.75 0.73 18.25 0.80 20 0.85 21.25 78
Note: RPD = Regional Political Development, RSD = Regional Social Development, RED = Regional
economies to market-based economies and authoritarian political systems to liberal multi-party democracies. The reduction in the four regional development indices between the 1990s and 2000-2009, along with the RIS index, is a natural consequence of the entry of ten of less developed new members. However, what is more significant is that even after absorbing ten new members, the EU remains highly developed politically, socially, economically and technologically. Although the development gap between the old and new members has made the EU more heterogeneous, such heterogeneity has not significantly reduced its overall development level. This suggests that despite the recent membership expansion, the EU remains a viable and forceful mechanism for European integration. Going forward, our analysis implies that the entry of Romania and Bulgaria in 2007, as well as the future prospective entry of Turkey and some Balkan countries, is unlikely to adversely affect the sustainability of the EU. Nevertheless, in many EU countries there has been a political backlash against the expansion of the EU.
3.2 NAFTA: High Regional Development and Economics-Focused Regional Integration
The North American Free Trade Agreement (NAFTA) came into effect on 1 January 1994 and established a North American free trade area consisting of the United States, Canada and Mexico.9 The free trade area is the world’s largest in terms of the combined economic size, larger than even the EU. Unlike the EU, which addresses a wide range of economic and non economic issues, NAFTA is a purely economic agreement which seeks to boost trade among the three countries by reducing trade barriers, in particular tariffs. The formation of
Figure 3: Graphical illustration of the four Regional Development Indices
and the Regional Integration Stage (RIS) Index: EU in the 1980s
NAFTA was driven by a common desire to make the North American markets more efficient, and thereby promote the international competitiveness and economic welfare of the three countries. Unlike the EU, NAFTA did not create any supranational organisation such as the European Commission. In the context of their roles as trade blocs, the US, Canada and Mexico pursue different trade policies with respect to non NAFTA countries. In contrast, the EU is a customs union in which all EU members pursue the same trade policies vis-à-vis non EU countries.
Table 4 shows the evolution of NAFTA’s regional development indices in the 1980s, 1990s and 2000-2009. The regional political development index (X1) rose slightly from 0.65 in the 1980s to 0.67 in the 1990s and further to 0.70 during 2000-2009. The regional social development index (X2) shows a much sharper rise, from 0.48 in the 1980s to 0.76 in the 1990s and during 2000-2009. The regional economic development index (X3) rose from 0.74 in the 1980s to 0.82 in the 1990s and further to 0.85 during 2000-2009. Finally, the increase in the regional technological development index (X4) is smaller, rising from 0.90 in the 1980s to 0.93 in the 1990s and 2000-2009. Table 4 indicates that relative to the pre-NAFTA period, the NAFTA bloc has become more developed politically, socially, economically and technologically. The progress in regional development has been especially pronounced in the social, and to a lesser extent, economic spheres. The regional integration stage (RIS) index rose from 69 in the 1980s to 80 in the 1990s and 81 in 2000-2009.
Our application of the RIE methodology to NAFTA indicates that conditions are becoming more conducive for broader and deeper integration among the US, Mexico and Canada. Indeed we find that the RIS index is higher for NAFTA than the EU. The balance of evidence suggests that NAFTA has served as a major catalyst of trade and investment in all three countries. In particular, NAFTA seems to have been beneficial for the economic growth of Mexico, which considerably lags behind its two northern neighbours in per capita income and overall development. Although Mexico’s post-1994 growth performance has been neither striking nor fast enough to permit convergence with the US and Canada, it would have been even less impressive without the benefits of NAFTA – greater access to the two rich markets and higher FDI inflows attracted by such access. Although various structural obstacles, for example political opposition in the US to Mexican immigration, stand in the way of deeper integration, our analysis lends support to those who argue that NAFTA should now aspire to become more than just a free trade area.
Table 4. NAFTA’s political, social, economic and technological development and Regional Integration
Stage (RIS) Index
Period RPD Area RSD Area RED Area RTD Area RIS
1980s 0.65 16.25 0.48 12 0.74 18.5 0.90 22.5 69
1990s 0.67 16.75 0.76 19 0.82 20.5 0.93 23.25 80
2000-2009 0.70 17.5 0.76 19 0.85 21.25 0.93 23.25 81
Note: RPD = Regional Political Development, RSD = Regional Social Development, RED = Regional
3.3 ASEAN: Low Regional Development and Low Regional Integration
The Association of Southeast Asian Nations (ASEAN) was established in 1967 by Indonesia, Malaysia, Philippines, Singapore and Thailand, and its membership has expanded over time to include Vietnam, Myanmar, Cambodia, Laos and Brunei.10 ASEAN was formed by a group of pro-Western, anti-communist countries at the height of the Cold War against the backdrop of the Vietnam War. As such, ASEAN was initially driven by geopolitical considerations and served primarily as a forum for fostering dialogue and cooperation on political and security issues. More specifically, ASEAN sought to build up a united front against the communist threat and to defuse potential conflict among its members. Although the initial impetus for ASEAN came from geopolitics rather, promoting trade, investment and other economic cooperation has become increasingly more important in line with the region’s rapid economic growth. Southeast Asia has been part and parcel of the East Asian Miracle which transformed the region from an economic backwater to the most dynamic component of the global economy. The end of the Cold War has further accelerated the strategic shift in ASEAN’s focus from geopolitical cooperation to economic cooperation. A concrete example of this strategic shift is the ASEAN Free Trade Area initiative, which was launched in 1992 to reduce trade and non trade barriers among members.
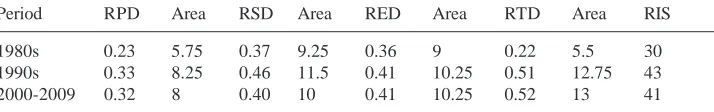
Table 5 shows how ASEAN’s regional development indices have evolved over time. The regional political development index (X1) rose sharply from 0.23 in the 1980s to 0.33 in the 1990s before falling marginally to 0.32 during 2000-2009. The regional social development index (X2) also rose sharply from 0.37 in the 1980s to 0.46 during the 1990s before falling back to 0.40 during 2000-2009. The regional economic development index (X3) rose from 0.36 in the 1980s to 0.41 in the 1990s and during 2000-2009. The increase in the regional technological development index (X4) is larger, rising from 0.22 in the 1980s to 0.51 in the 1990s and 0.52 during 2000-2009. Table 5 reveals that ASEAN became more developed politically, socially, economically and technologically between the 1980s and the 1990s. However, by and large there has been almost no progress in ASEAN’s development between the 1990s and 2000-2009. The regional integration stage (RIS) index shows a similar trend, rising from 30 in the 1980s to 43 in the 1990s before falling to 41 during 2000-2009.
10Please refer to Tarling (2006) and Plummer (2006) for comprehensive overviews of ASEAN.
Table 5. ASEAN’s political, social, economic and technological development and Regional Integration
Stage (RIS) Index
Period RPD Area RSD Area RED Area RTD Area RIS
1980s 0.23 5.75 0.37 9.25 0.36 9 0.22 5.5 30
1990s 0.33 8.25 0.46 11.5 0.41 10.25 0.51 12.75 43
2000-2009 0.32 8 0.40 10 0.41 10.25 0.52 13 41
Note: RPD = Regional Political Development, RSD = Regional Social Development, RED = Regional
The progress in political, social, economic and technological development between the 1980s and the 1990s closely mirrors ASEAN’s remarkable economic growth and development from 1980 to 1997. The after effects of the Asian currency crisis of 1997-1998, which put a rude stop to the region’s seemingly unstoppable march toward prosperity, are reflected in the lack of development progress between the 1990s and 2000-2009. The low level of regional development is primarily due to a great deal of income heterogeneity within ASEAN, which includes some of the world’s poorest countries as well as one of the richest – Singapore. While intra-ASEAN trade is not negligible, its relative importance falls far short of trade with non ASEAN countries for all ASEAN members. Likewise, one of the guiding principles of ASEAN – non interference in the internal affairs of other members – has prevented ASEAN countries from collectively pushing for political reform. In short, the low level of regional development has prevented ASEAN from becoming an effective vehicle for regional integration. Our analysis suggests that at this point in time, it may be more productive for ASEAN to consolidate its existing scope and level of integration rather than seek to horizontally or vertically expand its integration. One possible strategy for ASEAN going forward is to first strengthen integration among relatively more developed members before doing the same for all members.
3.4 MERCOSUR: Rapid Regional Development and Slow Regional Integration
MERCOSUR, or Common Market of the South, was set up in 1991 by Argentina, Brazil, Paraguay and Uruguay, and is South America’s leading trade bloc.11 MERCOSUR’s combined market accounts for around 70 per cent of the continent’s output, and its stated aim is to create a customs union with common external tariffs against non members and free trade within the bloc. The main driver behind the formation of the South American common market was the shared desire of the continent’s two largest economies – Argentina and Brazil – to intensify their economic interaction as a means of enhancing efficiency, productivity and international competitiveness. Both countries were very much part of the Latin American debt crisis in the early 1980s, which led to macro-economic instability and slow growth throughout the decade, so much so that the 1980s is widely known as the region’s ‘lost decade’ from the economic perspective. Along with sounder macro-economic policies and structural reform, Argentina and Brazil viewed greater regional trade as an important potential channel for recovering from the lost decade and speeding up growth. Geographical proximity and economic linkages with the two giants made Paraguay and Uruguay natural additional partners to the trade bloc. A major contributing political factor is the fact that the debt crisis and its adverse effects on economic performance have discredited the region’s authoritarian military governments, which paved the way for their replacement by democratic civilian governments more willing to cooperate with other countries.
Table 6 below shows the evolution of MERCOSUR’s regional development indices in the 1980s, 1990s and 2000-2009. The regional political development index (X1) rose sharply from 0.11 in the 1980s to 0.44 in the 1990s and further to 0.52 during 2000-2009. The regional social development index (X2) also rose sharply from 0.36 in the 1980s to 0.46 in the 1990s and more moderately to 0.50 during 2000-2009. The regional economic development index
(X3) rose from 0.32 in the 1980s to 0.41 in the 1990s and further to 0.48 during 2000-2009. The increase in the regional technological development index (X4) has also been pronounced, rising from 0.23 in the 1980s to 0.51 in the 1990s and further to 0.55 during 2000-2009. Table 6 reveals that during the post-MERCOSUR period, the MERCOSUR bloc had made a great deal of progress in political, social, economic and technological development as well as overall development. The regional integration stage (RIS) index rose from 26 in the 1980s to 46 in the 1990s and further to 51 during 2000-2009.
Our application of the RIE methodology to MERCOSUR indicates that between the 1980s and the 1990s, conditions became much more conducive for integration among the four South American countries. In particular, the substantial improvement in the macro-economic performance of Argentina and Brazil as well as their political transformation into multi-party democracies has strengthened intra-MERCOSUR political and economic integration. Empirical evidence also indicates that during the 1990s, the reduction in tariff and non tariff trade barriers under MERCOSUR was effective in expanding trade among the four members and serving as an engine of regional growth. However, during the 2000-2009 period, regional integration failed to keep pace with regional development. In fact, further integration has stalled in the face of growing protectionism within the region, which was initially precipitated by currency devaluations and the economic stagnation of 1999-2002. Our analysis suggests that the region’s development has continued to move forward despite those temporary setbacks. Therefore, instead of erecting more trade barriers against each other and moving away from the ideal of a customs union, the four MERCOSUR governments should work hard to get regional integration back on track in light of the progress made between 1990s and 2000-2009.
4. Concluding Remarks
In this paper, we introduced a new multi-disciplinary analytical framework – the regional integration evaluation (RIE) methodology – for analysing regional integration. The methodology is based on the recognition that regional integration is not a narrow economic phenomenon, but a much broader phenomenon which also includes political, social and technological dimensions. That is, integration not only involves reducing barriers to trade, investment and other cross-border economic activities, but also means facilitating cooperation in other areas. As such, the pre-conditions for successful integration include
Table 6. MERCOSUR’s political, social, economic and technological development and Regional
Integration Stage (RIS) Index
Period RPD Area RSD Area RED Area RTD Area RIS
1980s 0.11 2.75 0.36 9 0.32 8 0.23 5.75 26
1990s 0.44 11 0.46 11.5 0.41 10.25 0.51 12.75 46
2000-2009 0.52 13 0.50 12.5 0.48 12 0.55 13.75 51
Note: RPD = Regional Political Development, RSD = Regional Social Development, RED = Regional
both economic and non economic factors. The central idea behind the RIE methodology is that (i) regional development should be defined broadly to encompass political, social, economic and technological development, and (ii) regional development is conducive for regional integration. It is likely that a group of highly developed and homogeneous countries will be able to pursue integration more effectively than a group of less developed and heterogeneous countries. Furthermore, we can expect regional integration to promote regional development, which means there is a complementary relationship between regional development and regional integration, one supporting the other.
To illustrate its practical usefulness for policymakers, we applied the RIE methodology to the European Union (EU), North American Free Trade Area (NAFTA), Association of Southeast Asian Nations (ASEAN) and Market of the South Cone (MERCOSUR) to estimate the regional development levels of four geographically dispersed trade blocs which differ widely in terms of their economic, political, social and technological characteristics. We also applied the RIE methodology for three different time periods – the 1980s, the 1990s and 2000-2009 – to track the evolution of each bloc’s regional development level over time. Broadly speaking, we can characterise the regional development and integration levels of the four blocs as follows: (1) EU – high regional development and high regional integration, (2) NAFTA – high regional development and economics-focused regional integration, (3) ASEAN – low regional development and low regional integration, and (4) MERCOSUR – rapid regional development and slow regional integration. Our analysis not only allows for a comparison of different trade blocs but also captures the impact of major economic and non economic shocks on the evolution of regional development over time. For example, the entry of less developed new members from Central and Eastern Europe in the past few years has reduced the EU’s development level. Likewise, South America’s strong and sustained economic recovery from the lost decade of the 1980s has lifted MERCOSUR’s development level.
References
Cameron, M. and B. Tomlin. 2000. The Making of NAFTA: How the Deal was Done. Ithaca, New York: Cornell University Press.
Capannelli, G., J. Lee and P. Petri. 2009. Developing Indicators for Regional Economic Integration and Cooperation. ADB Working Paper Series on Regional Economic Integration No.33, September 2009, ADB, Manila.
Das, D. 2004. Regionalism in Global Trade. Cheltenham, UK: Edward Elgar.
Dinan, D. 2005. Ever Closer Union: an Introduction to European Integration. Boulder, Colorado: Lynne Rienner.
Duina, F. 2006. The Social Construction of Free Trade: the European Union, NAFTA, and
MERCOSUR. Princeton, New Jersey: Princeton University Press.
El-Agraa, A. 1989. The Theory and Measurement of International Economic Integration. Basingstoke, UK: Macmillan.
Folders, F. 2000. MERCOSUR: A new approach to regional integration? In The transformation of
Latin America: Economic Development in the Early 1990s, ed. F. Folders and M. Feldsieper.
Cheltenham, UK: Edward Elgar.
Fratianni, M. (ed.). 2006. Regional Economic Integration, Research in Global Strategic Management
v.12, Amsterdam: Elsevier.
Hufbauer, G. and J. Schott. 2005. NAFTA Revisited: Achievements and Challenges. Washington, D.C.: Institute for International Economics.
Jovanovic, M. 2006. The Economics of International Integration. Cheltenham, UK: Edward Elgar. Marsh, I. 2006. Democratization, Governance and Regionalism in East and Southeast Asia: a
Comparative Study. London: Routledge.
Molle, W. 2006. The Economics of European Integration: Theory, Practice, Policy, 5th ed. Aldershot, England: Ashgate.
Plummer, M. 2006. ASEAN – Economic Development and Integration: Trade, Foreign Direct
Investment and Finance. Singapore: World Scientific.
Preusse, H. 2004. The future of MERCOSUR. In Free trade in the Americas: economic and political
issues for governments and firms, ed. S. Weintraub, A. Rugman, A. and G. Boyd. Cheltenham,
UK: Edward Elgar.
Robson, P. 2006, The Economics of International Integration. London: Routledge.
Ruiz, M. and D. Park. 2007. Korean unification: how painful and how costly? Journal of Policy
Modeling, forthcoming.
Ruiz, M. 2004. The Global Dimension of Regional Integration Model (GDRI-Model). FEA 2004-7, Faculty of Economics and Administration (FEA) Working Papers, University of Malaya, Kuala Lumpur, Malaysia.