ISSN: 2306-9007 Hwan (2016) 225
I
www.irmbrjournal.com March 2016I
nternationalR
eview ofM
anagement andB
usinessR
esearchVol. 5 Issue.1
R
M
B
R
A Study on R&D Performance Maximization Portfolio
Analysis Technique Using AHP
SEUNG-HWAN JANG
Ph.D. Candidate, Graduate School of Management of Technology, Sungkyunkwan University, Korea
E-mail : [email protected]
Abstract
R&D portfolio is a strategy tool to make investment on the basis of business strategy by enhancing the alignment of business strategy and R&D strategy. The R&D portfolio has three main purpose: strategy alignment, value maximization, and balance. Therefore, to maximize the R&D performance in the research institute of L Company in Korea, this study tries to apply AHP technique to suggest a portfolio analysis plan that makes up for the R&D portfolio improvement plan being performed.
Key Words: R&D Portfolio, R&D Strategy, Business Strategy, AHP, Portfolio Analysis.
Introduction
R&D portfolio consists of one and more R&D projects. The tool is used to determine each position of multiple R&D projects to be evaluated in certain criteria, to judge comprehensively the meaning of each position and overall balance, and thereby to establish an action plan and make a strategy decision on resource distribution. With the use of the tool, it is possible to evaluate the profits and risks of an organization systematically from the perspectives of marketability and strategic positioning, to distribute resources to promising projects, and to maximize the future performance.
The purpose of R&D portfolio management is, first, to make the strategic direction of all projects equal and accomplish strategic alignment of business strategy and projects, secondly to achieve the balance of projects which means the balance of resource distribution in the resource constraint circumstance, thirdly to maximize portfolio value which means the maximization of the values of each individual project and the whole portfolio in a research institute. Corporate research institutes should introduce the management system of the R&D portfolio, and operate a proper portfolio system through system materialization and corporate discussion according to their own criteria.
Therefore, this study chose a corporate research institute in Korea and analyzed the R&D projects that the institute had performed in a given period in order to analyze the R&D portfolio to maximize R&D performance. Also, to examine the indicators chosen for the analysis, it applied AHP technique based on questionnaire survey. In the conclusion section of this study, the research results are summarized, and improvements and a future research direction were suggested.
Theoretical Background
R&D Portfolio
ISSN: 2306-9007 Hwan (2016) 226
I
www.irmbrjournal.com March 2016I
nternationalR
eview ofM
anagement andB
usinessR
esearchVol. 5 Issue.1
R
M
B
R
consideration of their correlations in the set (Turnbull, 1990). The portfolio technique has been applied to various areas, including strategy management, marketing, and R&D management. In order to help decision makers to design a portfolio in their circumstances, a variety of portfolio models have been developed. A portfolio model has difficulties in terms of the validity of dimension setting, the objectivity of the dimension based evaluation and classification criteria of each item, and the establishment of the strategy for items in the same classification, and the collection of proposed strategies (Armstrong & Brodie, 1994; Derkinderen & Crum, 1984; Day, 1977). Nevertheless, when other decision-making tools are used in parallel on the basis of the understanding of the difficulties, it is possible to help to make an effective decision (Olsen & Ellram, 1997).
R&D project management with the use of portfolio technique requires the determination of project priority prior to project planning and management. Through regular portfolio management, it is necessary to evaluate, choose, and prioritize a new project and readjust the priority of existing projects and stop them. In addition, it is needed to plan and manage R&D projects in line with business strategy or technical strategy.
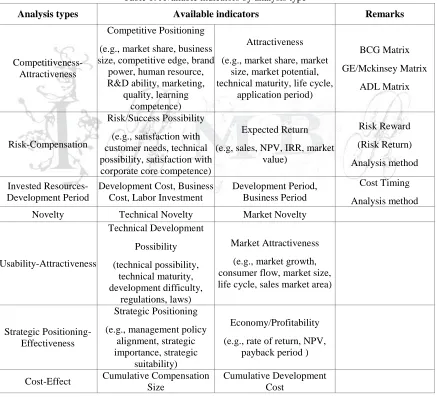
Table 1: Available indicators by analysis type
Analysis types Available indicators Remarks
Competitiveness-Attractiveness
Competitive Positioning
(e.g., market share, business size, competitive edge, brand
power, human resource, R&D ability, marketing,
quality, learning competence)
Attractiveness
(e.g., market share, market size, market potential, technical maturity, life cycle,
application period)
BCG Matrix
GE/Mckinsey Matrix
ADL Matrix
Risk-Compensation
Risk/Success Possibility
(e.g., satisfaction with customer needs, technical possibility, satisfaction with corporate core competence)
Expected Return
(e.g, sales, NPV, IRR, market value)
Risk Reward
(Risk Return)
Analysis method
Invested Resources-Development Period
Development Cost, Business Cost, Labor Investment
Development Period, Business Period
Cost Timing
Analysis method
Novelty Technical Novelty Market Novelty
Usability-Attractiveness
Technical Development
Possibility
(technical possibility, technical maturity, development difficulty,
regulations, laws)
Market Attractiveness
(e.g., market growth, consumer flow, market size, life cycle, sales market area)
Strategic Positioning-Effectiveness
Strategic Positioning
(e.g., management policy alignment, strategic importance, strategic
suitability)
Economy/Profitability
(e.g., rate of return, NPV, payback period )
Cost-Effect Cumulative Compensation
Size
ISSN: 2306-9007 Hwan (2016) 227
I
www.irmbrjournal.com March 2016I
nternationalR
eview ofM
anagement andB
usinessR
esearchVol. 5 Issue.1
R
M
B
R
Portfolio analysis and management process requires each of the following; First, it is required to select portfolio analysis types and indicators. In other words, it is necessary to choose analysis types that live up to the strategy and portfolio management purpose of a research institute, and set forth evaluation indicators and criteria by analysis type. Secondly, as a R&D project portfolio analysis, it is necessary to analyze the management plan of each R&D project and portfolio by type. Thirdly, in order to redesign a R&D project portfolio, it is required to readjust a R&D project portfolio, draw R&D problems, and find a strategic direction.
R&D portfolio analysis types and indicators are chosen and evaluated in accordance with the purpose of portfolio analysis and management. Given the management strategy and circumstances of each firm, it is general to use 2-3 types. To display a position on matrix, it is necessary to make scaling of indicators and change them to a score.
As a general method of displaying data, bubble diagram or cumulative bar graph is used. However, it is necessary to use an uncomplicated diagram graph tool in order for decision-makers to understand analysis results easily. The portfolio analysis on all R&D projects should guarantee that any persons with sound common sense and reasonable judgment ability can draw the same suggestions and conclusions.
AHP Technique
AHP (Analytic Hierarchy Process) that was developed in the 1970s by Thoma Saaty, a professor at the Wharton School, University of Pennsylvania, is a technique for determining decisions on the basis of multiple criteria. The technique is used to classify multiple attributes hierarchically, make pair-wise comparison of the classified attributes to find its weight, and thereby to solve complicated decision-making problems efficiently and evaluate an optimal alternative (Saaty, 1980).
The AHP systematically integrated the concepts and techniques that existed already but failed to be used in their interaction, and has been evaluated as a methodology to solve diverse decision-making problems effectively in the real world that has multiple alternatives and conflicting factors (Choi D, 2014).
The four axioms to be considered in the AHP application process are presented as follows (Vargas, 1990). The first one is reciprocal comparison, which means that decision makers can conduct reciprocal comparison of two elements in the same level and can present intensity of preference as a converse condition. The second one is homogeneity, which means that weight can be presented with bounded scale in a limited range. The third one is independence, which means that the characteristics and contents in the same level should not be related to each other when relative weight is evaluated. The fourth one is expectation, which means that hierarchical structure is assumed to be constructed perfectly in the way of satisfying the decision-making purpose.
AHP is comprised of four steps. In the step 1, decision hierarchy is set up. In the step 2, pair-wise comparison of elements are conducted. In the step 3, consistency is checked. In the step 4, results are drawn and priorities are determined. More specifically, in the step 1, or the step of decision hierarchy setup, relevant elements become hierarchized, and the hierarchy is divided into decision goal, relevant decision-making elements in the upper level, and decision-decision-making elements in the lower level. The elements should be applied to pair-wise comparison in the next step 2, so that they should be independent of each other and levels of the hierarchy should be dependent. In the lower level, the elements should be more narrowed down.
ISSN: 2306-9007 Hwan (2016) 228
I
www.irmbrjournal.com March 2016I
nternationalR
eview ofM
anagement andB
usinessR
esearchVol. 5 Issue.1
R
M
B
R
step, it is judged whether the results of a questionnaire survey have consistency logically. The extent of consistency is calculated with Consistency Index (CI) and Consistency Ratio (CR). In this case, if inconsistency index is more than 0.1, the answers of the questionnaire are judged to be contradictory, and if it is lower than 0.2, the answers are accepted. In this procedure, it is possible to increase reliability of the results. In the last step 4, or the step to draw results and determine priorities, the weight and priorities of evaluation criteria are decided on the basis of the values of the examined answers, and thereby it is possible to come to the optimal alternative.
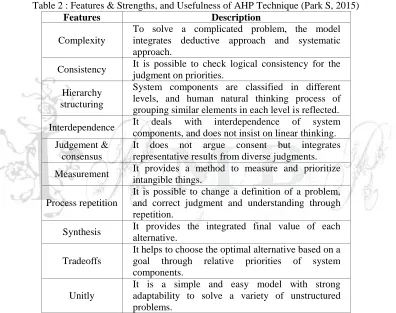
In the US, AHP technique has been used as the means to determine strategic goals in diverse areas, including military, diplomacy, and management. Its effectiveness has been verified. According to Saaty (2008), Jo Geun-tae and Jo Yong-gon and Gang Hyeon-su (2003), Kim Yong-jeong (2013), AHP technique generally has the following usefulness, features, and strengths as shown in the below [Table 2].
Table 2 : Features & Strengths, and Usefulness of AHP Technique (Park S, 2015)
Features Description
Complexity
To solve a complicated problem, the model integrates deductive approach and systematic approach.
Consistency It is possible to check logical consistency for the judgment on priorities.
Hierarchy structuring
System components are classified in different levels, and human natural thinking process of grouping similar elements in each level is reflected.
Interdependence It deals with interdependence of system
components, and does not insist on linear thinking. Judgement &
consensus
It does not argue consent but integrates representative results from diverse judgments.
Measurement It provides a method to measure and prioritize
intangible things.
Process repetition
It is possible to change a definition of a problem, and correct judgment and understanding through repetition.
Synthesis It provides the integrated final value of each
alternative.
Tradeoffs
It helps to choose the optimal alternative based on a
goal through relative priorities of system
components.
Unitly
It is a simple and easy model with strong adaptability to solve a variety of unstructured problems.
Study Method
Selection of Analysis Subject, Analysis Type, and Evaluation Indicator
ISSN: 2306-9007 Hwan (2016) 229
I
www.irmbrjournal.com March 2016I
nternationalR
eview ofM
anagement andB
usinessR
esearchVol. 5 Issue.1
R
M
B
R
Table 3: Evaluation indicators and methods
Analysis types Evaluation indicators Description in detail Evaluation
methods
Competitiveness-Attractiveness
Competitiveness
Market share Evaluates how much a relevant
product has market share. M/S
Business size Evaluates how big the sales of
a relevant product are Sales
Competitive edge
Evaluates whether there are any competitive products of a relevant product and its relative
competitive edge
5-points scale
R&D ability
Evaluates technical development ability and product making
ability
5-points scale
Market
attractiveness
Market growth Evaluates how much a relevant
market grows CAGR
Market size Evaluates how big the size of
a relevant market is Market size
Competition structure
Evaluates the competition
structure of a relevant product 5-points scale
Customer needs Evaluates market demands 5-points scale
Risks-Profits
Success
possibility
Technical success probability
The possibility of technical
development success 5-points scale
Commercial success probability
The possibility of market
entrance success 5-points scale
Strategic success probability
The possibility of meeting the strategic direction of
development division/research institute
5-points scale
Expected return Sales contribution
Evaluates how much is contributed to the sales of
research institute
Sales contribution rate
Invested
Resources-Period
Invested resources
Research cost or Human resource
investment
The state of the distribution of the
cost and human resources invested in development
Research cost, M/Y
Development
period Business period
Development period (short-
term/mid-term/long-ter) Business point
Development of Evaluation Criteria
ISSN: 2306-9007 Hwan (2016) 230
I
www.irmbrjournal.com March 2016I
nternationalR
eview ofM
anagement andB
usinessR
esearchVol. 5 Issue.1
R
M
B
R
Table 4 : Competitiveness vs Attractiveness Evaluation Criteria
Evaluation indicators Evaluation criteria
1 point 2 points 3 points 4 points 5 points
Competitive
ness
Market share
(M/S after five years)
Less than 1% 1%~2% 2%~3% 3%~5% More than 5%
Business size (future 5- years cumulative sales) Less than KRW 10 billion KRW 10-30 billion KRW 30-50 billion KRW 50-100 billion
KRW More than 100 Competitive edge Lower technical competitivenes s than competitors; therefore, there is the problem with
survival
Technology is not developed enough
to develop products independently; therefore staying still as a follower
Following a new technology;
therefore, maintaining a certain extent of
technical competitiveness
Suggesting a new technology
or a direction
Leading the direction or speed of technical development R&D
productivity Idea stage R&D stage
Development completion stage Product making stage Completion of products, or manufacturing & sales Attractivene ss Market growth (future 5- years CAGR)
Less than 10% 10%~20% 20%~30% 30%~50% More than 50%
Market size Less than
KRW 1 trillion KRW 1-2 trillion KRW 2-3 trillion
KRW 3-5 trillion
More than 5 trillion Competition size Fierce competition of relevant firms; the monopoly of a market by
a strong competitor firm or product Fierce competition of relevant firms; the
oligopoly of a market by a strong competitor
firm or product
Multiple competitor firms and products; no leading firm, and market separation
A small number of competitor firms and products; no leading firm, and market separation Almost no competitor firms and products; the
influence on business operation
Customer needs
A very few demands for the developed technology/pro
duct
A few demands for the developed technology/produ
ct
Somewhat demands for the
developed technology/produ ct Large demands for the developed technology/pro duct Very large demands for the
developed technology/prod
ISSN: 2306-9007 Hwan (2016) 231
I
www.irmbrjournal.com March 2016I
nternationalR
eview ofM
anagement andB
usinessR
esearchVol. 5 Issue.1
R
M
B
R
Table 5 : Risks vs Profits Evaluation Criteria
Evaluation indicators Evaluation criteria
1 point 2 points 3 points 4 points 5 points
Risks
Technical, commercial, and strategic success
probabilities
Very low Low Neither high
nor low High Very high
Profits
Expected return
(sales contribution rate)
Less than 1% 1%~3% 3%~5% 5%~10% More than
10%
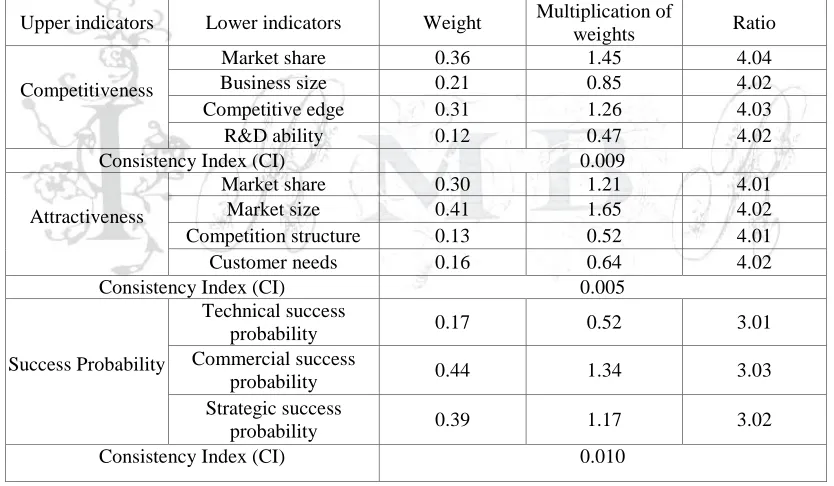
Analysis on weight of evaluation indicators with the use of AHP
AHP technique was applied to draw relative weight of each detailed evaluation indicator in competitiveness-attractiveness analysis and success probability-expected return analysis. The result of the AHP technique application showed that consistency index of all types was evaluated to be lower than the baseline 0.10. Therefore, the weight of each indicator was found reliable.
Table 6 : Results from Pair-wise Comparison of Elements and Consistency Index Examination
Upper indicators Lower indicators Weight Multiplication of
weights Ratio
Competitiveness
Market share 0.36 1.45 4.04
Business size 0.21 0.85 4.02
Competitive edge 0.31 1.26 4.03
R&D ability 0.12 0.47 4.02
Consistency Index (CI) 0.009
Attractiveness
Market share 0.30 1.21 4.01
Market size 0.41 1.65 4.02
Competition structure 0.13 0.52 4.01
Customer needs 0.16 0.64 4.02
Consistency Index (CI) 0.005
Success Probability
Technical success
probability 0.17 0.52 3.01
Commercial success
probability 0.44 1.34 3.03
Strategic success
probability 0.39 1.17 3.02
Consistency Index (CI) 0.010
Result Analysis
ISSN: 2306-9007 Hwan (2016) 232
I
www.irmbrjournal.com March 2016I
nternationalR
eview ofM
anagement andB
usinessR
esearchVol. 5 Issue.1
R
M
B
R
it is necessary to find projects with large market demands and high growth possibility. In the case of the projects in the sections 2 and 4, it is necessary to conduct technical portfolio analysis on each project and thereby to establish a detailed strategy to secure competitiveness.
Based on cumulative sales of each project, competitiveness and attractiveness were analyzed in four sections. Competitiveness was put in the horizontal axis, and attractiveness in the vertical axis. Section 1 features KRW 1,754.5 billion of cumulative sales and 78.4% of sales percentage. Section 2 has KRW 168 billion and 7.5%. Section 3 has KRW 234.5 billion and 10.5%. Section 4 has KRW 80.5 billion and 3.6%. According to the analysis, for the projects in the sections 3 and 4, it is necessary to improve sales, and especially, by improving competitiveness the projects in the section 4, it is possible to put them in the section 2 and therefore it is expected to increase sales percentage. That indicates that the development division or the research institute needs to establish a plan to secure technical competitiveness.
Risks and profits were also analyzed in four sections. Risk indicators ranging from technical, commercial, and strategic success probabilities to calculated success possibility were put in the horizontal axis, and profit indicator (sales contribution rate) was put in the vertical axis. Section 1 has a high success possibility of technical development and business, and the expectation of a high profit. Section 2 has a high success possibility of technical development and business, but a low profit. Section 3 has a higher risk of development than expected return. Section 4 has a low profit and a low development risk. According to the analysis, the R&D projects in the section 1 contributed to more than 90% of the total sales of the research institute. It proved that the R&D projects accounting for around 90% of the sales had a high success possibility. The projects that had less than 1% contribution amounted to around 60%, and the projects that had more than 1% contribution had a large deviation. Therefore, it was found that a very few projects had a great deal of the profitability (sales) of the research institute.
Based on sales contribution rate, risks and profits were also analyzed. On the basis of 1% sales contribution, the projects were classified into the projects with more than 1% and the projects with less than 1%. The projects with more than 1% sales contribution accounted for 37% of all projects analyzed in this study. Given that the projects in the section 2 has the highest success possibility but 1.7% sales contribution, it is necessary to conduct technical portfolio analysis on each project and find a plan to maximize profits. If the portfolio is redesigned in the direction of increasing the sales of most R&D projects which have low profitability, though a high success probability, it is expected to improve largely the expected return of the R&D projects in the research institute.
In the analysis on invested resources and period, the business period was classified into short-term period (less than 5 years), mid-term period (less than 10 years), and long-term period (more than 10 years. It is necessary to distribute resources on the assumption that the adequacy ratio of each period is 70%, 20%, and 10%. In fact, in the case of research cost, the short-term, mid-term, and long-term investment ratios were very similar to the ratios in the adjustment plan. In the case of research manpower, it is considered that it is necessary to move them to short-and long-term business projects from mid-term projects and readjust the manpower.
ISSN: 2306-9007 Hwan (2016) 233
I
www.irmbrjournal.com March 2016I
nternationalR
eview ofM
anagement andB
usinessR
esearchVol. 5 Issue.1
R
M
B
R
Conclusion and Discussion
R&D portfolio management is a series of processes to plan balanced investments in each project choose proper projects according to strategy from the overall corporate perspective. In terms of portfolio management, it is important not only to choose proper projects that will be put in portfolio, but to make a careful and resolute decision on the projects that will be thrown away. R&D portfolio management framework is divided into four main points. First, it is necessary to establish a portfolio strategy to separate investments according to project features. Secondly, it is necessary to perform sufficient preliminary reviews on projects to evaluate and choose projects that contribute to improve insight. Thirdly, it is necessary to analyze and change a portfolio of projects from the viewpoint of portfolio. Fourthly, it is necessary to internalize portfolio management in organization. Lastly, it is necessary to perform R&D portfolio analysis annually and use the analysis results to continue to manage the portfolio of all projects in a research institute.
References
Armstrong, J. S. & Brodie, R. J. (1994), Effects of portfolio planning methods on decision making: Experimental results, International Journal of Research in Marketing, 11(1), 73-84
Chan, F., Kumar, N., Tiwari, M. K., Lau, H. C., Choy, K. L. (2008), Global Supplier Selection : a Fuzzy -
AHP Approach, International Journal of Production Research, 46(14), pp.3825-3857
Choi Dam (2014), A Selection Method of Depot Maintenance Sources using AHP and Decision Index,
Dept. of D.A.Program, The Graduate School Kwangwoon University, Korea
Day, G. S. (1977), Diagnosing the product portfolio, The Journal of Marketing, 29-38
Derkinderen, F. G. & Crum, R. L. (1984), Pitfalls in using portfolio techniques.assessing risk and potential, Long Range Planning, 17(2), 129-136
Geun-tae, Jo Yong-gon, Gang Hyeon-su (2003), The analytic hierarchy prpcess, Donghyun publisher
Kim, Yong Jeong (2013), The Hierarchical Strategy Assessment Model Design and Priority Analysis of Strategic Factors for Logistics Hubbing in International Airport : Focused on Incheon International Airport, Department of International Business Graduate School, Chungbuk National University. Korea Olsen, R. F. & Ellram, L. M. (1997), A portfolio approach to supplier relationships, Industrial Marketing
Management, 26(2), 101-113
Park, Sung No (2015), A Study on Selection Factors for Raw Material Supplier of Cosmetics Company by
Using AHP Method, Department of International Business Graduate School ,Chungbuk National University, Korea
Saaty, T. L. (1980), The Analytic Hierarchy Process : Planning, Priority Setting, McGraw-Hill. New York
Saaty, T. L. (1985), The analytical hierarchy process : What it is and how it is used, Mathematical Modelling, 9(3-5), pp.161-176
Saaty, T. L. (2003), Decision-making with the AHP : Why is the principal eigenvector necessary, European
Journal of Operational Research, 145, pp.85-91
Saaty, T. L. (2008), Decision Making for Leaders : The Analytic Hierarchy Process for Decision in a Complex World, Pittsburgh : RW S Publications
Turnbull, P. W. (1990), A review of portfolio planning models for industrial marketing and purchasing management, European Journal of Marketing, 24(3), 7-22