THE RELATIONS BETWEEN FOREIGN TRADE AND INCOME INEQUALITY:
TURKEY 1980-2014
Sabri Öz
,
(PhD)Istanbul Commerce University, Turkey
Received: July 18, 2017 Accepted: Oct. 02, 2017 Published: Dec. 01, 2017
Abstract
In the world, it is seen that foreign trade is the most important factor together with free capital flow in open economic order. Along with the development of foreign trade, many parameters in the domestic economic order of nations have interacted. The measurement of the open economic order, the indices for determining the level and the changes in the parameters which are used, is gaining importance in terms of being able to produce macro level policies on a national basis. In the study, the indices used for foreign trade were determined, and an econometric analysis was carried out to show the changes in the related indices in terms of income distribution. The analyzes revealed that the Kuznets curriculum was not correct after the 2001 crisis. Foreign trade volume is also supported by this data.
Keywords: Income Inequality, Foreign Trade, Foreign Trade Policy, GINI, Kuznets.
1. Introduction
After the formation of the industrial society in particular, the economic system has been the scene of working on the efficient use of resources and productivity. After the development of the nation states, theories have arisen that every country needs to produce the most productive product in its own territory and that other products must be supplied from other fields that can be produced more efficiently. Whether or not this theory has been realized, the development of the information society and globalization seem to have quickly swept the whole world. An economic understanding has developed that is involved in open economics governance, whether through productivity theory or from globalization-based developments. At the beginning of the twenty-first century in this framework of economic stuation, the issue of income distribution has become more and more important than never been before. Even in agrarian societies since the beginning of economic life, the most important problem is expressed in many literature that it is the matter of equitable reproduction of already produced. While it is not in the first years of the industrial society, especially in the case of the great depression 1929, states seem to have a say in the distribution of income with an interventionist approach. It is the governmental policies of the effecting state which is expressed as secondary income distribution to income distribution. There are different policies that will affect the economic order by the government. The most important of these is undoubtedly fiscal and monetary policies. Beyond fiscal and monetary policies, however, health policy, education policy, industrial and defense industry politics, as well as foreign trade policy are also an important factor. With the intervention of the government by different politics, the distribution of income from time to time narrowing (adversely affected) or expansion (positive impact) is the that the issue.1
In the next section, which will focus on both income distribution and foreign trade measurement indices, and than focusing on after the Turkey's 24th decisions in 1980 modeling a lineer or nonlineer regression model in econometric analysis. In the conclusion section, the information gotten via the analysis and the results obtained in the literature will be evaluated.
2. Income Inequalıty and Foreign Trade Indices
Income distribution is used qualitatively with the concept of justice. It is more accurate to use the notion of inequality when the measurement is entered into the work based on the latent quantity.2 In this context, it is seen that most sources in the literature, especially TÜİK (TURKSTAT), use the GINI coefficient to measure income
distribution inequality.
The TURKSTAT P80 / P20 ratio is presented statistically as a table in household income surveys. There are also other indices for the income inequality.
As indicators of foreign trade, three different index trends and temporal periods are important for comparison. While foreign trade deficit is the most important among these, foreign trade ratio and foreign trade volume indicators are important indicators. These indices are discussed separately below.
2.1. Income Inequality Indices
When examining income distribution in terms of measurement, it is also necessary to mention the income distribution types. There are four types of income distribution; individual income distribution, functional income distribution, sectoral income distribution and regional income distribution.
While the regional income distribution reveals the inequalities arising from the distribution of the income obtained in the regions, the sectoral income distribution also expresses the inequality in the inter-sectoral distribution of the income generated in the sector.
Total income (Gross Domestic Product, GDP) generated in a country in the individual income distribution gives a measure of the inequality between the income to be earned per capita and the income actually earned, while the functional income distribution is related to the share of the variables in the production factors.
The earliest income distribution inequality measurement in Turkey was in 1963. This study was carried out by the DPT (State Planning Organization) on regional income distribution inequality. It is an uncommon fact that regional studies have been carried out for Turkey, which is an agricultural society. Comparisons have also been made on the basis of territorial distribution and sectoral income distribution inequality.3
It is important to know the type and methodology of this work. In this context, the study will focus on individual income distribution. Moreover, individual income distribution could be defined as by TURKSTAT:
“The distribution of the income between individuals or households is in the foreground. Income inequalities in the individual income distributions are determined according to the amount of income of individuals or households. Moreover, it is also possible to classify the income by socio-economic groups, occupations, sectors, regions and education status. Individual income distribution is a good indicator not only for economic but also for social inequalitiy.”
2.2. Lorenz Curve and GINI Coefficient
The Lorenz Curve is a curve that lies below the full equilibrium line (utopian, y = x line) and shows the shares of the cumulative population with respect to the cumulative income. The size of the area between the Lorenz Curve and the full equilibrium line indicates, by order, how good or bad income distribution inequality is. Since, GINI could be calculated as the ratio of the area between y=x and Lorenz Curve over the whole triangle area under y=x;
- GINI would be between 0 and 1,
- As GINI approaches to 0; means a decrease in inequality, and vice versa
- Justice and inequality are certainly different concept;
As inequality is diminishing, justice can be considered as a measure of justice until it is found to be better.
2 Sabri Öz, “Türkiye’de 1980 Sonrası Maliye Politikaları ile Gelir Dağılımı ve Sosyal Adalet İlişkileri”, Basılmamış Doktora Tezi,
İstanbul Üniversitesi, Çalışma Ekonomisi ve Endüstri İlişkileri, 2017, s. 41.
2.3. P80/P20 Ratio
The ratio of P80 / P20 indicates that the richest hill is the twenty percent, and the low-income twenty percent is the value of society. It is preferred that this ratio is low. The comparison from years to years is important in terms of expressing that the income gap between the poorest and the richest are opening or closing. The fact that this rate is rising is accepted as an indication that poverty is deepening.
2.4. Other Indices
Different quantitative measures such as Theil Index, Dalton Index, Atkinson Index, Kuznets Coefficient and various poverty measures are used for income distribution inequality measurement. The Kuznets coefficient is the interpretation of the GINI coefficient in terms of sectoral income distribution. As in GINI, the Kuznets Coefficient is between 0 and 1. The Kuznets coefficient applied for a two-sector economy is equal to zero if the sectoral average is equal to the country average. If the total production is done by one sector and the share of this sector in employment is very insignificant, the value of the coefficient is 1.4 Since the GINI Coefficient is used in the study, the above indices will not be mentioned separately. There is a principle in the literature regarding the criteria to be used for measuring income distribution inequality. One of these principles, the Pigou-Dalton transfer principle, should not lead to an increase in inequality of income transfer from a poor person to a wealthy person, or at least bring about a reduction in income, and a wealthy impoverished income transfer should not lead to a reduction in inequality. In addition to Pigou-Dalton, there are principles of income independence, population, symmetry and separation.5
2.5. Foreign Trade Indices
The aim of the TURKSTAT is to compare and evaluate foreign trade data and to discuss four different indices. These indices can be calculated for both imports and exports, and the final index is calculated together for the two factors. The first three indices are expressed as quantity index, unit index and unit quantity index.
The last index is shown as Foreign Trade Upper Limit. Foreign trade advances; Export unit value index to the import unit value index. The fact that the value of foreign trade is above the value of one hundred means that foreign merchandise sells cheaply according to the base year and sells them cheaply, which shows that there is a situation favoring the country. If foreign trade is small by hundredths, then it means that the country is selling cheaply and getting expensive, which is a contrary situation.6
The indices to be used in the study will be indices which are subject to economic classification and that cover both imports and exports. These indices are expressed as Foreign Trade Volume, Foreign Trade Degree and Foreign Trade Ratio. These indices are explained one by one below.
2.6. Foreign Trade Volume
Foreign trade volume refers to the total value of imports and exports made in one year in one country. This value is also referred to as "transaction volume" in some literature reviews. For the foreign trade, incoterm (import and export type), in which both import and export values will be taken by all other organizations, especially OECD, has been expressed. According to this definition, standardization has been achieved by taking FOB (Free on board) for export and CIF (cost freight and sales including insurance) for import.7 When it is indicated with Foreign Trade Volume (FTv), Export (X) and Import (I) the equation would be as follows:
FTv = X + I.
4 Devlet Planlama Teşkilatı, “Gelir Dağılımı ve Politikaları”, Yedinci Beş Yıllık Kalkınma Planı Özel İhtisas Komisyonu Raporu, Ankara, 1994, s. 8.
5 Coşkun Can Aktan, İstiklal Yaşar Vural, “Gelir Dağılımında Adaletsizlik ve Gelir Eşitsizliği: Terminoloji, Temel Kavramlar ve
Ölçüm Yöntemleri”, Yoksullukla Mücadele Stratejileri, Hak-İş Konfedarasyonu Yayınları, Ankara, 2002, s. 14.
In terms of Foreign Trade Volume, the contribution of the country to globalization is also a measure of significance. If the volume of foreign trade is zero, the country is managed with a closed economy concept.
2.7. Foreign Trade Deficit
Within the scope of acceptance of imports and exports above, the value obtained by extracting imports from exports is expressed as foreign trade deficit (or surplus). If FTd used for Foreign Trade Deficit, the equation would be as follows:
FTd = X – I
Foreign trade deficit is mainly a very important part of the current deficit in terms of countries. Because, foreign exchange is the biggest source of foreign trade comes from. The remainder consists of exchange rate differences and capital flows not covered by imports and exports. On the one hand, it is regarded as an index showing the effect of the net capital flow on the country, which is one of the two important factors brought by the open economy. If this value is zero, it means, import and export values are equal for this country.
2.8. Foreign Trade Ratio
The foreign trade ratio is also usually known as the Foreign Trade Indice is calculated by the ratio of exports over imports value. By showing the foreign trade ratio with the FTr, the equation would be as follows:
FTr = X / I
This rate is actually the ratio between what you sell and what you buy for a country. The desired value for balance of that countries economy is near 1. It takes values higher than zero and when foreign trade deficit conditions are in the range of 0-1, whereas foreign trade surplus would be occured if the ratio is greater than 1.
These definitions have been examined in the following section, which analyzes the change from 1980 to 2014 by GINI, including 1979.
3. Analysıs of Turkey after the 24
thof January Decisions
Turkey has become a turning point with important decisions taken on January 24, 1980 (known as the 24th of January Decisions) in 1980. Following these resolutions, the military revolution took place on September 12, 1982 until the formation of the new constitution. After 1982, it is seen that the decisions of 24th of January, have been applied consistently with the Motherland Party (Anavatan Partisi). For Turkey, the discontinuities and transformations of 1987 and 1994, as well as the great crisis of 2001, are of special importance.8 Foreign trade indices, as well as income distribution fluctuated, as fluctuations have shown and ended with structural transformations in the policies of the state.
The data obtained by TURKSTAT for the period under review is a limited amount in terms of GINI. The number of data obtained for the analysis is rather insufficient for the 1980-2001 period. The GINI values will be incorporated into the analytical and predicted values that are handled with a different approach. These values are data derived from the industry sector data derived by the Texas Institute of Inequality (with the analysis of Enstitute of Households Income Inequality called EHII). This data is available in the thesis entitled as the relationship between income distribution and social justice in post-1980 fiscal policies in Turkey for calculation and acquisition".9 In Table 1 below, the calculated trade values and GINI for the variables defined above are given together.
In the study, linear regressions were made with a single index, assuming that GINI is considered as a dependent variable, and that it is the only independent variable that can be used every time there is a small number of data. However, import and export data do not have a separate correlation with GINI. Similarly, foreign trade deficit (balance) and foreign trade index (X / I) do not form any correlation. Likewise, the logarithmic values of these variables were also looked at and found to be meaningless. However, it is seen that there is a strong correlation between the foreign trade volume and the GINI coefficient by means of the linear regression. The results of this analysis are given below.
The relationship between GINI and foreign trade volume shows a change in GINI values over the period 1979-2001, with an increasing distribution of GDP, along with an income distribution inequality in the disability below
0.45. Looking at the period of 2001-2014, GINI should continue to deteriorate according to the Kuznets curve for Turkey that has not fulfilled the requirements of the industrial society while the GDP is increasing. However, it seems to have reversed the situation in particular in the period of 2001-2006 and the GINI coefficient values are beginning to improve, that is, the inequality has begun to decrease. Assuming that the 2001 crisis was an important turning point, the analysis was reexamined in two parts, 1980-2001 and 2002-2014.
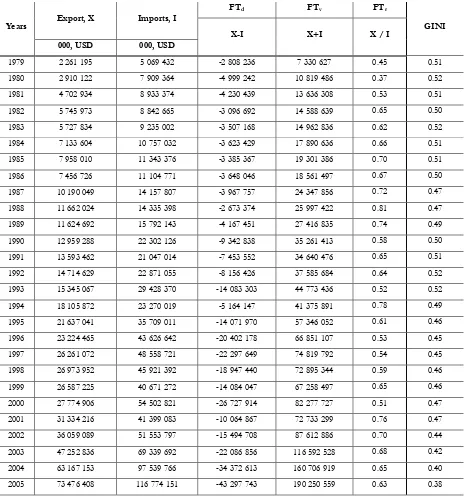
Table 1: Foreign Trade and GINI Indices Values for Turkey During 1979-2014
Years Export, X Imports, I
FTd FTv FTr
GINI
X-I X+I X / I
000, USD 000, USD
1979 2 261 195 5 069 432 -2 808 236 7 330 627 0.45 0.51
1980 2 910 122 7 909 364 -4 999 242 10 819 486 0.37 0.52
1981 4 702 934 8 933 374 -4 230 439 13 636 308 0.53 0.51
1982 5 745 973 8 842 665 -3 096 692 14 588 639 0.65 0.50
1983 5 727 834 9 235 002 -3 507 168 14 962 836 0.62 0.52
1984 7 133 604 10 757 032 -3 623 429 17 890 636 0.66 0.51
1985 7 958 010 11 343 376 -3 385 367 19 301 386 0.70 0.51
1986 7 456 726 11 104 771 -3 648 046 18 561 497 0.67 0.50
1987 10 190 049 14 157 807 -3 967 757 24 347 856 0.72 0.47
1988 11 662 024 14 335 398 -2 673 374 25 997 422 0.81 0.47
1989 11 624 692 15 792 143 -4 167 451 27 416 835 0.74 0.49
1990 12 959 288 22 302 126 -9 342 838 35 261 413 0.58 0.50
1991 13 593 462 21 047 014 -7 453 552 34 640 476 0.65 0.51
1992 14 714 629 22 871 055 -8 156 426 37 585 684 0.64 0.52
1993 15 345 067 29 428 370 -14 083 303 44 773 436 0.52 0.52
1994 18 105 872 23 270 019 -5 164 147 41 375 891 0.78 0.49
1995 21 637 041 35 709 011 -14 071 970 57 346 052 0.61 0.46
1996 23 224 465 43 626 642 -20 402 178 66 851 107 0.53 0.45
1997 26 261 072 48 558 721 -22 297 649 74 819 792 0.54 0.45
1998 26 973 952 45 921 392 -18 947 440 72 895 344 0.59 0.46
1999 26 587 225 40 671 272 -14 084 047 67 258 497 0.65 0.46
2000 27 774 906 54 502 821 -26 727 914 82 277 727 0.51 0.47
2001 31 334 216 41 399 083 -10 064 867 72 733 299 0.76 0.47
2002 36 059 089 51 553 797 -15 494 708 87 612 886 0.70 0.44
2003 47 252 836 69 339 692 -22 086 856 116 592 528 0.68 0.42
2004 63 167 153 97 539 766 -34 372 613 160 706 919 0.65 0.40
2006 85 534 676 139 576 174 -54 041 498 225 110 850 0.61 0.43
2007 107 271 750 170 062 715 -62 790 965 277 334 464 0.63 0.41
2008 132 027 196 201 963 574 -69 936 378 333 990 770 0.65 0.41
2009 102 142 613 140 928 421 -38 785 809 243 071 034 0.72 0.42
2010 113 883 219 185 544 332 - 71 661 113 299 427 551 0.61 0.40
2011 134 906 869 240 841 676 - 105 934 807 375 748 545 0.56 0.40
2012 152 461 737 236 545 141 - 84 083 404 389 006 877 0.64 0.40
2013 151 802 637 251 661 250 - 99 858 613 403 463 887 0.60 0.40
2014 157 610 158 242 177 117 - 84 566 959 399 787 275 0.65 0.39
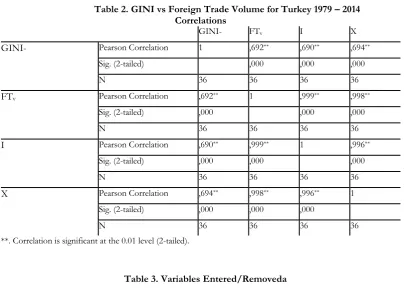
The output obtained for the linear regression of income distribution inequality and foreign trade volume for Turkey after 1980 and after is as follows. The location and magnitude of the 2001 crisis in these 36 data periods is a major break point. In addition, the periods 1979 - 2001 and 2002 - 2014 were considered separately.
Table 2. GINI vs Foreign Trade Volume for Turkey 1979 – 2014 Correlations
GINI- FTv I X
GINI- Pearson Correlation 1 ,692** ,690** ,694**
Sig. (2-tailed) ,000 ,000 ,000
N 36 36 36 36
FTv Pearson Correlation ,692** 1 ,999** ,998**
Sig. (2-tailed) ,000 ,000 ,000
N 36 36 36 36
I Pearson Correlation ,690** ,999** 1 ,996**
Sig. (2-tailed) ,000 ,000 ,000
N 36 36 36 36
X Pearson Correlation ,694** ,998** ,996** 1
Sig. (2-tailed) ,000 ,000 ,000
N 36 36 36 36
**. Correlation is significant at the 0.01 level (2-tailed).
Table 3. Variables Entered/Removeda
Model Variables Entered Variables Removed Method
1 FTvb . Enter
b. All requested variables entered.
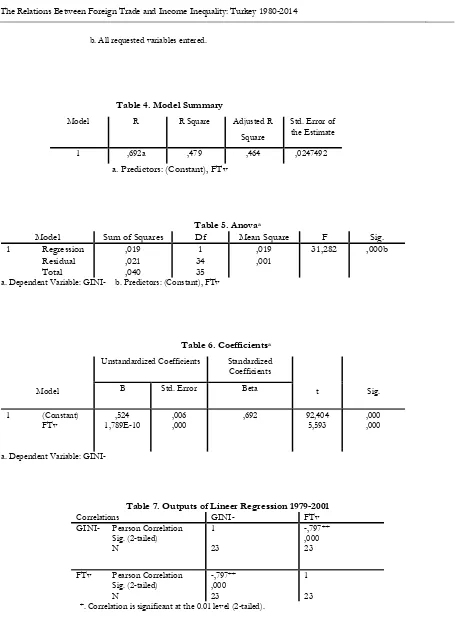
Table 4. Model Summary
Model R R Square Adjusted R
Square
Std. Error of the Estimate
1 ,692a ,479 ,464 ,0247492
a. Predictors: (Constant), FTv
Table 5. Anovaa
Model Sum of Squares Df Mean Square F Sig.
1 Regression Residual Total
,019 ,021 ,040
1 34 35
,019
,001 31,282 ,000b
a. Dependent Variable: GINI- b. Predictors: (Constant), FTv
Table 6. Coefficientsa
Model
Unstandardized Coefficients Standardized Coefficients
t Sig.
B Std. Error Beta
1 (Constant)
FTv 1,789E-10 ,524 ,006 ,000 ,692 92,404 5,593 ,000 ,000
a. Dependent Variable: GINI-
Table 7. Outputs of Lineer Regression 1979-2001
Correlations GINI- FTv
GINI- Pearson Correlation Sig. (2-tailed) N
1
23
-,797** ,000 23
FTv Pearson Correlation Sig. (2-tailed) N
-,797** ,000 23
1
Table 8. The Outputs of Lineer Regression of 2002-2014
Correlations GINI- FTv
GINI- Pearson Correlation Sig. (2-tailed)
N
1
13
,937** ,000 13
FTv Pearson Correlation Sig. (2-tailed)
N
,937** ,000 13
**. Correlation is significant at the 0.01 level (2-tailed).
Table 9. Variables Entered/Removeda
Model Variables
Entered Variables Removed Method
1 FTvb . Enter
a. Dependent Variable: GINI- b. All Requested variables entered.
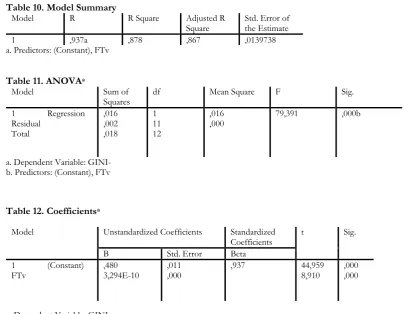
Table 10. Model Summary
Model R R Square Adjusted R
Square Std. Error of the Estimate
1 ,937a ,878 ,867 ,0139738
a. Predictors: (Constant), FTv
Table 11. ANOVAa
Model Sum of
Squares df Mean Square F Sig.
1 Regression
Residual Total
,016 ,002 ,018
1 11 12
,016
,000 79,391 ,000b
a. Dependent Variable: GINI- b. Predictors: (Constant), FTv
Table 12. Coefficientsa
Model Unstandardized Coefficients Standardized
Coefficients
t Sig.
B Std. Error Beta
1 (Constant)
FTv
,480 3,294E-10
,011 ,000
,937 44,959
8,910
,000 ,000
In the first part of the study, it was stated that the government formed secondary income distribution by affecting/changin/applying different economic and social policies. Fiscal and monetary policies were also emphasized as the main factor. In many sources foreign trade policies are taken out of the scope of fiscal policies. One of the most important factors in the distribution of income is foreign trade policies. Changes in foreign trade affect income disparity inequality positively or negatively. Depending on the efficiency principle, a statutory regulation that will prescribe the good operation of the land will bring intervention to the agriculture sector by the state. This will cause a change in the life style and disposable income of the household. During the years of 2000’s, financial support based on agriculture was increased in Turkey. This is why household incomes of farmers are affected. The importation of some of the agricultural products to be consumed in the country will be affected by the level of income for the sector producing the same agricultural products and accordingly the income distribution. In recent years, Turkey's imports of food, especially meat, have affected the income of agricultural and livestock sector representatives who are interested in the same products, as well as the change in expenditure items and income of the other households (mainly expense). In such a case, a sector with reduced income will be reflected in the distribution of individual income as well as the distribution of sectoral income.
In Turkey, the development in foreign trade was mainly realized by the implementation of the January 24th decisions including the post-1980 neo-liberal approaches. Findings in the analysis show that for the period of 2001 - 2014, the growth of foreign trade volume and GINI value affect the decrease of inequality. Especially in the first six-year period (2001-2007), the decline in GINI value was not confirmed by the Kuznets theory.10 Similar cases are seen in different literatüre review.11
An increase in total international trade volume as of foreign trade volume, can also affect income distribution. At that point, it is useful to study in two separate stages, developing countries and developed countries. Because it (increase in total international trade volume) has a negative effect on developing countries, it can affect the inequality reduction in developed countries. The fact that the international trade for the world is increasing causes a negative effect on the global inequality.12 This fact is important for this study as it is important that different effects are emerging in terms of countries with different levels of development and also that fiscal policies are factors outside the effects on income distribution. It is not wrong to say that social justice is affected in the same parallels as it affects income disparity inequality positively or negatively. This is because negative impacts of income distribution inequality are more likely to be caused by low income groups in developing countries. According to Stolper-Samuelson teory, open economy would causes to get a balance at the production factors and prices13. However, it differs about the level of the developement of the countries, and actually causes a negative affect, so that would not create an internalization of the externalities14 and hence, no positive affect would be occured in the income inequality and also social justice.15
4. Conclusion
As a clear finding, as a dependent variable of GINI coefficient values, are not correlated with imports, exports, foreign trade deficits and foreign trade ratio but are strongly correlated with foreign trade volume. While analyzing the 1980-2014 period in the study, when the analysis was carried out in two parts before and after the crisis period of 2001, which can be considered as the domestic crisis of Turkey, it shares the same view with the Kuznets curriculum
10 Sabri Öz, “Dış Ticaret ve Gelir Dağılımı”, (Çevrimiçi) http://www.sabrioz.com/yayinlarim/disticaretvegelirdagilimi.pdf, 22
Ekim 2016.
11 Cem Dişbudak, Bora Süslü, “Kalkınma ve Bireysel Gelir Dağılımı: Kuznets Hipotezi Türkiye İçin Geçerli mi?”, Akdeniz İ.İ.B.F. Dergisi, Sayı 18, 2009, s. 146.
12 Satheesh Aradhyula, Tauhidur Rahman, Kamuran Seenivasan, “Impact of International Trade on Income and income
Inequality”, American Agricultural Economics Associating Annual Meeting, University of Arizona, Portland, August 2007, p. 36.
13 M. Faysal Gökalp, Ercan Baldemir, Gonca Akgün, “Türkiye Ekonomisinde Dışa Açılma ve Gelir Eşitsizlikleri İlişkisi”, İ.İ.B.F. Dergisi, Celal Bayar Üniversitesi, Cilt 18, Sayı 1, Manisa, 2011, s. 88
during 1980-2001 but especially first six years of second part period namelly 2001-2007, when the GINI value decreased in particular, it does not have the same findings with Kuznets. This is due to the level of developing country of Turkey. As indicated the sectors of expanding the government income, would also be important factor for the changing direction of GINI coefficient value. As GINI and hence income inequality decreases, social justice would be affected positively. As its own level of developing country, the increase in foreign trade volume is expected to have positive effects on income distribution and social justice for Turkey especially after 2001.
As an advice for subsequent studies, for a developing country it should be handled with the Kuznets and the level of income distribution for different countries. Also, should be chequed out the indicies of that countries may have different correlations other than linear equations. As a developing country, Turkey, sghould increase its foreign trade volume and give additional kredits for both export and import operations, and hence as a fiscal policy it should be increased by foreign trade expenditures. Gaining more data by coming years the analysis should be carried on.
References
Aradhyula, Satheesh, Tauhidur Rahman, Kamuran Seenivasan, “Impact of International Trade on Income and income Inequality”, American Agricultural Economics Associating Annual Meeting, University of Arizona, Portland, August 2007.
Aksu, Ömer, Gelir ve Servet Dağılımı, İ.U. Yayınları, Yayın No: 3698, İstanbul, 1993.
Aktan, Coşkun Can, İstiklal Yaşar Vural, “Gelir Dağılımında Adaletsizlik ve Gelir Eşitsizliği: Terminoloji, Temel Kavramlar ve Ölçüm Yöntemleri”, Yoksullukla Mücadele Stratejileri, Hak-İş Konfedarasyonu Yayınları, Ankara, 2002.
Bulutay, Tuncer, Serim Timur, Hasan Ersel, Türkiye’de Gelir Dağılımı – 1968, Sevinç Matbaası, Ankara, 1971. Devlet Planlama Teşkilatı, “Gelir Dağılımı ve Politikaları”, Yedinci Beş Yıllık Kalkınma Planı Özel İhtisas
Komisyonu Raporu, Ankara, 1994.
Dişbudak, Cem, Bora Süslü, “Kalkınma ve Bireysel Gelir Dağılımı: Kuznets Hipotezi Türkiye İçin Geçerli mi?”,
Akdeniz İ.İ.B.F. Dergisi, Sayı 18, 2009, ss. 142-159.
Gökalp, M. Faysal, Ercan Baldemir, Gonca Akgün, “Türkiye Ekonomisinde Dışa Açılma ve Gelir Eşitsizlikleri İlişkisi”, İ.İ.B.F. Dergisi, Celal Bayar Üniversitesi, Cilt 18, Sayı 1, Manisa, 2011, pp. 1-4.
Kazgan, Gülten, Türkiye Ekonomisinde Krizler (1929-2009), İstanbul Bilgi Üniversitesi Yayınları, 4. Baskı, 2013. Öz, Sabri, “Türkiye’de 1980 Sonrası Maliye Politikaları ile Gelir Dağılımı ve Sosyal Adalet İlişkileri”, Basılmamış
Doktora Tezi, İstanbul Üniversitesi, Çalışma Ekonomisi ve Endüstri İlişkileri, 2017.
Öz, Sabri, “Dış Ticaret ve Gelir Dağılımı”, (Çevrimiçi)
http://www.sabrioz.com/yayinlarim/disticaretvegelirdagilimi.pdf, 22 Ekim 2016. Öztürk, Nazım, Kamu Maliyesi, Ekin Yayınları, Bursa, 2015, s. 44.