Print ISSN: 2383-451X Online ISSN: 2383-4501 Web Page: https://jpoll.ut.ac.ir, Email: [email protected]
Optimization of Significant Factors on the Microbial
Decolorization of Azo Dye in an Aqueous Medium by Design of
Experiments
Palanivelan, R.1*, Ayyasamy, P.M.1 and Ramya, S.2
1. Department of Microbiology, Periyar University, Salem - 636 011, Tamil nadu, India
2. Department of Microbiology, DKM College for Women, Vellore – 632 001, Tamil nadu, India
Received: 1.3.2018 Accepted: 4.07.2018
ABSTRACT: Currently, the reduction of reactive dyes present in the textile effluent is a big challenge due to the threat to the environment. Existing physical and chemical methods contains many drawbacks. In the present scenario microbial reduction pays much attention and current focus of research. Therefore, the present study isolated dye decolorizing bacterium Exiguiobacterium aurantiacum (TSL7) from activated sludge and identified by molecular techniques and 16S rDNA sequences. Decolorization was not established in Bushnell hass broth composition in accordance with absence of carbon and nitrogen source. The three environmental factors pH, starch and beef extract were selected from Plackett-Burman design experiments. The central composite design was employed to optimize the maximum removal of remazol golden yellow (91.83%) with pH, 6.89, starch, 0.49% (w/v) and beef extract 0.67% (w/v) respectively, These key factors playing a major role in the bacterial dye removal and the interactions were evaluated statistically. The optimal value of significant factors supports to maximize the dye removal competency of isolated bacterium. Thus results exhibited that local salt tolerant bacterium Exiguiobacterium aurantiacum (TSL7) could be a potential candidate for an in situ-bioremediation of inorganic salts abundant textile effluents in the textile industry.
Keywords: Color removal, Cultural conditions, Halophiles, Statistical tools, Validation.
INTRODUCTION
The textile industry is playing an important role in the economic development of the Indian sub-continent, discharging of waste water from textile industry pollutes both aquatic and terrestrial ecosystems. They affect the physical-chemical characteristics of the receiving water bodies, aquatic flora and fauna (Feng et al., 2014). Generation of wastes from textile industries normally contains the organic and inorganic pollutants which include pigments, lubricants,
*Corresponding Author, Email: [email protected]
Various physical and chemical treatment methods such as flocculation, electrochemistry, ozonation, bleaching, membrane filtration, irradiation, activated carbon and adsorption are commonly adopted for the treatment of textile effluents (Kalpana et al., 2012).
The utility of physical and chemical processes has been limited due to their expensive operation and subsequent disposable problem of generating sludge as secondary pollutants. Owing to these limitations in the treatment of textile wastewater, the most versatile and environmentally friendly technology is a biological process (Lalnunhlimi et al., 2016). Microbiological treatments of textile effluent have gained much imperative by environmentalists due to their cost effectiveness and lower sludge production (Dubrow et al., 1996).
In the last few decades, many microorganisms from different taxonomic
groups were accounted in the
decolorization of textile dyes. However, such microbes are unable to withstand in higher saline concentration. Because textile industries utilizing higher quantity of salt for fixation of dyes on textile fibers. Salt concentrations up to 15-20% were reported in textile industrial waste water and dyestuff industries. Sodium levels are also elevated in the dye baths, when sodium hydroxide (40-100 g/l) is used to increase the maximum fixation of dyes to fibers (Khalid et al., 2008). Bacterial decolorization is versatile and faster compared to other microbes (Gopinath et al., 2011). High salt concentration of waste water may cause plasmolysis and/or loss of microbial activity of cells. Currently studying initiated on decolorization of textile dyes by halophilic microorganisms, for instance the genus Halomonas and
Shewanella (Amoozegar et al., 2011).
Investigation on salt tolerant
microorganisms which are capable of textile dye decolorization is greater and
important one. In addition, environmental factors such as pH, temperature, inoculums size, dye concentration, incubation period and co-metabolic nutritional sources were influenced in bio-decolorization of dyes (Kuhad et al., 2004; Guadie et al., 2017).
Earlier reports suggest the optimization of the responsible factors for the successive bacterial decolorization (Kim et al., 2008; Yan et al., 2012). Recently bio-statistical tools includes design of experiments with response surface methodology (RSM) were employed to achieve the optimal condition of biological process. Therefore the present study was designed to screen a halo tolerant bacterium from textile salt contaminated source to capable of decolorizing dye. Molecular analysis of 16S rDNA sequencing method was used for the bacterial identification. The environmental factors which may affect the bacterial decolorization efficiency were optimized by Design of Experiments (Plackett-Burman design & Central composite design) to obtain optimal region for effective dye removal.
MATERIALS AND METHODS
The dye contaminated sludge was collected from a textile industry located in Tripur, Tamil Nadu, India. The pour plate method was employed to enumerate bacteria on salt tolerant medium containing (g/L): 4g of peptone, 50g of NaCl, 1g of NH4Cl, 1g
of NaHCO3, 0.2g of K2HPO4, 0.2g of
MgSO4.7H2O, 3g of yeast extract and 20g
growth in all the concentrations of dye was observed and the deserved bacterial isolate was preferred to further decolorization studies (Kaur et al., 2015).
The prospective dye decolorizing bacterial isolate was identified by 16S rDNA sequencing method. The genomic
DNA isolation, extraction, PCR
amplification and 16S rDNA sequencing of the amplified gene was carried out in Xcelris Labs Ltd, Ahmedabad, India. The obtained consensus nucleotide sequences were analyzed with existing nucleotide sequences from NCBI server at the blast site and the sequences was aligned with multiple alignment software program Clustal W. The phylogenetic tree was constructed by using Neighbour Joining method in MEGA version (5.0) software.
Aqueous decolorization study was carried out quantitatively using 100 ml of various culture media in 250 ml flasks. The media of Luria Bertani broth containing (g/l): 10g of casein enzymic hydrolysate, 5g of yeast extract and 10g of NaCl; Yeast Extract broth containing (g/L): 5g of yeast extract and 5g of NaCl; Bushnell Hass broth containing (g/l): 2g of MgSO4, 1g of
K2HPO4, 0.02g of CaCl2, 0.05g of FeCl3
and 1g of NH4NO3 was prepared
respectively supplemented with 100 mg/l of remazol golden yellow dye. The media were sterilized at 121° C for 15 min and allowed to cool. About 1% of the overnight grown culture of Exiguobacterium aurantiacum
TSL7 was inoculated in each flask and kept at 37° C for 3 days under static condition. Experiments were carried out in triplicate with abiotic controls. At the end of every 24 hrs, the decolorizing broth samples were aseptically transferred and centrifuged at
3000 rpm for 20 min. The optical density (OD) value of cell free supernatant was
analyzed by using UV Visible
spectrophotometer (Cyberlab UV-100 USA) at 412 nm for remazol golden yellow dye (Gopinath et al., 2011). The decolorization percentage (D %) was determined by the Equation (1), where A1 and A2 are the initial and final absorbance value.
100 A1
A2 -A1 = (%)
D (1)
Screening of significant factors on
Remazol Golden Yellow dye
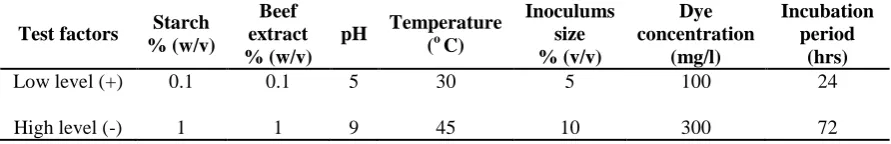
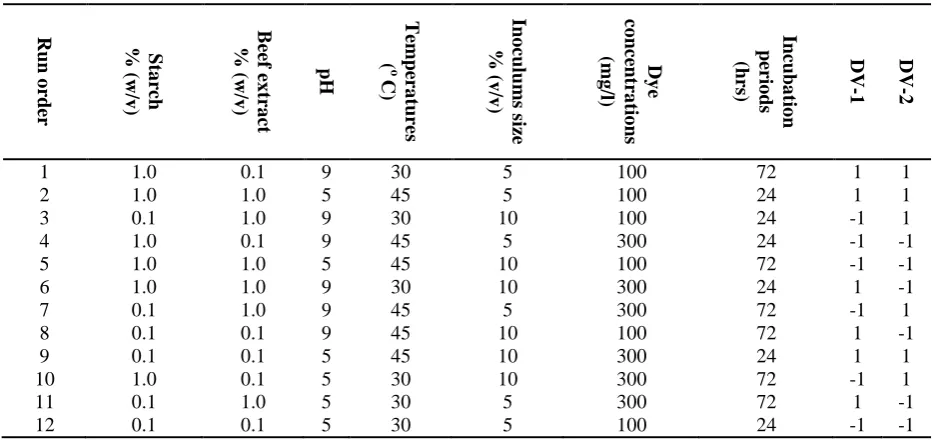
decolorization by E. aurantiacum TSL7 was carried out using 2 k-factorial Plackett-Burman. The Plackett-Burman design was also utilized to know the effect of environmental factors on effective dye decolorization. The tested cultural factors were selected on the basis of previous reports and their actual values are given in Table 1. Plackett-Burman design (Table 2) investigated based on the following first-order model Equation (2).
2
0 i i ij i ij i i
Y X X X X (2)
where Y is the percentage of decolorization as response, Xi is factor levels, i is factor
number, β0 is the model intercepts term, βi
is the linear effect, βii is the squared effect, βijis the interaction effect. As per the Plackett-Burman design in a basal broth medium, experiments were replicated in 250 ml flasks under static incubation with their abiotic controls and the averages of decolorization percentage were taken as responses. Estimation of the regression coefficients and prediction of the fittest model of the response was done using statistical software Minitab Version 15.0.
Table 1. Actual values of factors for Plackett-Burman design
Test factors Starch
% (w/v)
Beef extract % (w/v)
pH Temperature
(o C)
Inoculums size % (v/v)
Dye concentration
(mg/l)
Incubation period
(hrs)
Low level (+) 0.1 0.1 5 30 5 100 24
Table 2. Plackett-Burman design for screening of significant factors
Run o
rder
Sta
rc
h
%
(w/v
)
B
ee
f ex
tra
ct
%
(w/v
)
pH
T
empera
ture
s
( o
C)
Ino
culu
ms
s
ize
%
(v
/v
)
Dy
e
co
ncent
ra
tio
ns
(mg
/l)
Incub
a
tio
n
perio
ds
(hrs
)
DV
-1
DV
-2
1 1.0 0.1 9 30 5 100 72 1 1
2 1.0 1.0 5 45 5 100 24 1 1
3 0.1 1.0 9 30 10 100 24 -1 1
4 1.0 0.1 9 45 5 300 24 -1 -1
5 1.0 1.0 5 45 10 100 72 -1 -1
6 1.0 1.0 9 30 10 300 24 1 -1
7 0.1 1.0 9 45 5 300 72 -1 1
8 0.1 0.1 9 45 10 100 72 1 -1
9 0.1 0.1 5 45 10 300 24 1 1
10 1.0 0.1 5 30 10 300 72 -1 1
11 0.1 1.0 5 30 5 300 72 1 -1
12 0.1 0.1 5 30 5 100 24 -1 -1
DV 1 & 2 - Dummy variable; +1 denoted for high concentration; -1 denoted for low concentration
Plackett-Burman design outputs with a full factorial central composite design was
employed in Response surface
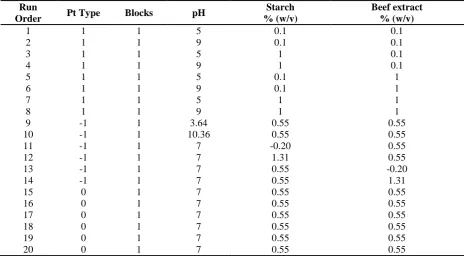
methodology (RSM) to optimize the significant factors influences in remazol golden yellow dye decolorization by E. aurantiacum (TSL7). RSM is generally used to study the relationship and the interrelationship of significant factors and their effect on responses. The significant factors such as pH, starch and beef extract were identified by preceding studies and their actual values were shown in Table 3. Where α = 2n/3; here “n” corresponds to the
number of factors and “0” corresponds to the central point in the central composite design (Table 4). The actual values of significant factors were calculated using the following Equation (3), where Av, H and L are actual value, high level and low level.
2 / L) -(H
2 / L) (H -Av value
Coded (3)
The other operational factors used in this study were maintained in constant level, they were sodium chloride 0.5 %
(w/v), dye concentration 200 mg/l, 18 hour cultures (OD 610nm = 0.5) of inoculums size 7.5% (v/v), temperature 37° C and incubation period 48 hrs. The central composite design was adapted with the following linear quadratic model Equation (4) to establish the correlation between significant factors and response.
0 1 1 2 2 3 3
2 2 2
11 1 22 2 33 3
12 1 2 13 1 3 23 2 3
Y X X X
X X X
X X X X X X
(4)
where Y is the response, β0 is the intercept
term, β1, β2 and β3 are linear coefficient of
tested factors, β11, β22, β33 are quadratic
coefficient, β12, β13, β23 are interaction
coefficient, and X1, X2 , X3, X4 are coded
Table 3. Actual values of the significant factors for CCD
Factors Unit Five Levels of factors
-α (-1.68179) -1 0 1 +α (+1.68179)
pH - 3.636414 5 7 9 10.36359
Starch % (w/v) -0.20681 0.1 0.55 1 1.306807
Beef extract % (w/v) -0.20681 0.1 0.55 1 1.306807
Table 4. Central composite design for optimization of Textile dye decolorization
Run
Order Pt Type Blocks pH
Starch % (w/v)
Beef extract % (w/v)
1 1 1 5 0.1 0.1
2 1 1 9 0.1 0.1
3 1 1 5 1 0.1
4 1 1 9 1 0.1
5 1 1 5 0.1 1
6 1 1 9 0.1 1
7 1 1 5 1 1
8 1 1 9 1 1
9 -1 1 3.64 0.55 0.55
10 -1 1 10.36 0.55 0.55
11 -1 1 7 -0.20 0.55
12 -1 1 7 1.31 0.55
13 -1 1 7 0.55 -0.20
14 -1 1 7 0.55 1.31
15 0 1 7 0.55 0.55
16 0 1 7 0.55 0.55
17 0 1 7 0.55 0.55
18 0 1 7 0.55 0.55
19 0 1 7 0.55 0.55
20 0 1 7 0.55 0.55
RESULTS AND DISCUSSION
A total of 36 distinctive bacterial strains were isolated from the dye contaminated activated sludge sample on salt tolerant medium. Microorganisms are those cultivated from textile industrial waste and their contaminated sites have survival ability and adapted to extreme conditions (Solis et al., 2012). Isolated bacterial strains were examined for their decolorization efficiency at different concentrations (50-250 mg/l) of Remazol Golden Yellow dye in Luria Bertani medium. There are 12 bacterial isolates noticed with a zone of clearance at 100 mg/l concentration of RNL dye amended petri dishes. Jadhav et al., (2008) stated that increasing concentration of dye gradually decreases the efficiency of bacteria due to the lethal effect of higher
dye concentration. Generally the microbial decolorization of azo dyes involves the reduction of azo bond cleavage by azoreductase enzymes resulted in the formation of the colorless zone (Van der Zee and Villaverde 2005). Of these tested concentrations, bacterium TSL7 showed remarkable decolorized zone in all the concentrations of dye and it was subjected to dye decolourization in aqueous medium.
The comparison of 16S rDNA sequencing data with nucleotide sequences of the NCBI database by BLAST analysis revealed that strain TSL7 was closely interrelated to the members of the genus Exiguobacterium sp. Phylogenetic tree revealed that isolate TSL7 had a 92% resemblance with E. aurantiacum
GenBank under accession number JQ885975. Zhuang et al., (2010) reported that halophilic bacterial communities of
Exiguobacterium sp. from saline wastewater and soil. Similarly, Chen et al., (2011) reported that textile dye decolorizing bacterial species E. acetylicum NIU-K2 and
E.indicum NIU-K4 was indigenous salt-tolerant bacterial strains isolated from seawater. Further, we investigated to disclose the dye removal ability of native salt tolerant bacteria E. aurantiacum isolated from textile sludge.
At this phase, the decolorization efficiency of E. aurantiacum (TSL7) was compared in diverse broth composition. Initial 24 hrs, about 69.78% decolorization was occurred in Luria Bertani as growth medium and it was reached up to 97.23% at the end of 48 hrs. Amendment of casein enzymic hydrolyzate as a vitamin source augments the cell growth and their action on decolorization in Luria Bertani medium. Similar to Luria Bertani composition,
Bacillus cohnii MTCC 3616, an obligate alkaliphilic bacterium showed 95% of decolorization of Direct Red-22 under static conditions (Arun Prasad et al., 2011). In yeast extract broth 27.9 and 62.03% of Remazol golden yellow removal was found between 24 - 48 hrs intervals respectively. Ultimately, about 73.81% decolorization was achieved in the 72 hrs incubation. Yeast extract enhanced the dye decolorization via regeneration of electron donor NADH (Khalid et al., 2008). Besides, our studies noticed that E. aurantiacum (TSL7) could not have ability to decolorize the remazol golden yellow dye in bushnell hass broth medium with extensive incubation. Absence of nutritional sources in the medium signifies the essentiality of co-metabolite incorporation for bacterial growth and decolorization (Nigam et al., 1996).
The significant factors of remazol golden yellow dye decolorization using E. aurantiacum (TSL7) were analyzed by Plackett-Burman design (PBD). There are 12 experiments were made with 7 important factors and the dye removal rate was varied from 3.01 to 40.23% (Table 5). These output deviations revealed the relative importance of significant factor optimization to achieve maximum color removal. The statistical analysis of regression coefficients, student’s t- test and P-value of independent factors were shown in Table 6. The factor coefficient value indicates that increases in their concentration of beef extract, pH and inoculums size showed a positive influence on remazol golden yellow decolorization. On the reverse, decreasing the other studied factors such as starch, temperature, dye concentration and incubation period had a negative influence on decolorization. The inappropriate magnitude of cells to maximum concentration of dye affects the decolorization reaction (Jadhav et al., 2008). In addition, of starch rapidly removes the dye by salt tolerant bacteria E. aurantiacum (TSL7), also the textile effluent naturally contains a higher content of starch obtained from sizing process (Dos Santos et al., 2007). Moreover, the higher temperature impacts on microorganisms growth and dye reduction rates. In contrast, Pearce et al., (2003) reported that azoreductase enzyme is moderately thermostable and dynamically active at 60° C temperature. The variable’s coefficient value nearer to zero designates the absence of effect (Du et al., 2012). In the present study, the factors with confidence levels greater than 90% were considered as a significant one. The significant factors effect on the decolorization process is explained by regression Equation (5).
Y 12.422 4.510 starch 4.333 beef extract 5.110 pH 2.550 temperature
2.397 inoculum size 3.020 dye concentration 2.638 incubation period
Table 5. Plackett-Burman design experiments decolorization (%)
Ru n ord
er
Starc h % (w/v)
Beef extra ct % (w/v)
p H
Temperat ures
(o C)
Inoculu ms size % (v/v)
Dye concentrati
ons (mg/l)
Incubati on periods
(hrs)
Percentage decolorization
Experiment
al Predicted
1 1.0 0.1 9 30 5 100 72 7.17 9.22
2 1.0 1.0 5 45 5 100 24 8.84 7.84
3 0.1 1.0 9 30 10 100 24 40.23 36.98
4 1.0 0.1 9 45 5 300 24 3.01 3.36
5 1.0 1.0 5 45 10 100 72 6.32 7.36
6 1.0 1.0 9 30 10 300 24 18.66 21.92
7 0.1 1.0 9 45 5 300 72 20.72 15.77
8 0.1 0.1 9 45 10 100 72 15.34 17.93
9 0.1 0.1 5 45 10 300 24 4.66 6.953
10 1.0 0.1 5 30 10 300 72 3.45 -2.24
11 0.1 1.0 5 30 5 300 72 5.65 10.65
12 0.1 0.1 5 30 5 100 24 14.70 13.3
Table 6. Statistical analysis of Plackett-Burman design
S. No Variables Effect Coef Se Coef T P
1 Constant 12.422 1.604 7.74 0.001*
2 Starch -9.020 -4.510 1.604 -2.81 0.048*
3 Beef extract 8.667 4.333 1.604 2.70 0.054*
4 pH 10.220 5.110 1.604 3.19 0.033*
5 Temperatures -5.100 -2.550 1.604 -1.59 0.187
6 Inoculums size 4.793 2.397 1.604 1.49 0.210
7 Dye concentrations -6.040 -3.020 1.604 -1.88 0.133
8 Incubation periods -5.277 -2.638 1.604 -1.64 0.175
R-Sq = 90.09% R-Sq (adj) = 72.74%
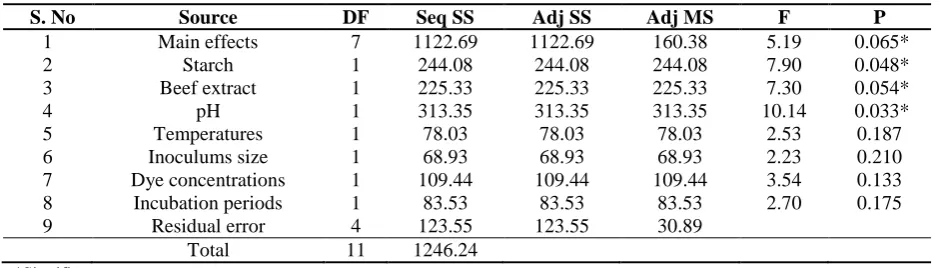
Table 7. ANOVA for Plackett-Burman design
S. No Source DF Seq SS Adj SS Adj MS F P
1 Main effects 7 1122.69 1122.69 160.38 5.19 0.065*
2 Starch 1 244.08 244.08 244.08 7.90 0.048*
3 Beef extract 1 225.33 225.33 225.33 7.30 0.054*
4 pH 1 313.35 313.35 313.35 10.14 0.033*
5 Temperatures 1 78.03 78.03 78.03 2.53 0.187
6 Inoculums size 1 68.93 68.93 68.93 2.23 0.210
7 Dye concentrations 1 109.44 109.44 109.44 3.54 0.133
8 Incubation periods 1 83.53 83.53 83.53 2.70 0.175
9 Residual error 4 123.55 123.55 30.89
Total 11 1246.24
*Significant
The fittest model was confirmed by the determination of correlation coefficient (R2 = 0.9009) is nearer to 1 denoted for a good statistical simulation between the experimental and predicted responses, which shows that the model can explain up to 90.09% variation in the experiment. Analysis of variance (ANOVA) for the linear model was given in Table 7.
significance (p=0.10) of factors. From this statistically analyzed data, pH, starch, beef extract were founded as significant factors in the dye decolorization process using E. aurantiacum (TSL7).
The significant factors were pH, starch and beef extract that influences in the dye removal using E. aurantiacum (TSL7) was
optimized by response surface
methodology (RSM). As per the central composite design (CCD), the dye removal rate varied from 6.5 to 90% (Table 8). Second order polynomial model Equation (6) was adopted with central composite
design results to enlighten the dependence of dye removal percentage in the medium. Student’s t-test, f-test values of factors involved in the dye decolorization and estimated regression coefficient for the model was given in Table 9.
The magnitude of the coefficient of overall effect of the factors has noticed that presence of high significance (p=0) on decolorization process. Correlation coefficient (R2) was determined by regression analysis and it was found to be 87.57% delivered the presence of a good correlation between the factors and response.
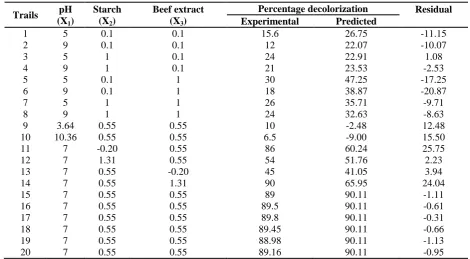
Table 8. Central composite design experiments decolorization (%)
Trails pH
(X1)
Starch
(X2)
Beef extract
(X3)
Percentage decolorization Residual
Experimental Predicted
1 5 0.1 0.1 15.6 26.75 -11.15
2 9 0.1 0.1 12 22.07 -10.07
3 5 1 0.1 24 22.91 1.08
4 9 1 0.1 21 23.53 -2.53
5 5 0.1 1 30 47.25 -17.25
6 9 0.1 1 18 38.87 -20.87
7 5 1 1 26 35.71 -9.71
8 9 1 1 24 32.63 -8.63
9 3.64 0.55 0.55 10 -2.48 12.48
10 10.36 0.55 0.55 6.5 -9.00 15.50
11 7 -0.20 0.55 86 60.24 25.75
12 7 1.31 0.55 54 51.76 2.23
13 7 0.55 -0.20 45 41.05 3.94
14 7 0.55 1.31 90 65.95 24.04
15 7 0.55 0.55 89 90.11 -1.11
16 7 0.55 0.55 89.5 90.11 -0.61
17 7 0.55 0.55 89.8 90.11 -0.31
18 7 0.55 0.55 89.45 90.11 -0.66
19 7 0.55 0.55 88.98 90.11 -1.13
20 7 0.55 0.55 89.16 90.11 -0.95
Table 9. Statistical analysis of central composite design
S. No Variables Coef SE Coef T P
1 Constant 90.1154 6.823 13.207 0.000*
2 pH -1.9394 4.527 -0.428 0.677
3 Starch -2.5202 4.527 -0.557 0.590
4 Beef extract 7.4015 4.527 1.635 0.133
5 pH*pH -33.8916 4.407 -7.690 0.000*
6 Starch*Starch -12.0597 4.407 -2.736 0.021*
7 Beef extract*Beef extract -12.9435 4.407 -2.937 0.015*
8 pH*Starch 1.3250 5.915 0.224 0.827
9 pH*Beef extract -0.9250 5.915 -0.516 0.879
10 Starch*Beef extract -1.9250 5.915 -0.325 0.752
R-Sq = 87.57% R-Sq (adj) = 76.39%
2 2
1 2 3 1 2
2
3 1 2 1 3 2 3
Y 90.1154 1.9394 X 2.5202 X 7.4015 X 33.8916 X 12.0597 X
12.9435 X 1.3250 X X 0.9250 X X 1.9250 X X
(6)
where Y is dependent variable or predicted dye decolorization (%), X1, X2 and X3 were
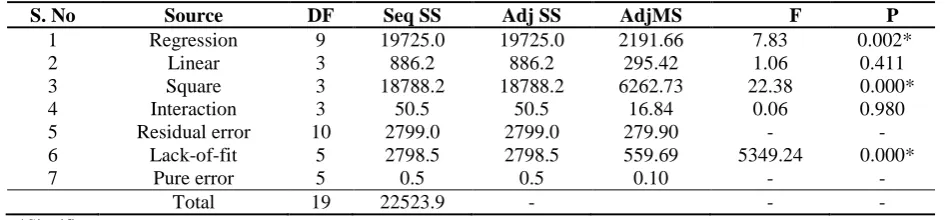
the coded values of independent variables as pH, starch and beef extract respectively. In analysis of variance, the calculated F-value = 7.83 and probability F-value = 0.002 indicates the model is highly significant to predict the results of remazol golden yellow dye decolorization (Table 10). The quadratic (p=0) effect of the variables had
greater influence on the response. Contour plots for the optimization of significant factors influence in dye decolorization are illustrated in Figure 1, Figure 2 and Figure 3. These figures represent the relationship and interaction effect of two factors with varying tested concentrations on dye decolorization, whereas the third factor was maintained at the middle level.
Fig. 1,2,3. Effect of Beef extract, pH and Starch concentration on dye decolorization (%)
Table 10. ANOVA for central composite design
S. No Source DF Seq SS Adj SS AdjMS F P
1 Regression 9 19725.0 19725.0 2191.66 7.83 0.002*
2 Linear 3 886.2 886.2 295.42 1.06 0.411
3 Square 3 18788.2 18788.2 6262.73 22.38 0.000*
4 Interaction 3 50.5 50.5 16.84 0.06 0.980
5 Residual error 10 2799.0 2799.0 279.90 - -
6 Lack-of-fit 5 2798.5 2798.5 559.69 5349.24 0.000*
7 Pure error 5 0.5 0.5 0.10 - -
Total 19 22523.9 - - -
*Significant
In the validation study, the CCD data were applied with the response optimizer to establish the optimal concentrations of significant factors, namely pH, starch, beef extract were found to be 6.89, 0.49 (w/v) and 0.67% (w/v) respectively for maximum decolorization of remazol golden yellow by E. aurantiacum (TSL7). Under this level of factors, strain TSL7 experimentally attained about 91.83% decolorization agreed with a predicted value of 91.40%. The addition of beef
extracts with a consortium of G. geotrichum and Bacillus sp. in synthetic media enhances the Brilliant Blue G decolorization was documented by Jadhav et al., (2008). The microorganisms which utilize starch as a carbon source would be favorable for the treatment of textile waste water (Babu et al., 2007). Georgiou et al., (2005) stated that application of potato-starch waste develops the decolorization of textile effluents in large scale treatment. Recently, Chen et al., (2011) reported that
pH 7 Hold Values Starch %(w/v) B e e f e x tr a c t % ( w /v ) 1.25 1.00 0.75 0.50 0.25 0.00 1.25 1.00 0.75 0.50 0.25 0.00 – – – < 20 20 40 40 60 60 80 (%) Decolorization
Starch %(w/v) 0.55 Hold Values pH B e e f e x tr a c t % ( w /v ) 10 9 8 7 6 5 4 1.25 1.00 0.75 0.50 0.25 0.00 – – – – – < -50 -50 -25 -25 0 0 25 25 50 50 75 (%) Decolorization
E. acetylicum NIU-K2 and E.indicum NIU-K4 was the most efficient decolorizer for textile dye containing effluents. Moreover, Okeke et al., (2008) mentioned that
Exiguobacterium spp. have the capability to tolerate a higher alkaline pH range from 6-9. Similar with present study, Du et al., (2008) obtained 86.0% decolorization of textile dye Acid Black 172 (200 mg/l) by
Pseudomonas strain DY1 under in optimal conditions, which was within the predicted value of 85.0%. It was suggested that the explored model was good for practical oriented application.
CONCLUSION
The isolated indigenous dye decolorizing bacterium E. aurantiacum (TSL7) a halo tolerant, demonstrates the efficiency of textile dye decolorization. The bacterial dye decolorization process is dependent on the environmental factors which affects the bacterial growth. Plackett-Burman design study showed that decolorization was significantly influenced by the amount of starch followed by beef extract and pH. It is essential to know the satisfactory area of substrates for bacterial growth and decolorization. Since higher/lower concentrations disturb the decolorization eventually by microbial growth inhibition. The pH of the medium affects the solubility nature of the dye and color. The significant factors were optimized in RSM and the enhanced dye removal was observed in model validation by E. aurantiacum (TSL7). These research findings confirmed that E. aurantiacum
(TSL7) and identified significant factors, optimal value are suitable for enhancement of dye removal at industrial level.
Acknowledgements
The authors are sincerely thankful to Vice Chancellor and Registrar of Periyar University, Salem for the financial support of University Research Fellowship (URF) to accomplish my research work.
REFERENCES
Amoozegar, M. A., Hajighasemi, M., Hamedi, J., Asad, S. and Ventosa, A. (2011). Azo dye decolorization by halophilic and halotolerant microorganisms. Ann. Microbiol., 61(2); 217-230. Arun Prasad, A. S. and Bhaskara Rao, K. V. (2013). Aerobic biodegradation of Azo dye by Bacillus cohnii MTCC 3616; an obligately alkaliphilic bacterium and toxicity evaluation of metabolites by different bioassay systems. Appl. Microbiol. Biotechnol., 97(16); 7469-7481.
Babu, B. R., Parande, A. K., Raghu, S. and Kumar, T. P. (2007). Cotton textile processing: waste generation and effluent treatment. J. Cotton. Sci., 11; 141-53.
Chen, B. Y., Hsueh, C. C., Chen, W. M. and Li, W. D. (2011). Exploring decolorization and halotolerance characteristics by indigenous acclimatized bacteria: Chemical structure of azo dyes and dose-response assessment. J. Taiwan Inst. Chem. Eng., 42(5); 816-825.
Dos Santos, A. B., Cervantes, F. J. and Van Lier, J. B. (2007). Azo dye reduction by thermophilic anaerobic granular sludge, and the impact of the redox mediator anthraquinone-2, 6-disulfonate (AQDS) on the reductive biochemical transformation. Appl. Microbiol. Biotechnol., 64(1); 62-69.
Du, L. N., Yang, Y. Y., Li, G., Wang, S., Jia, X. M. and Zhao, Y. H. (2010). Optimization of heavy metal-containing dye acid black 172 decolorization by Pseudomonas sp. DY1 using statistical designs. Int. Biodeterior. Biodegrad., 64(7); 566-573. Dubrow, S. F., Boardman, G. D. and Michelsen, D. L. (1996). Chemical pretreatment and aerobic– anaerobic degradation of textile dye wastewater. (In A. Reife & H.S. Freeman (Eds.), Environmental Chemistry of Dyes and Pigments (pp. 75-102). New York: Wiley.)
El Bouraie, M. and El Din, W. S. (2016). Biodegradation of Reactive Black 5 by Aeromonas hydrophila strain isolated from dye-contaminated textile wastewater. Sustainable Environment Research., 26(5); 209-216.
Ghodake, G. S., Telke, A. A., Jadhav, J. P. and Govindwar, S. P. (2009). Potential of Brssic juncea in order to treat textile effluent contaminated sites. Int. J. Phytoreme., 11(4); 297-312.
Gopinath, K. P., Kathiravan, M. N., Srinivasan, R. and Sankaranarayanan, S. (2011). Evaluation and elimination of inhibitory effects of salts and heavy metal ions on biodegradation of congo red by Pseudomonas sp. mutant. Bioresour. Technol., 102(4); 3687-3693.
Guadie, A., Tizazu, S., Melese, M., Guo, W., Ngo, H. H. and Xia, S. (2017). Biodecolorization of textile azo dye using Bacillus sp. strain CH12 isolated from alkaline lake. Biotechnol Rep., 15(6); 92-100.
Jadhav, S. U., Jadhav, M. U., Kagalkar, A. N. and Govindwar, S. P. (2008). Decolorization of Brilliant Blue G Dye Mediated by Degradation of the Microbial Consortium of Galactomyces geotrichum and Bacillus sp. J. Chin. Inst. Chem. Engrs., 39; 563-570.
Jadhav, U. U., Dawkar, V. V., Ghodake, G. S. and Govindwar, S. P. (2008). Biodegradation of direct red 5B, a textile dye by newly isolated Comamonas sp. UVS. J. Hazard. Mater., 158(2-3); 507-516. Kalpana, D., Velmurugan, N., Shim, J. H., Oh, B. T., Kalaiselvi, S. and Lee, Y. S. (2012). Biodecolorization and biodegradation of reactive Levafix Blue E-RA granulate dye by the white rot fungus Irpex lacteus. J. Environ. Manage., 111; 142-149.
Khalid, A., Arshad, M. and Crowley, D. E. (2008). Decolorization of azo dyes by Shewanella sp. under saline conditions. Appl Microbiol Biotechnol., 79(6); 1053-1059.
Khan, R., Bhawana, P. and Fulekar, M. H. (2012). Microbial decolorization and degradation of synthetic dyes: a review. Rev Environ Sci Biotechnol., 12(1); 75-97.
Khelifi, E., Touhami, Y., Dhia Thabet, O. B., Ayed, L., Bouallagui, H., Fardeau, M. L. and Hamdi, M. (2012). Exploring bioaugmentation strategies for the decolourization of textile wastewater using a two species consortium (Bacillus cereus and Bacillus pumilus) and characterization of produced metabolites. Desalin. Water Treat., 45(1-3); 48-54. Kaur, B., Kumar, B., Garg, N. and Kaur, N. (2015). Statistical Optimization of Conditions for Decolorization of Synthetic Dyes by Cordyceps
militaris MTCC 3936 Using RSM. Biomed Res Int., 536745; 1-17.
Kim, T. Y., Min, B. J., Choi, S. Y., Park, S. S., Cho, S. Y. and Kim, S. J. (2008). Separation characteristics of reactive orange dye from aqueous solution using biosorbent. Proceeding of the World Congress on Engineering and Computer Science, Sanfrancisco, USA.
Kuhad, R. C., Sood, N., Tripathi, K. K., Singh, A. and Ward, O. P. (2004). Development in microbial methods for the treatment of dye effluents. Adv. Appl. Microbiol., 56: 185-213.
Lalnunhlimi, S. and Krishnaswamy, V. (2016). Decolorization of azo dyes (Direct Blue 151 and Direct Red 31) by moderately alkaliphilic bacterial consortium. Braz J Microbiol., 47(1); 39-46. Nigam, P., Banat, I. M. and Marchant, R. (1996). Decolorization of effluent from the textile industry by a microbial consortium. Biotechnol. Lett., 18(3); 117-20.
Okeke, B. C. (2008). Bioremoval of hexavalent chromium from water by a salt tolerant bacterium, Exiguobacterium sp. GS1. J. Ind. Microbiol. Biotechnol., 35(12); 1571-1579.
Pearce, C. I., Lloyd, J. R. and Guthrie, J. T. (2003). The removal of colour from textile wastewater using whole bacterial cells: a review. Dyes. Pigm., 58(3); 179-196.
Solis, M., Solis, A., Perez, H. I., Manjarrez, N. and Flores, M. (2012) Microbial decolouration of azo dyes: a review. Process. Biochem., 47(12); 1723-1748. Van der Zee, F. P. and Villaverde, S. (2005). Combined anaerobic - aerobic treatment of azo dyes-a short review of bioreactor studies. Water Res., 39(8); 1425-1440.
Vandevivere, P. C., Bianchi, R. and Verstraete, W. (1998). Treatment and Reuse of Wastewater from the Textile Wet-processing Industry: Review of Emerging Technologies. J. Chem. Technol. Biotechnol., 72(4); 289-302.