Energy Savings in Building with a PCM Free Cooling System
Uroš Stritih* - Vincenc ButalaUniversity of Ljubljana, Faculty of Mechanical Engineering, Slovenia
Alternative solutions for cooling and ventilation of buildings have appeared in practice as a counterweight to energy wasting conventional systems. Free cooling principle with phase change material (PCM) has been used as an alternative method of cooling and ventilating buildings which combines night ventilation and increased thermal mass. A simulation model defining the transient behaviour of the phase change unit was used. The heat transfer problem of the model, which was treated as two-dimensional, was solved numerically by an enthalpy-based finite differences method. The computer program was written in Fortran program language and can calculate temperature fields in certain time in paraffin area, as well as air temperatures. Energy conservation was calculated from meteorological data for a reference year in a specific country. The difference between inlet and outlet temperature were calculated, from which energy conservation for a cooling season were obtained. Calculated energy savings are from 14 to 87% depending on selected parameters.
©2011 Journal of Mechanical Engineering. All rights reserved.
Keywords: cooling, cold storage, phase change material, experiment, numerical analysis
0 INTRODUCTION
Alternative systems for cooling and ventilation of buildings have their power dependent on the environmental conditions. Therefore they usually need an efficient thermal storage system. Such a system should meet many demands. Among them the most important are: to store as much energy as possible in the defined volume, to have large area for heat transfer and to conduct heat as quickly as possible. One of the important parameters is also the temperature at which energy is stored. This temperature influences the efficiency of the system as well as on the indoor environment condition of buildings. One of the solutions is to use phase change materials – PCM.
Phase change materials have high melting heat which can store or release heat at melting and solidification. This heat is released or absorbed at nearly constant temperature. The content of the stored heat is from 5 to 14 times grater compared to the classical thermal storage systems (like water, stones etc.).
Thermal storages with PCM take up a major part of the research in the building area. Researchers have made fundamental investigations for more than 20 years. Chen et al. [1] have experimentally investigated cold storage in an encapsulated thermal storage tank.
Lamberg [2] made analytical model for two-phase solidification problem in a finned PCM. She calculated location of the solidification points and temperature profile. Simard and Lacroix [3] have analyzed the behavior of the plate thermal storage with PCM. They calculated optimal panel depth and the distance between them. Seeniraj and Narasimhan [4] analyzed performance enhancement of a solar dynamic LHTS module. They have numerically calculated that fins increases heat transfer in PCM. Cabeza et al. [5] have studied heat transfer enhancement in water as PCM with insertion of three possible materials: stainless steel, cupper and graphite. They have found that heat flux increases the most at insertion of the graphite. Stritih [6] has experimentally discovered that heat transfer at melting is not a problem. At solidification heat transfer can be enhanced with fins.
of PCM influences on the reduction of the internal temperature oscillations compared to the external ones. Darkwa and Collagham [9] have shown that PCM panels with the narrow phase change area are the most efficient for applications in buildings. Liu and Awbi [10] have compared natural convection beside an ordinary wall and wall with PCM. They have discovered increased thermal capacity and decreased thermal conductivity. Zhou et al. [11] have analyzed the room with PCM panels. They have found that the efficiency is better if the PCM panel is located on the internal side of the wall. Ahmad et al. [12] experimentally shown that wallboards with PCM have the same characteristics even after 400 cycles. Numerical simulations [13] have shown that optimal melting temperature for PCM panels in passive solar buildings is 21 ºC. Kuznik et al. [14] made optimization of PCM wallboard for building use. They have found that optimal thickness depends on the time interval of the operation.
Research of the integration of PCM into double glass window [15] has shown that in winter thermal comfort is increased and in summer heat loads are decreased. Results show that the transmisivity of the glass remains good. Huang et al. [16] have found the integration of PCM increases the efficiency of the photovoltaic (PV) system. Wang et al. [17] have analyzed the influence of PCM on the coefficient of performance (COP) of the cooling system.
a) b)
Fig. 1. Principal function of PCM “free cooling system”; a) night time, b) day time
The objective of this paper is to present energy conservation opportunities at PCM free cooling. This is an alternative method of cooling and ventilating buildings, which combines increased thermal mass and night ventilation. The thermal inertia of a building is actively adjusted by integrating PCM into the ceiling board of a building. Cold night air is used to cool the building interior and the PCM storage. Outside
air for night cooling can be introduced into the space locally by window, wall fans or by a central air supply system. During the daytime hot indoor air is circulated in the unit (Fig. 1) [18]. The aim of the use of PCM-products is to reduce the energy needed for cooling buildings with heat overproduction.
1 EXPERIMENT
An experimental set-up for the analysis of heat transfer within the free cooling system was installed. A measurement testing line was designed for measuring the daily cold storage efficiency. The cold storage filled with paraffin was located in an air duct that let in cold air during the night. Cold air led to paraffin crystallization and therefore cold accumulation. During the daytime hot air was led through the air duct, which was cooled down due to the accumulated cold in the cold storage. The air duct was insulated in order to reduce cold exchange with the surroundings.
The testing line (Fig. 2) consisted of a personal computer (1) in which the measured data were put through an A/D (Analogy/Digital) converter (2) and I/O (Input/Output) Card (3). Characteristic values for the inlet (5) and outlet (8) temperatures were measured with type K thermocouples (4) and air velocities were measured with an anemometer (10). Air entered into the insulated air duct (6) through an inlet aperture and was then fed through the cold storage (7) to the outlet aperture (8) by the fan (9), where it was measured by anemometer (10).
Fig. 2. Testing line scheme for measuring daily cold storage efficiency
Table 1 shows the common properties of cold storage.
Table 1. Cold storage properties
Dimensions 500×220×90 mm
Total mass 16.2 kg
Mass of the shell 12.6 kg
Mass of PCM 3.6 kg
Phase change temperature 20-22 °C
Operation temperature 15-30 °C
Cold storage capacity 172 kJ/kg
Cold stored in PCM 732.6 kJ
Cold stored in shell 11.3 kJ
Total cold stored 743.9 kJ
Inlet, outlet air temperatures, and airflow have been measured. These measurements were conducted in April, when the outside air temperatures were below 15 °C. At night-time the outside air was used for cooling PCM, which was placed in a thermal buffer. Measuring usually started at 7:30 AM and ended at 2 PM. The cooling time for PCM at night-time with the outside air was approximately the same for every single measurement. It was essential to have the same amount of coldness inside the buffer, so that all the results would be comparable. The process of measuring took 7 days and during those days the outside temperature remained stable. We made several measurements for combinations of inlet temperature 26, 36 and 40 ºC and air flows 1.5 and 2.4 m/s.
into a ceiling board. In order to increase the thermal power of the cold storage two different industrials fins were used. These fins were made of aluminium and were connected to the metal box from the interior and exterior sides on both upper and lower sides of the box (Fig. 3). The contact between the box and fins was filled with thermal conductible paste.
Fig. 3. a) Shape and b) cross section of the cold storage
Fins were used here for two different reasons. On the exterior side of the cold storage, fins were connected to the box in order to increase the surface area, which leads to a higher convection cold flux. On the interior side of the box, the fins were connected in order to increase the conduction cold flux. The inside of the box was filled with paraffin with a melting point of 22
°C. The heat storage capacity of the paraffin used here was 172 kJ/kg within a temperature range of 11 to 26 °C and had a specific heat of 1.8 / 2.4 (solid/liquid) kJ/kg K. Used paraffin is chemically inert with respect to most materials and should therefore not contribute to corrosion.
Fig. 4 shows that when we used airflow of 1.5 m/s, the outlet air temperature was lower than at airflow of 2.4 m/s. This means that the length of the buffer used was not appropriate for airflows larger than 1.5 m/s and inlet air temperatures below 30 ºC. The reason is that after 200 minutes the outlet air temperature equals the inlet air temperature.
However, in the case of sequentially used buffers the effect would be greater and the air could be cooled for longer. At regime
Ti = 36 ºC and v = 1.5 m/s the outlet air temperature
approaches the inlet air temperature but does not reach it. This is caused by thermal losses to the surroundings. In our case, the loss was to room temperature, which was 23 ºC on average. This constituted an additional heat flux that was cooling the air to infinity. The same happened at regime Ti = 40 ºC, where the temperature disparity
was much higher and therefore the heat flux was also greater (Fig. 5).
We calculated the amount of cold released under different regimes. The results represent the amount of cold released at a time interval between 0 and 5 minutes or in other words between 0 and 300 s. Other components of cold were calculated using Excel software.
Fig. 6 shows the amount cold, which the buffer released under individual regimes.
2 MATHEMATICAL MODEL AND COMPARISON WITH EXPERIMENTS
The mathematical model enables us to calculate the stored cold in PCM and the temperatures of cooled air. The physical picture is the following: a cold storage chamber with dimensions W, H and L is filled with PCM. Cold is
Fig. 6. Amount of cold stored in cold storage at different inlet air temperatures and airflows
transferred and stored in PCM as described below. The air is cooled by convection heat transfer (Fig. 7). Energy storage in PCM includes a moving boundary problem: there is a solid phase on one side and a liquid phase on the other.
Fig. 7. Control volume of the PCM
The partial differential equation for heat conduction:
∂ ∂
T
t =adiv gradT( )=a T∆ (1)
must be written for a solid (s) as:
∂ ∂
T
ts =a div gradTs ( s) (2)
and for the liquid (l) phase as:
∂ ∂
T
tl =a div gradTl ( l). (3)
Since heat is transferred across the borders of the system the increase in energy can be described by introducing specific enthalpy:
d
dtV
∫
ρ. .h dV =∫
Aλ.gradT dA. . (4)The following Eq. can be written for this finite element:
ρ λ λ
λ λ
V dh
dt A dTdx A dTdx
A dT
dy A dTdx
i j t t i i i i j j , . . . . + + − + = − + + −
1 1 1
1
jj
j−1 (5)
and using a standardized differential method we get:
h h t
l T T T T T
i jt,+1= i jt, +ρλ.( ). 2(i j,−1+ i j,+1+ i−1,j+ i+1,j−4i,
∆
∆ jj). (6)
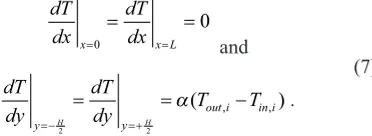
This Eq. is used for all control volumes except for the borders, where the boundary conditions are defined as:
dT dx
dT dx
x= x L=
= = 0 0 and (7) dT dy dT
dy T T
y y
out i in i
H H
=− =+
= = −
2 2
α( , ,).
Where α is the turbulent convection coefficient calculated from the following equation:
Nu=0 018, Re0 80, . (8)
Since the thermal conductivity of PCM is very low, the heat conduction can be increased with fins. Increased thermal conductivity can be calculated using the following Eq.:
λ λ λ λ λ λ = + − + pcm fin fin pcm pcm pcm f 1 3 . (9)
The computer program was written in the FORTRAN program language and can calculate temperature fields over a certain time within the paraffin area as well as air temperatures.
The program numerically solves transient two-dimensional heat transfer equations, which contain an equation for convection on the air-PCM side and for conduction inside the air-PCM.
Fig. 8 presents measured inlet air temperatures and outlet temperatures received by measurements and numerically for the case
Ti = 36 ºC, v = 1.5 m/s. The same conditions were
used in the program and in the experiment.
The key challenge was the time step and number of finite differences (mesh). These two parameters are the key to the stability of the system. If they are set wrongly, then the system is not stable and the calculated temperatures are wrong.
For our case, the temperature interval dt
was 0.5 s and Dx = Dy was 0.01.
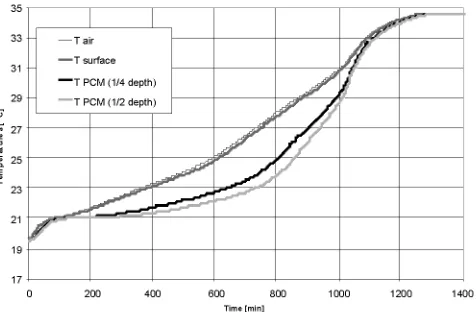
Fig. 9 presents temperatures at the middle cross section of the cold storage: air temperatures and three paraffin temperatures. At the beginning, all temperatures are the same, since the PCM is cooled to the air temperature. After some time, differences that are a consequence of heat transfer from air to the PCM can be observed. The deeper into the PCM we go, the greater is the temperature difference. At the end when the temperature reaches a maximum, all the PCM temperatures are
the same again, which means that the cold storage is empty.
3 RESULTS OF SIMULATIONS
The program was written in such a way that it reads external files with values of inlet air temperatures for every hour in a whole year (Test Reference Year) and gives outlet temperatures as a result. Energy conservation is calculated from the difference between the inlet and outlet air temperature. Calculations have been made for four representative European cities with different climate conditions: Ljubljana, Rome, London and Stockholm. The program works through the following steps:
1. Constant parameters during calculations:
Fig. 8. Comparison of experimental and numerical values of air temperatures
• geometry of storage (length, width, height, depth),
• thermal characteristics (thermal conductivity, density, specific heat),
• geometry of the air channel,
• thermal characteristics of PCM (melting heat, solidification and melting temperature, density and specific heat in both phases), • air flow,
• thermal characteristics of air (specific heat, thermal conductivity, viscosity),
• time steps and
• number of control volumes.
2. The program reads values of inlet air temperatures for the selected city every hour for the whole year (from the external file). 3. Using the above-presented Eqs. (5) to (7),
the program calculates the values of the temperature for each control volume of the paraffin and air at each time step.
4. The values of the selected temperatures are written on the screen and saved into an external file for future analysis.
Table 2. Cold storage
Cold Storage
Height H 0.2 m
Length L 0.5 m
Width W 2 × 0.03 m
Width of air channel 2 × 0.015 m Phase-change material
Latent heat 100 / 200 kJ/kg
Sol. / liq. temperature 20 / 22 °C Specific heat solid / liquid 1800 / 2400 kJ Density solid / liquid 840 / 760 kg/m3
Table 2 presents the key parameters for cold thermal storage with PCM for the simulations.
Simulations were carried out under four different conditions: two different latent heats of PCM (100 kJ/kg, 200 kJ/kg) and two different air flows (10 m3/h, 40 m3/h) were used.
The calculations of energy conservation using cold storage were made in the following way; for the selected parameters (city, latent heat and air flow), we have calculated:
a) The monthly energy required for cooling outside air to room temperature (Eo);
b) The monthly energy required for cooling air from cold storage to room temperature (Epcm).
The difference between a) and b) represents energy savings. The percentage was calculated by Eq. (10) and results are presented in Fig. 10.
η= E −E ×
E
o pcm
o
100. (10)
In Fig. 10, monthly energy savings using PCM cold storage for 4 different European cities are presented.
In the case of Ljubljana, the needs for cooling are not high in April and October. Therefore even with a PCM with low latent heat (100 kJ/kg) the total air volume can be cooled down. Closer to the hottest part of the year, the need for cooling is higher and the efficiency is lower. In July when the need for cooling is the highest, the share of saved energy is in the range of 20 to 60%. The higher the volume flow and the lower latent heat, the more cold has to be added by conventional cooling.
The example for Rome shows us that the efficiency of cold storage decreases in a hotter environment. In July and August the temperatures do not fall below 20 ºC, so cold cannot be stored as latent heat in thermal storage. The consequence of this is that air cannot be cooled during the day and the efficiency is lower by 10%. In other months the efficiency increases since the need for cooling is smaller and the nighttime temperatures are lower.
Examples from London and Stockholm shows us that in colder climates, where the need for cooling is lower, more than 50% efficiency during all cooling periods using cold storage can be reached.
We have also made integral calculations of cold storage in different cities. The data are presented in Table 3. They are more representative than those in Fig. 10 since they include both percentages and absolute values.
Table 3 shows that the quantity of cooling energy at 40 m2/h is four times lower than at 10
m2/h. This means that the quantity of air and the
cooling energy is proportional.
a) Energy conservation with PCM cold storage for Ljubljana b) Energy conservation with PCM cold storage for Rome
c) Energy conservation with PCM cold storage for London d) Energy conservation with PCM cold storage for Stockholm Fig. 10. The share of saved energy for different European cities
savings are 14.2 kWh and 26.3 kWh respectively for the two different melting heats. The share of saved energy at a volume flow of 10 m2/h is
over 60% and at a volume flow of 40 m2/h this is
reduced for 27 and 51 %.
In the case of Stockholm, the share of saved energy is similar to that of Ljubljana. This means that both cities have a similar temperature fluctuation. The cold energy needed is 60% lower in Stockholm, however, due to different climate conditions.
Rome and London represents two extreme conditions. In the case of Rome, the need for cooling energy is twenty times higher than in London. This is connected to cooling efficiency: in Rome less energy is saved (up to 30%), whereas in London the majority of cold (more than 60%) can be obtained with PCM.
4 CONCLUSIONS
The proposed model assumes that the only factors in the energy calculation are dependant on the heat flow related to ventilation. This ignores
issues of solar gains, internal heat gains, reverse transmission, and energy storage in the room.
Cold storage with PCM could be a very useful component of the ventilation system in buildings since it uses cold from the environment. However, from the analysis it is clear that such a system can only be an addition to the conventional cooling systems and cannot be used alone.
Energy savings vary from one location to another and the savings are very dependent on the weather conditions: daytime and nighttime air temperatures, the melting heat of PCM in cold storage, and the quantity of circulating air.
In places with hot weather conditions the temperatures at night will be too high to solidify the PCM under the given parameters. This means that air during daytime cannot be cooled . On the other hand, in places with cold weather conditions there is plenty of nighttime cold but no strong need for cooling.
Table 3. Cold storage properties for different European cities
Ljubljana
Latent heat [kJ/kg]/ Air flow [m3/h] 100 / 10 100 / 40 200 / 10 200 / 40
Energy for cooling [kWh] 12.9 51.9 12.9 51.9
Saved energy [kWh] 8.5 14.2 10.1 26.3
Saved energy [%] 66 27 78 51
Rome
Latent heat [kJ/kg]/ Air flow [m3/h] 100 / 10 100 / 40 200 / 10 200 / 40
Energy for cooling [kWh] 35.9 143.7 35.9 143.7
Saved energy [kWh] 7.8 14.0 9.2 123.6
Saved energy [%] 22 10 26 14
London
Latent heat [kJ/kg]/ Air flow [m3/h] 100 / 10 100 / 40 200 / 10 200 / 40
Energy for cooling [kWh] 1.5 5.9 1.5 5.9
Saved energy [kWh] 1.3 2.6 1.5 3.7
Saved energy [%] 87 44 100 63
Stockholm
Latent heat [kJ/kg]/ Air flow [m3/h] 100 / 10 100 / 40 200 / 10 200 / 40
Energy for cooling [kWh] 5.3 21.3 5.3 21.3
Saved energy [kWh] 3.7 6.4 4.2 9.4
Saved energy [%] 70 30 79 44
building ventilation. From the analysis it can be concluded that the most efficient system would be cold storage with the highest possible latent heat and the lowest possible volume flow through the system.
Knowing the payback time period of such a system is also significant. Therefore, a cost analysis will need to be carried out in the future.
5 NOMENCLATURE
List of symbols:
A Area m2
cp Specific heat capacity J/kgK
h Enthalpy kJ/kg
L Latent heat J/kg
l Characteristic value m
m Mass kg
Q Heat J
T Temperature K
t Time s
V Volume m3
v Velocity m/s
F Heat flux W
λ Thermal conductivity W/mK
ρ Density kg/m3
ΔT Temperature difference K
Δt Time interval s
List of abbreviations:
f Final max Maximum i Inlet
n Number of time intervals
j Certain time
o Outlet l Liquid
PCM Phase change material m Melted
s Solid
6 REFERENCES
[1] Chen, S.L., Chen, C.L., Tin, C.C., Lee, T.S., Ke, M.C. (2000). An experimental investigation of cold storage in an encapsulated thermal storage tank.
Experimental Thermal and Fluid Science, vol. 23, p. 133-144.
in a finned phase-change material storage.
Applied Energy, vol. 77, no. 2, p. 131-152. [3] Simard, A.P., Lacroix, M. (2002). Study
of the thermal behavior of a latent heat cold storage unit operating under frosting
conditions. Energy Conversion and
Management, vol. 44, p. 1605-1624.
[4] Seeniraj, R.V., Lakshmi Narasimhan, N. (2008). Performance enhancement of a solar dynamic LHTS module having both fins and multiple PCMs. Solar Energy, vol. 82, p. 535-542.
[5] Cabeza, L.F., Mehling, H., Hiebler, S., Ziegler, F. (2002). Heat transfer enhancement in water when used as PCM in thermal energy storage. Applied Thermal Engineering, vol. 22, p. 1141-1151.
[6] Stritih, U. (2004). An experimental study of enhanced heat transfer in rectangular PCM thermal storage. International Journal of Heat and Mass Transfer, vol. 47, p. 2841-2847.
[7] Lee, T., Hawes, D.W., Banu, D., Feldman, D. (1999). Control aspects of latent heat storage and recovery in concrete. Solar Energy Materials & Solar Cells, vol. 62, p. 217-237.
[8] Zalba, B., Marin, J.M., Cabeza, L.F., Mehling H. (2003). Review on a thermal energy storage with phase change materials, heat transfer analysis and applications.
Applied Thermal Engineering, vol. 23, no. 3, p. 251-283.
[9] Darkwa, K., O`Callaghan, P.W. (2005). Simulation of phase change drywalls in a passive solar building. Applied Thermal Engineering, vol. 26, p. 853-858.
[10] Liu, H., Awbi, H.B. (2008). Performance of phase change material boards under natural
convection. Building and Environment, vol. 44, p. 1788-1793.
[11] Zhou, G., Zhang, Y., Kunping, L., Xiao, V. 2008. Thermal analysis of a direct-gain room with shape-stabilized PCM plates.
Renewable Energy, vol. 33, p. 1228-1236. [12] Ahmad, M., Bontemps, A., Sallee,
H., Quenard, D. (2006). Experimental investigation and computer simulation of thermal behavior of wallboards containing a phase change material. Energy and Buildings, vol. 38, no. 4, p. 357-366.
[13] Zhou, G., Zhang, Y., Wang, X., Lin, K., Xiao, W. (2007). An assessment of mixed type PCM-gypsum and shape-stabilized PCM plates in a building for passive solar heating. Solar Energy, vol. 81, p. 1351-1360. [14] Kuznik, F., Virgone, J., Noel, J. (2007).
Optimization of a phase change material wallboard for building use. Applied Thermal Engineering, vol. 28, p. 1291-1298.
[15] Weinläder, H., Beck, A., Fricke, J. (2004). PCM-facade-panel for day lighting and room heating. Solar Energy, vol. 78, p. 177-186.
[16] Huang, M.J., Eames, P.C., Norton, B. (2003). Thermal regulation of building-integrated photovoltaic using phase change materials. International Journal of Heat and Mass Transfer, vol. 47, p. 2715-2733.
[17] Wang, F., Maidment, G., Missenden, J., Tozer, R. (2007). The novel use of phase change materials in refrigeration plant, Part 3: PCM for control and energy savings.
Applied Thermal Engineering, vol. 27, p. 2911.