Print ISSN: 2383-451X Online ISSN: 2383-4501 Web Page: https://jpoll.ut.ac.ir, Email: [email protected]
Identification of the Thresholds of Extreme Values and Synoptic
Analysis of PM
10Pollution in the Atmosphere of Ahvaz
Ghavidel, Y.1*, Khorshiddoust, A. M.2, Farajzadeh, M.1 and Pourshahbaz, H.1
1. Department of Physical Geography, Tarbiat Modares University, Tehran, Iran 2. Department of Climatology, the University of Tabriz, Tabriz, Iran
Received: 30.07.2018 Accepted: 03.03.2019
ABSTRACT: Ahvaz can be regarded as one of the most polluted cities in the world in terms of air pollution. Successive years of drought and weather conditions in recent years have resulted in particulate matter (PM10) concentration in Ahvaz. In this study, using
probability distribution techniques, an appropriate threshold to identify the PM10 maximum
extreme concentrations (MEC) has been detected. Based on log-logistics probability distribution, which has the best fit to the data of PM10 concentration in Ahvaz, the 0.99
percentile threshold which is specified by 1516 µg/m³ is known as the primary PM10
concentrations in Ahvaz air. Based on the mentioned threshold, 24 days in which the PM10
concentration was equal to or more than the threshold were selected for synoptic analysis. Analysis of the circulation of weather types showed that two weather types circulations at 500 hPa level provide the climatic conditions for the occurrence of (MEC) caused by PM10
concentration ≥1516 µg/m³ in Ahvaz in the first type (which is for hot days). Under such condition, the closed high pattern of 500 hPa level is accompanied by the ground low pressures. In the second type (which is for cold and transitional days) the closed high pattern of 500 hPa level is accompanied by the ground high pressures. In addition, this study showed that the (MEC) of PM10 in both models fed with several different sources at
different levels and due to being multi-source, storms can create MEC.
Keywords: environmental climatology, air pollution hazard, particulate matter concentration, synoptic analysis, Ahvaz.
INTRODUCTION
Successive years of drought in the West Asia (Middle East) region have caused a secondary climate hazard that has exacerbated the impacts of drought in the region. One of the hazards is the increasing concentrations of pollutants of air particulate matters which are drawn by the wind from different countries away from Iran, especially Sudan, Syria, Jordan, Iraq and Saudi Arabia into Iran (Farajzadeh, 2015). This Study discusses 10 micrometers particulate matters whose
*
Corresponding Author Email: [email protected]
problems. PM10 is smaller than the width
of a single human hair (Saniei et al., 2016; Yao & Lu 2014).).
Given that the dominant path of planetary winds are western and countries that are the source of dust are located in West of Iran, westerly winds easily bring dust into the atmosphere of Iran in case of availability of conditions. In this case, there are many issues including those in the West Asia and East Africa, where politics and wars are the causes of the marginalization of environmental issues in the countries affected and funds to stabilize these countries are not necessarily the sole solutions to the dust in similar countries.
On the other hand, the main cause of drying of wetlands in Iran and neighboring countries is the blockage of water entering the wetlands due to dam construction for drinking water supply. This in turn is the basic requirement for survival of the population and accordingly allocation of water for wetland and environmental protection in these countries is of the lowest priority. When the persistent and intensified drought in the West Asia is also added, the problem becomes more acute. Severe droughts in recent years in the West Asia have been further eroding soil moisture and water levels in wetlands and have caused much more aerosols in wind and ultimately polluted the weather of countries like Iran. Now considering the results of the global circulation of the atmosphere in the entire West Asia for years to come where the predictions pertain the reduction in rainfall and increase in temperatures, it can be concluded that the entry of dust into the atmosphere is more intensified and in the coming years, one of the most common and deadly climatic and environmental hazards would be the issue of aerosols and storms of dust particles of 10 microns (Pourshahbaz, 2015). Of the six very dangerous pollutants are the aerosols that can hurt the human body. These pollutants consist of materials such as acids, metals and dust. Among the
suspended particles that cause severe air pollution, one can note the PM10. PM10 is
formed through the combination of NOX and SO2 in the earth's atmosphere (Sadeghi
& Khaksar, 2014).
The most severe dust zone in the West Asia region is an extremely dry region with a low coverage between the borders of Saudi Arabia and Oman. Other regions which make dust are large areas such as Umm, Samim and Sabkhat Aba Arrus. Another region larger in size, but less in intensity of dust is the Rub-al-Khali. Although most of the dusts occurring in the West Asia are in a local scale, some of the dust is transferred from Sahara to the area. Iraq is known as one of the main areas producing dust in the West Asia and the effects of its dust largely influence Iran (Shahsavani et al., 2012). Putting all these together, dust is one of the climatic hazards which affects Khuzestan province because of its geographical location and its vicinity with large zones of wilderness areas (Tavousi et al., 2010). According to the World Health Organization, Ahvaz is the most polluted city with an annual average of 372 µg/m³ PM10 among
1100 cities (Sadeghi & Khaksar, 2014). Natsagdorj et al. (2003) have shown that dust storms in Central Asia and Kazakhstan mostly occur in spring and summer. Triantafyllou (2001) investigating the PM10
pollution as a function of synoptic climatology, studied the daily weather conditions in high concentrations over a period of 4 years. Synoptic situations occurred in the southern mountainous area indicated that they are affected by the local topographic characteristics. Draxler et al. (2001) applying network meteorological data, estimated the PM10 concentration from
August 1990 to 1991 for the Arabian Peninsula. Quantitative comparison of prediction model of PM10 concentrations in 4
areas in Saudi Arabia and one in Kuwait revealed that with every storm, PM10
warming in Mongolia desert and cooling of the earth in the desert in northern China as the main causes of occurrence of dust storms in China. Wang and Fang (2006) also investigated the spread of dust in East Asia in statistical and synoptic terms and concluded that if the synoptic systems blow toward the desert regions of North Asia would make winds of more than 6 m/sec at sea level, they would also spread dust storm. Tian (2014) studied the PM10 characteristics
and its relationship with meteorological factors during 2001 and 2012 in Beijing. Atmospheric pressure was found to be the most important meteorological characteristic affecting PM10 after relative humidity and
wind speed. Results indicated that urban design based on the relationship between meteorological factors and PM10 would
affect air pollution. Seasonal and monthly variations of PM10 in air pollution of Beijing
urban area is clearly seen. Kabatas et al. (2014) studied the share of Saharan dust in PM10 concentration in the Anatolian
peninsula. In the aforementioned study, Sahara was known as the major natural source of dust particles.
The present article attempts to analyze the MEC of PM10 in the air of Ahvaz
which has always been faced with dust problem and would face it in the future too. Considering the status of aerosols emissions in Ahvaz, the high concentration of PM10 has been chosen as the topic of
this research. It should be noted that according to the literature, there is no similar study in climatic literature and environmental research of Iran and even in the world and therefore it can be claimed that this study is unique in its kind.
MATERIALS AND METHODS
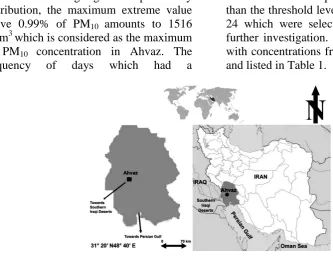
As indicated before, Ahvaz is a city with the worst conditions in terms of pollution. PM10 aerosols have a high concentration in
most periods of year in in Ahvaz. The maps in Fig 1-3 show the geographic position of Ahvaz in Iran and the world.
Various data have been used to study entailing synoptic analysis of PM10
aerosols in Ahvaz. Such data can be divided into 2 groups of stationary data including concentration of PM10 pollutants
and weather data which were used for synoptic analysis.
The first group of stationary data included daily concentration of PM10 in the period of
2008 to 2013 which were obtained from environmental protection organization. The second data category are related to upper atmospheric data including sea level atmospheric data and high levels of atmosphere including atmospheric sea level pressure (SLP), geopotential height (HGT), meridional wind (Vwnd), zonal wind (Uwnd) and relative humidity ( Rhum). These data were all obtained from National Center for Environmental Prediction/National Center for Atmospheric research (NCEP/NCAR) data website in NOAA and have a spatial resolution of 2.5×2.5. Synoptic analysis was carried out for 12:00 GMT which was 15:30 at the local time (towards the middle of the day). Two basic statistical methods were used including log-logistic distribution (for determination of MEC thresholds) and Ward hierarchical cluster analysis (for weather type classification). In order to investigate different circulation patterns of 500 hPa level in the studied days with the maximum PM10
concentration, Ward cluster analysis was applied on data of 500 hPa geo-potential height of selected days and after applying them, two clustering cuts (Figure 5), extracted the circulation pattern and the resultant map was drawn.
RESULTS and DISCUSSION
Considering the plurality of polluted days in terms of PM10, log-logistic distribution
model was used to separate and identify days
when Ahvaz had the maximum
concentration of particulate matter. This distribution was chosen because it fits better with PM10 data series. Figure 2 shows PM10
Based on log-logistic probability distribution, the maximum extreme value above 0.99% of PM10 amounts to 1516
µg/m3 which is considered as the maximum of PM10 concentration in Ahvaz. The
frequency of days which had a
concentration of equal amount or more than the threshold level of 1516 µg/m3 was 24 which were selected for analysis and further investigation. These days were set with concentrations from highest to lowest and listed in Table 1.
Fig. 1. the geographic position of studied area in Iran and the world
Fig. 2. log-logistic probability distribution and one percent above maximum extreme value
Table 1. PM10 concentration in maximum extreme selected days to study
PM10
concentration Date
No
PM10 concentration
As can be seen, July 29, 2009 has the highest concentration level of PM10 with
4232 µg/m3 and April 19, 2008 had the lowest concentration level of PM10 which is
the threshold level.
The monthly frequency of PM10 is
presented in Figure 3. The plotted graph displays that the months of July, August and September had the highest frequency in the studied days. The highest frequency was in summer months and conversely the non-occurrence of high concentration was in January (in winter).
With regard to the seasonal distribution
of maximum amount of PM10 which can be
seen in Figure 4; the highest occurrence was in summer with the frequency of 9 and the lowest was in winter with the frequency of 3 and was entirely compatible with monthly frequency.
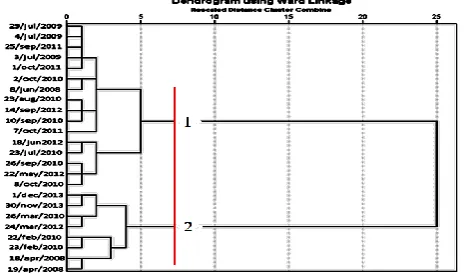
In order to investigate different circulation patterns of 500 hPa level in the studied days with the maximum PM10
concentration, Ward cluster analysis was applied on data of 500 hPa geo-potential height of selected days and after applying two clustering cuts (Figure 5), the extracted circulation pattern map was drawn.
Fig. 3. the monthly frequency of maximum extreme value of PM10 concentration in Ahvaz in the studied period
Fig. 4. the seasonal distribution of maximum amount of PM10 concentration in Ahvaz station
Fig. 5. two clustering cut of ward clustering tree to analyze the patterns of 500 hPa level in days with
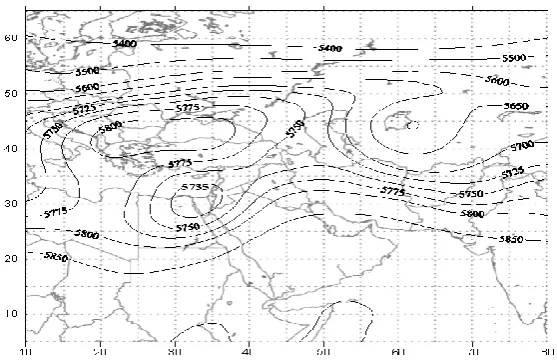
The first model in this division includes 16 days which have been identified in Figure 5 and the average PM10 concentration in days
of this cluster was 2664 µg/m³. Map of the first model of 500 hPa geo-potential height is shown in Figure 6. It can be seen that in this model, an independent contour of the subtropical high pressure cells with curves of 5890 geopotential existed on Iran and a high altitude tab with as much intensity as the closed contour on Iran put the area of North Africa and the Arabian Peninsula under full control. South West region of Ahvaz and Iran were between these independent high contours of West Asian subtropical region and the mentioned high pressure bolt. The mentioned position provided the conditions of aerosol transmission from North Africa and Arabian Peninsula, Iraq, Syria and Jordan and scores of dust and particles and particularly PM10 were brought into the
atmosphere of Ahvaz.
Among the members of the cluster, the highest correlation was between the
average of patterns and cluster days with a correlation coefficient of 0.978 at the alpha level of 0.01 on July 29, 2009. Based on this, the mentioned day was selected as a representative day of the first pattern and was analyzed. Figure 7 represents the hybrid map of SLP patterns (colored map) and the level of 500 hPa. As it can be seen, the dominant pattern of the surface pressure on the region on July 9, 2009, was the low pressure pattern of South West Asia which was located at the same position of 995 hPa low pressure contour. At 500 hPa level (contour map) the closed low pressure was appeared in the form of high altitude contour which was the high altitude of subtropical West Asia. The similarity of 500 hPa pattern with the average circulation pattern resulting from the integration of the 16-day members of the first cluster was very interesting and given the almost perfect correlation of the mentioned pattern with the circulation pattern, it was justified.
Fig. 6. the first pattern of 500 hPa geo-potential height affecting the maximum extreme value of PM10 in Ahvaz
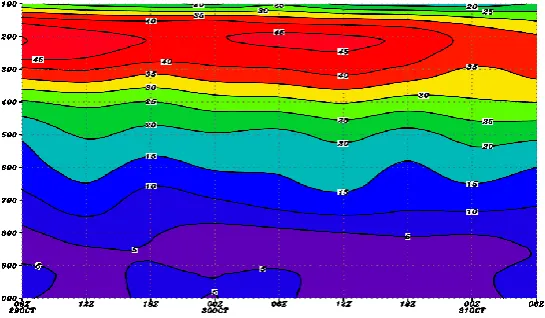
The wind field condition at 500 hPa level (Figure 8) shows that the relatively strong wind, which was associated with the jet stream at high altitude, was the main cause of dust storms and the transport of dust and particulate matter from Egypt, the Arabian Peninsula, Iraq, Kuwait and to South West region of Iran and particularly Ahvaz. In addition, at 700 hPa level which is drawn in Figure 10, a deep trough was located on the West and South-West Iran which was centered precisely on the South West of the country and the South West
region and in the west of the trough a strong anticyclone flow and the fall of the Iraqi air is observed which was the cause of dust and particulate matter transfer to the studied area. It is also observed that the dust storm which led to the sharp and extreme increases in PM10 on July 29, 2009
had various sources at different levels and the state of being multi-resourced and being next to local resource was the main factor of extreme concentration of particulate matter in the South West of Iran.
Fig. 8. the pattern of geopotential height and wind field at 500 hPa level at 15:30 of July 29, 2009
Fig. 9. Map of location of subtropical jet stream in the hours before and after the occurrence of dust storms in Ahvaz
The second pattern is representative of 8 out of the selected days. The average concentration of PM10 of Ahvaz was 2193
µg/m³ in the days of this cluster (Figure 11). The average arrangement of 500 hPa circulation pattern in the 8 mentioned days on the West and South West regions of Iran was in the form of a stack. The stack axis has crossed from West and South West of Iran and hence due to negative vorticity of weather it led to fall of suspended particles in the air in the line of that its shaft passes the trough. Iran's South West region specifically Ahvaz is located between the two curves of 5800 and 5850 geo-potential meters. Two above mentioned curves are drawn in the form of long-ups to the studied area from North Africa and the Arabian Peninsula and though forming flow cyclone, have transferred the PM10 dust and aerosols
to Ahvaz.
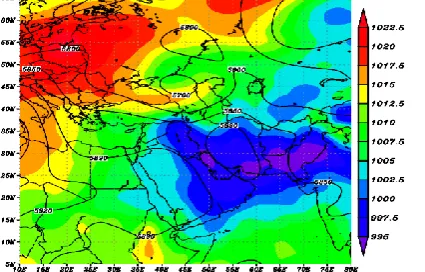
Among the 8 members of the stated cluster, October 30, 2013 with a correlation coefficient of 0.967 at the alpha level of 0.01 has the highest correlation with average circulation pattern in Figure 11. That is why the day is selected as a representative of the second day pattern and has been further analyzed. The hybrid
map of SLP patterns (colored map) and the 500 hPa level at 15:30 of October 30, 2013 is shown in Figure 12.
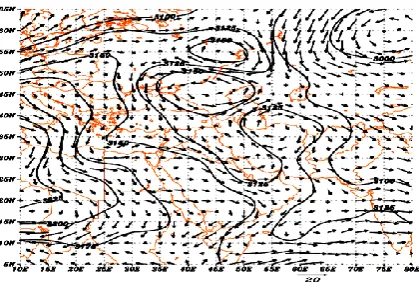
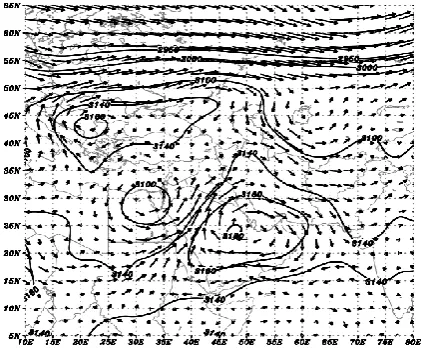
As follows from Figure 12, unlike the first model in which the SLP prevailing pattern was in a low-pressure situation in the study area, at the second pattern of SLP pattern there was high-pressure and medium-pressure mode (at least with higher pressure than the first pattern). The high-pressure tab in the north of the Red Sea was associated with closed low 500 hPa and it has exactly made a stack on the West and South West of Iran whose axes pass through the study area. Since the prearranged area is located in the West axis of the stack, the air flow which is drawn from the lower latitude toward upwards and the region was southern and led the warm and round and dusty weather of deserts of North Africa and the Arabian Peninsula to the South West region of Iran. In Figure 13, which represents wind field and the geopotential height of 500 hPa at 15:30 of October 30, 2013, the mechanism of dust and suspended particles transmission to the South West of Iran is clearly visible.
Fig. 11. The second pattern of geopotential height at 500 hPa influencing maximum extreme values of
Fig. 12. The hybrid pattern of sea level pressure (colored map) and the geopotential height of 500 hPa at 15:30 of October 30, 2013
Fig. 13. The pattern of geopotential height and wind field at 500 hPa level at 15:30 of October 30, 2013
Fig. 15. The pattern of geopotential height and wind field at 700 hPa level at 15:30 of October 30, 2013
Wind velocity vectors indicate that dust and aerosols from Chad, Sudan, the Arabian Peninsula and Iraq have flowed into the South West regions of Iran and with dust storms the PM10 concentration which
reached above the (MEC) threshold. Wind intensity in this pattern was much higher than the first model and the wind of different atmospheric levels was affected by stronger winds of subtropical jet stream which was much deeper on that day (Figure 14). Activities and clockwise move of higher altitudes which were located at the center of the Arabian Peninsula at 700 hPa level, spread dust and particulate matters of the desert areas of Peninsula towards Iran and at this level, the spring of suspended particles in the South West region was only Arabian Peninsula (Fig 15).
CONCLUSION
The Particulate Matter (PM10) with less than 10 micrometers in diameter is among the main pollutants of air in Ahvaz. There have been many studies on dust storms and aerosols in the atmosphere of polluted cities like Ahvaz, Tehran, Kermanshah, Sanandaj and other cities but there is no study to apply the extreme values of the probability distribution of PMs to determine the critical threshold or maximum amount and based on that to define the studied days and analyze it, at
least until the time of inscription of this research. This study showed that different devices for the probability distribution are good models for detecting MEC thresholds of PM10 and through underlying them; we
can identify and study significant and synoptic patterns affecting the storms that raise the concentration of particulate matter to the highest extent. Based on log-logistic distribution, which identified the best distribution fitted to the PM10 data of
Ahvaz, the critical threshold value of Ahvaz was 1516 µg/m³ which is equal to the upper 0.1 distribution or 99% percentile of log-logistic probability distribution. In the recent classification system for air quality, the concentration of 1516 µg/m³ is several times worse than the worst air quality which is the dangerous class and consequently in this study, the mentioned concentration is regarded as the MEC. Analysis of weather patterns showed that two atmospheric patterns at 500 hPa level provide the climatic conditions for the occurrence of MEC caused by PM10
Pollution is licensed under a "Creative Commons Attribution 4.0 International (CC-BY 4.0)" The analysis of wind zones showed that in
the first pattern, at the level of 500, there are arid deserts of North Africa and the Arabian Peninsula and at the level of 700 there are the deserts of Iraq which are the sources of aerosols entered into Ahvaz. While, in the second pattern, the source of particulate matter at the level of 500 is deserts of Chad, Sudan, Iraq and the Arabian Peninsula and at the level of 700, the only source is the Arabian Peninsula. In addition, this study disclosed that the MEC of PM10 in both models fed with several
different sources at different levels and due to being multi-source, storms can create severe and super critical concentrations.
REFERENCES
Draxler, R.R., Giillette, D.A., Kirkp Patrick, J.S. and Heller, R.J. (2001). Estimating PM10 air concentrations from dust storms in Iraq, Kuwait and Saudi Arabia. Atmos. Environ., 35: 4315-4330.
Farajzadeh, M. (2015). Climate hazards of Iran, Samt Publication Co, Tehran, Iran. 339P.
Hamidi, M., Kavianpou, R., M.R. and Shao, Y. (2013). Synoptic analysis of dust storms in the Middle East, Asia-Pacific. J. Atmos. Sci., 49(3): 279-286.
Kabatas, B., Unal, A., Pierce, R.B. and Pozzoli, L. (2014). The contribution of Saharan dust in PM10 concentration levels in Anatolian Peninsula of Turkey. Sci. Total. Environ., 489: 413-421.
Natsagdorj, L., Jugder, D. and Chung, Y.S. (2003). Analysis of dust storms observed in Mongolia during 1937–1999. Atmos. Environ. 37: 1401–1411.
Pope, C.A. (2000). Epidemiology of fine particulate air pollution and human health: Biologic mechanisms and who’s at risk. Environ. Health Persp, 108 (SUPPL. 4): 713-723.
Pourshahbaz, H. (2015). The statistical and synoptic
analysis of maximum extreme values of PM10 in Ahvaz, MSc dissertation, Department of Physical Geography, Tarbiat Modares University.
Sadeghi, S. and Khaksar, S. (2014). Neural network model for short term prediction of PM10 pollution in Ahvaz city. J. Environ. Res., (in Persian)., 9: 177-186.
Saniei, R., Zanghiabadi, A., Sharifikia, M. and Ghavidel, Y. (2016). Air quality classification and its temporal trend in Tehran, Iran. 2002-2012, J. Geosp. Health., 11 (2):1-12.
Shahsavani, A., Naddafi, K., Jafarzade Haghighifard, N., Mesdaghinia, A., Yunesian, M. Nabizadeh, R., …and Goudarzi, G. (2012). The evaluation of PM10, PM2.5, and PM1 concentrations during the Middle Eastern Dust (MED) events in Ahvaz, Iran, from April through September 2010. J. Arid. Environ., 77: 72-83.
Tavousi, T., Khosravi, M. and Raeisipour, K. (2011). Synoptic analysis of dust systems in Khuzestan province. Geography and Development (in Persian)., 20: 97-118.
Tian, G., Qiao, Z. and Xu, X. (2014). Characteristics of particulate matter (PM10) and its relationship with meteorological factors during 2001–2012 in Beijing. Environ. Pollut., 192: 266-274.
Triantafyllou, A.G. (2001). PM10 pollution episodes as a function of synoptic climatology in a mountainous industrial area. Environ. Pollut., 112: 491-500.
Weihong, Q. Lingshen, Q. and Shaoyin, S. (2002). Variations of the Dust Storm in China and its Climatic Control. J. Climate., 15: 1216–1229.
Wang, W. and Fang, Z.Y. (2006). Numerical simulation and synoptic analysis of dust, emission and transport in East Asia. Global Planet Change., 52: 57-7.