in the population sciences published by the Max Planck Institute for Demographic Research Konrad-Zuse Str. 1, D-18057 Rostock · GERMANY www.demographic-research.org
DEMOGRAPHIC RESEARCH
VOLUME 27, ARTICLE 9, PAGES 233-260
PUBLISHED 10 AUGUST 2012
http://www.demographic-research.org/Volumes/Vol27/9/ DOI: 10.4054/DemRes.2012.27.9
Research Article
The contribution of smoking to regional
mortality differences in the Netherlands
Fanny Janssen
Alette Sigrid Spriensma
© 2012 Fanny Janssen & Alette Sigrid Spriensma.
This open-access work is published under the terms of the Creative Commons Attribution NonCommercial License 2.0 Germany, which permits use, reproduction & distribution in any medium for non-commercial purposes, provided the original author(s) and source are given credit.
1 Introduction 234
2 Data and methods 237
3 Results 238
4 Conclusion and discussion 245
4.1 Summary of our findings 245
4.2 A comparison of our findings to earlier results 246 4.3 Can the regional differences in smoking-attributable mortality be
fully assigned to smoking?
246 4.4 What factors explain the regional differences in past smoking and
subsequent smoking-attributable mortality?
248 4.5 Sex differences in the contribution of smoking and in regional
patterns of smoking-attributable mortality
249 4.6 Explaining the remaining regional variation in all-cause mortality 250 4.7 Overall conclusion and implications 251
5 Acknowledgements 251
The contribution of smoking to regional mortality differences
in the Netherlands
Fanny Janssen1,2 Alette Sigrid Spriensma3,4
Abstract
BACKGROUND
Smoking is an important preventable determinant of morbidity and mortality. Knowledge about its role in regional mortality differences can help us to identify relevant policy areas, and to explain national mortality differences.
OBJECTIVE
We explored the extent to which the regional differences in all-cause mortality in the Netherlands could be due to smoking by examining its link with regional differences in smoking-attributable mortality.
METHODS
All-cause mortality, lung cancer mortality, and population numbers were obtained from Statistics Netherlands for the period 2004-2008, by 40 NUTS-3 regions, age, and sex. Smoking-attributable mortality was estimated using an adapted indirect Peto-Lopez method. We mapped regional differences in age-standardised all-cause mortality, smoking-attributable mortality fractions, and smoking- and non-smoking-related
1 Corresponding author: Fanny Janssen, Population Research Centre, Faculty of Spatial Sciences, University
of Groningen, P.O. Box 800, 9700 AV Groningen, The Netherlands. Tel: +31 50 363 4421; Fax: +31 50 363 3901. E-mail: [email protected].
2 Unit PharmacoEpidemiology & PharmacoEconomics (PE2), Department of Pharmacy, University of
Groningen, Groningen, The Netherlands.
3 Department of Epidemiology and Biostatistics and the EMGO Institute for Health and Care Research, VU
University Medical Centre, P.O. Box 7057, 1007 MB Amsterdam, The Netherlands.
4
mortality rates. We assessed spatial clustering, calculated correlations, and compared and decomposed regional variance.
RESULTS
Significant regional differences in all-cause mortality, exhibiting a random pattern, were found. Smoking-attributable mortality fractions, which ranged from 22% to 30% among males and 7% to 14% among females, correlated significantly with all-cause mortality, especially among males. Smoking-attributable mortality varied far more than all-cause mortality, while non-smoking-attributable mortality varied less than all-cause mortality. The variance in smoking-attributable mortality contributed 39% to the regional variance in all-cause mortality among males, and 30% among females.
CONCLUSIONS
Smoking-attributable mortality thus clearly contributed to the regional differences in all-cause mortality, especially among males. This finding can be linked to past regional differences in smoking behaviour and underlying regional differences in socio-economic variables.
1. Introduction
It is well known that smoking is an important and preventable determinant of morbidity and mortality. Smoking contributes strongly to cancer of the lung, COPD, and cancer of the upper respiratory and digestive system; and to a lesser extent to coronary heart disease, stroke, and cancer of the bladder, stomach, kidney, and pancreas (U.S. Department of Health and Human Services 2004). Several studies have found large gaps in the life expectancies of smokers and non-smokers, amounting to between six and 10 years (Doll et al. 2004, Mamun et al. 2004, van Baal et al. 2006). Within Europe, smoking is the leading risk factor for premature mortality, and it has the greatest impact on the disease burden of all of the preventable lifestyle factors (World Health Organization 2002).
Consequently, smoking-attributable mortality in these regions has been decreasing for males, whereas for females, the peak is approaching. In Eastern Europe, smoking-attributable mortality among males is either peaking or just beginning to decline, whereas for females, it is still on the increase (Shafey, Dolwick, and Guindon 2003).
Because of the important international differences in smoking and subsequent smoking-attributable mortality (e.g. Ezzati and Lopez 2004), many studies on the determinants of all-cause mortality differences between countries have looked into the role of smoking, and have found that smoking has had a significant impact (e.g., Bobak and Marmot 1996; Spijker 2003; Janssen, Kunst, and Mackenbach 2007; Staetsky 2009; Preston, Glei, and Wilmoth 2010a; Rostron and Wilmoth 2011).
Less research has, however, been done on the determinants of regional or within-country all-cause mortality differences in general, even though regional mortality differences exist (e.g., Shaw et al. 2000; Vallin, Meslé and Valkonen 2001; Bonneux, Huisman, and de Beer 2010; Office for National Statistics 2010). Moreover, gaining insight into the preventable determinants of smoking may not only allow us to identify relevant policy areas; it can also help us to explain national mortality differences (Vallin and Meslé 2004). The existing studies on regional or within-country mortality differences have mentioned a potential role of smoking (e.g., Papastergiou et al. 2008; Bonneux, Huisman, and de Beer 2010), for example in relation to socio-economic differences in mortality (e.g., Kunst, Looman, and Mackenbach 1990; Spijker 2004; Mackenbach, Kunst, and Looman 1991; Mackenbach, Looman, and Kunst 1989), but these studies did not examine the contribution of smoking to all-cause mortality. To assess the impact of tobacco on society, estimates of smoking-attributable mortality are regarded as very useful tools (e.g., Oliveira, Valente, and Leite 2008; Perez-Rios and Montes 2008). Based on the literature reviews on smoking-attributable mortality (Oliveira, Valente, and Leite 2008; Perez-Rios and Montes 2008) we can conclude that many studies have estimated smoking-attributable mortality, although national-level studies are much more common than regional studies, and different estimation methods have been used. When detailed and accurate data on smoking prevalence are lacking, the indirect Peto-Lopez method (Peto et al. 1992) is seen as a powerful alternative (see as well Pampel 2005), especially as it also circumvents the issue of the time lag between changes in smoking prevalence and change in mortality (Tanuseputro et al. 2005). This method uses excess lung cancer mortality as a proxy for the cumulative exposure to smoking, which is then combined with relative risks of dying from smoking to estimate smoking-attributable mortality (Peto et al. 1992).
sex differences in all-cause mortality trends (e.g., Pampel 2002). At the regional and within-country levels, studies linking geographical differences in smoking-attributable mortality to explanations of mortality differences are especially rare. The studies we came across focused on explaining regional differences in cause-specific mortality, but not at the country level (Ezzati et al. 2005a; Ezzati et al. 2005b). At the within-country level, only very implicitly regional smoking-attributable mortality estimates have been compared with regional all-cause mortality (e.g., Tanuseputro et al. 2005).
The above clearly demonstrates the need for studies on the role of smoking in regional all-cause mortality differences.
Within the European Union, the Netherlands is among the countries that were the first to take up smoking, and that continue to have the highest percentage of daily smokers (World Health Organization 2010), although smoking prevalence is currently declining (STIVORO 2011). In particular, Dutch men born between 1897 and 1917 had a high level of lifetime exposure to smoking (Gunning-Schepers 1988), which is reflected in smoking prevalence rates among males of around 80% in the 1950s and 1960s. Among Dutch women, the highest level of smoking prevalence, 42%, was reported in the surveys of 1967 and 1970 (STIVORO 2011). Smoking-attributable mortality among Dutch males reached its peak around 1983, and started to decline thereafter. Smoking-attributable mortality among Dutch females has not yet reached its peak. In 2005, among the total Dutch population, there were almost 20,000 smoking-related deaths (Gelder, Hoogenveen, and Leent-Loenen 2010). In addition, about one-eighth of the total disease burden in the Netherlands can be attributed to the use of tobacco (de Hollander et al. 2006).
While earlier studies on regional mortality differences in the Netherlands mentioned the potential role of smoking (Kunst, Looman, and Mackenbach 1990; Kunst, Looman, and Mackenbach 1993; Mackenbach et al. 2004; Mackenbach, Kunst, and Looman 1991; Mackenbach, Looman, and Kunst 1989), none of these studies looked specifically at the role of smoking, or explicitly examined the Dutch regional variations in smoking-attributable mortality.
The objective of this paper is, therefore, to explore the extent to which the regional differences in all-cause mortality in the Netherlands could be due to smoking by examining the link between regional differences in all-cause mortality and regional differences in smoking-attributable mortality.
2. Data and methods
To study our objective, aggregated deaths by all-cause and lung cancer (ICD10: C33-34) over the period 2004-2008, by age (0-39, 40-44, …, 85-89, 90+), sex, and region (40 NUTS-3 level regions (the so-called COROP regions)) were obtained from the Cause of Death Statistics (Doodsoorzakenstatistiek) from Statistics Netherlands. The associated population numbers were obtained by five-year age groups.
To estimate smoking-attributable mortality by region, age, and sex, we used a more detailed but simplified application of the indirect Peto-Lopez method (Peto et al. 1992), which is based on relative risks for all-cause mortality instead of for specific causes of death, and data by five-year age groups (Mackenbach et al. 2004). In the first step, historical smoking exposure (p) was estimated by comparing the observed regional age- and sex-specific lung cancer mortality rates with the age- and sex-specific smoothed lung cancer rates of smokers and never-smokers of the ACS CPS-II study by five-year age groups (Peto et al. 1992). In the second step, the regional age- and sex-specific smoking-attributable mortality fractions—i.e., the proportion of all deaths attributable to smoking—was estimated as a function of the proportion of the population who are exposed to smoking (p) and the relative risk of smoking (RR), using the standard epidemiological formula for a so-called etiological fraction EF = p(RR-1)/(p(RR-1)+1). The age- and sex-specific relative risks were obtained by dividing the all-cause mortality rates among CPS-II smokers by the all-cause mortality rates among CPS-II non-smokers. In addition, a second level polynomial was fitted (Bonneux, Looman, and Coebergh 2003). To take into account residual confounding and to obtain conservative estimates of smoking-attributable mortality, the sex- and age-specific relative risks were adjusted downwards by reducing the excess risk by 30%, as was proposed by Ezzati and Lopez (2003). Smoking-attributable mortality rates were obtained by multiplying all-cause mortality rates with the obtained smoking-attributable mortality fractions. Non-smoking-attributable mortality rates were subsequently obtained by subtracting smoking-attributable mortality rates from all-cause mortality rates.
In analysing the data, we combined demographic and geographical techniques. Directly age-standardised crude death rates (ASCDR) were calculated for all-cause mortality, smoking-attributable mortality, and non-smoking-attributable mortality, by sex and region. The Dutch population by age and sex in 2004-2008 was used as a standard. Age-standardised smoking-attributable mortality fractions were calculated by dividing the ASCDR for smoking-attributable mortality with the ASCDR for all-cause mortality, again by sex and region.
rates, and non-smoking-attributable mortality rates, by sex, using ArcGIS. We classified our data according to five equally large intervals. The significance level of the difference in the age-standardised rates and in the smoking-attributable fractions between a specific NUTS-3 region and the Netherlands as a whole was assessed using the formula for the Z-score of the difference between proportions, assuming a normal distribution.
To determine whether regions with high (cause-specific) mortality rates were clustered together or were randomly distributed, spatial autocorrelation was assessed using global Moran’s I in ArcGIS. The global Moran’s I takes into account the difference between the region-specific ASCDR and the average for all regions combined. The values of the Moran’s I generally can run from minus one to one. Zero means the pattern is totally random, minus one indicates the values are distributed dispersedly, and one indicates a complete clustering of the values. (Mitchell 2005; Gatrell 2002)
To compare the regional variance between all-cause mortality, smoking-attributable mortality, and non-smoking-smoking-attributable mortality, we calculated the variance based on the comparative mortality figures (CMF). CMFs are the directly standardised mortality rates in a region, divided by the average mortality rate.
To assess the contribution of regional variance in smoking-attributable mortality to the regional variance in cause mortality, we decomposed the regional variance in all-cause mortality into the variance in smoking-attributable mortality, the variance in non-attributable mortality, and two times the covariance between smoking-attributable and non-smoking-smoking-attributable mortality. We used the age-standardised death rates for this purpose.
3. Results
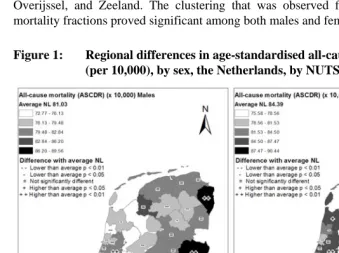
significantly lower ASCDR than average. According to the Moran’s I (see Table 1), a random non-significant pattern existed for ASCDR among both males and females.
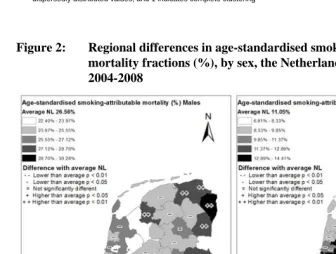
We estimated for the Netherlands as a whole that 26.6% of all-cause mortality was attributable to smoking among men, compared to just 11.0% among women. Age-standardised smoking-attributable mortality fractions ranged from 22.4% to 30.3% among males, with higher levels found in the eastern regions, especially in northern Limburg and in western and mid Noord-Brabant (see Figure 2). Lower levels were observed in the west, especially in regions surrounding the agglomeration of Haarlem. Among women, age-standardised smoking-attributable mortality fractions ranged from 6.8% to 14.4%, with low levels observed in Friesland, western Drenthe, north-western Overijssel, and Zeeland. The clustering that was observed for smoking-attributable mortality fractions proved significant among both males and females (Table 1).
Figure 1: Regional differences in age-standardised all-cause mortality rates (per 10,000), by sex, the Netherlands, by NUTS-3 region, 2004-2008
Table 1: Spatial clustering by cause of death and sex, the Netherlands, across 40 NUTS-3 regions, 2004-2008
Males Females
Moran’s I * p-value Moran’s I p-value
Age-standardised all-cause mortality rate 0.14 0.1661 -0.06 0.7577 Age-standardised smoking-attributable
mortality fraction 0.31 0.0059 0.29 0.0109
Age-standardised smoking-attributable
mortality rate 0.29 0.0102 0.19 0.0827
Age-standardised
non-smoking-attributable mortality rate -0.09 0.5820 0.16 0.1260
Notes: * a measure of spatial autocorrelation, which ranges from -1 to 1, where 0 indicates a totally random pattern, -1 indicates dispersedly distributed values, and 1 indicates complete clustering
Figure 2: Regional differences in age-standardised smoking-attributable mortality fractions (%), by sex, the Netherlands, by NUTS-3 region, 2004-2008
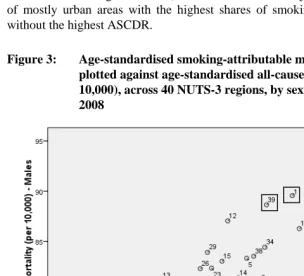
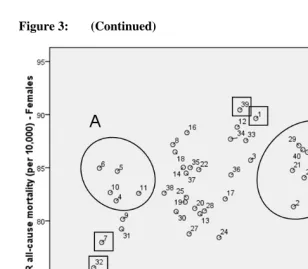
A clear correlation between age-standardised smoking-attributable mortality fractions and age-standardised all-cause mortality rates (ASCDR) across the 40 NUTS-3 regions were found to exist among males (Pearson correlation coefficient r = 0.78, p = 0.000). For females, the correlation was less strong (r = 0.49, p = 0.001) (see Figure 3). For both males and females, remaining Zeeland (32) and northern Drenthe (7) both had low smoking-attributable mortality fractions and low ASCDR, whereas eastern Groningen (1) and southern Limburg (39) both had high smoking-attributable mortality fractions and high ASCDR. Among women, two interesting “deviating” groups could be identified: group A consists of regions with low smoking-attributable mortality fractions and average ASCDR (Friesland, western Overijssel), while group B consists of mostly urban areas with the highest shares of smoking-attributable mortality, but without the highest ASCDR.
Figure 3: (Continued)
Notes: Males: r = 0.78, p = 0.000, Females: r = 0.49; p = 0.001 Source data: Statistics Netherlands. Own calculations.
Figure 4: Regional differences in age-standardised smoking-attributable mortality rates (per 10,000), by sex, the Netherlands, by NUTS-3 region, 2004-2008
Source data and shape-file: Statistics Netherlands. Own calculations.
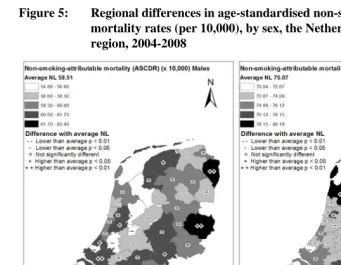
Figure 5: Regional differences in age-standardised non-smoking-attributable mortality rates (per 10,000), by sex, the Netherlands, by NUTS-3 region, 2004-2008
Source data and shape-file: Statistics Netherlands. Own calculations.
A comparison of the variance in the comparative mortality figure (CMF) and an additional F-test revealed statistically significantly larger regional differences for smoking-attributable mortality than for all-cause mortality (p=0.000). Women exhibited statistically significantly higher variance in smoking-attributable mortality (p=0.001) than men. For non-smoking-attributable mortality, the variance was statistically significantly lower than for all-cause mortality for males (p=0.015), and was also lower, but not statistically significant, for females (p=0.453). (Table 2)
Table 2: The variance of the comparative mortality figures (CMF) and associated F-tests, by cause of death and sex, the Netherlands, across 40 NUTS-3 regions, 2004-2008
Males Females
Variance
All-cause mortality rate (CMF) 23.34 16.14
Smoking-attributable mortality rate (CMF) 128.31 399.34
Non-smoking-attributable mortality rate (CMF) 10.55 12.67
p values F-test difference in variance
Smoking-attributable mortality vs. all-cause mortality 0.000 0.000
Non-smoking-attributable mortality vs. all-cause mortality 0.015 0.453
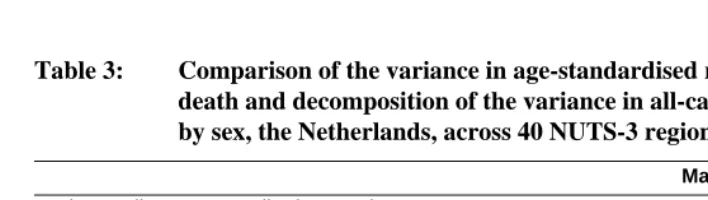
Table 3: Comparison of the variance in age-standardised rates by cause of death and decomposition of the variance in all-cause mortality rates, by sex, the Netherlands, across 40 NUTS-3 regions, 2004-2008
Males Females
Variance all-cause mortality (ASCDR) 15.32 11.49
Variance smoking-attributable mortality (ASCDR) 5.94 3.47
Variance non-smoking-attributable mortality (ASCDR) 3.74 7.14
Covariance smoking- and non-smoking-attributable mortality rates (ASCDRs)
2.82 0.48
Variance smoking-attributable mortality divided by variance all-cause mortality (ASCDRs)
0.39 0.30
4. Conclusion and discussion
4.1 Summary of our findings
males. Smoking-attributable mortality varied much more than all-cause mortality. Regional variance in CMF was smaller for non-smoking-attributable mortality than for all-cause mortality, although for females this was not statistically significant. The variance (age-standardised rates) in smoking-attributable mortality contributed 39% to the regional variance in all-cause mortality among males, and 30% among females.
4.2 A comparison of our findings to earlier results
As was noted in the introduction, there are very few studies linking smoking-attributable mortality to all-cause mortality differences within a single country. Tanuseputro et al. (2005) mentioned the increasing smoking-attributable mortality from west to east in Canada in 2000-2001, as well as the presence of a west-to-east gradient for life expectancy, but did not discuss these observations in any detail. In addition, the studies on within-country differences in smoking-attributable mortality often briefly describe the regional differences (e.g., Illing and Kaiserman 1995, 1999, 2004) without relating them to all-cause mortality differences. Within Europe, a paper about smoking-attributable mortality in Germany was recently published (Mons 2011). For the 16 German federal states, smoking-attributable mortality fractions were found to range from 18% to 23% among males, and from 4% to 10% among females. These levels are lower than those of the Netherlands, but the ranges are comparable, especially for females. It should be noted that any comparison of findings on regional variation is likely to be affected by the number of regions being compared and the degree of heterogeneity in the selected regions.
To our knowledge, only one recent study has quantified the role of smoking in within-country differences in all-cause mortality within Europe. Jenum, Stensvold, and Thelle (2001) observed for 25 districts in Oslo that the differences in the proportion of daily smokers aged 40 in 1985-1988 explained 70% of the differences in all-cause mortality among males aged 45-74 in 1991-1995, and 46% of the differences among females. Their finding of a higher contribution of smoking than we did in our research is likely because they used more restricted age groups.
4.3 Can the regional differences in smoking-attributable mortality be fully assigned to smoking?
method and from a recently introduced regression method by Preston, Glei, and Wilmoth (Preston, Glei, and Wilmoth 2010b), which showed its validity. Our estimates were, however, slightly higher for males than the estimates from Rostron’s modified version of the Preston et al. method, and from his modified version of the Peto-Lopez method (Rostron 2010). It is important to note, however, that any possible bias in, for example, the relative risks or the amount of adjustment being chosen will affect the different regions in the same manner, and thus will not affect the extent of the regional differences in smoking-attributable mortality.
What could have affected regional variations in smoking-attributable mortality is, however, the application of the same ratio between background lung cancer mortality (lung cancer mortality not due to smoking) and smoking-attributable lung cancer mortality for each region.
Lung cancer mortality might indeed stem not only from smoking, but also from environmental factors, like air contamination and passive smoking (Epstein 1974; Tyczynski, Bray, and Parkin 2003; Engholm, Palmgren, and Lynge 1996), as well as from exposure to certain occupational agents (e.g., arsenic, asbestos, chromium, nickel, and vinyl chloride) at shipyards, building insulation material building sites, metallurgical industry sites, and painting business sites (Williams and Sandler 2001). The relative role of smoking versus background mortality might therefore be different for different regions.
For the Netherlands, Kunst, Looman, and Mackenbach (1993) observed that regional differences in lung cancer mortality for the population aged 45-85+ in the Netherlands in 1980-84 showed clear associations with past smoking behaviour (for females smoking in 1972, for males 65+ smoking in 1930), some associations with past work in the transport and manufacturing industries (1971) (males aged 45-64 only), and strong associations with air contamination in 1979-80.
It should be noted, however, that the strong associations with air contamination were not regarded as solid evidence of an effect. More importantly, our observation of quite different patterns between the sexes in current smoking-attributable mortality— which are in line with the patterns for lung cancer mortality—suggest that the role of environmental factors may be small.
the role of smoking (Epstein 1974; Tyczynski, Bray, and Parkin 2003; Engholm, Palmgren, and Lynge 1996).
Instead, the observed clear regional patterns in smoking-attributable mortality in the Netherlands can be closely linked to the available—albeit scarce—data on regional differences in past smoking behaviour, taking into account a lag time of about 30-40 years (Lopez, Collishaw, and Piha 1994). Among women, data on smoking for 1972 and 1975 by province (NUTS-2) and sex for people aged 65 and over (van Reek 1979) showed consistently low levels of smoking in Friesland (4% and 5%) and Drenthe (6%), and also in Zeeland for 1975 (5%). The observed high levels of smoking among females in Noord-Holland (20% and 16%) and Zuid-Holland (16% and 13%) were also in line with our results. For males, data on both ages 55-64 (1972) and ages 65 and over (1972, 1975) are available, and showed consistently high percentages of smokers in Limburg: 82%, 74%, and 73%, respectively.
The observed regional differences in smoking-attributable mortality therefore seem to be primarily related to differences in past exposure to smoking, not to environmental factors, and potentially—though to a small extent—to regional differences in certain types of industries.
4.4 What factors explain the regional differences in past smoking and subsequent smoking-attributable mortality?
Among the factors that can contribute to the regional differences in both past smoking and subsequent smoking-attributable mortality are the regional differences in past socio-economic status (SES). We have observed high levels of smoking-attributable mortality in the province of Groningen, in southern Limburg, and in other regions in the east, which are traditionally less wealthy areas (Verkade, Vermeulen, and Brouwer 2006). However, not all of the regions that have traditionally had lower SES, including the peripheral regions, and especially the northern provinces (Verkade, Vermeulen, and Brouwer 2006), showed elevated smoking-attributable mortality, and not all of the traditionally richer regions showed lower smoking-attributable mortality. Thus, other factors seem to play a role as well.
high smoking-attributable mortality among women. Among men, smoking-attributable mortality was especially high in the more rural south, east, and northeast of the Netherlands.
Another potential factor could be religion. For the Netherlands, Mackenbach, Kunst, and Looman (1991) assigned the high standardised all-cause mortality ratios in the south of the Netherlands over the period 1980-1984 by the higher smoking prevalence in the 1970s among Roman Catholics, who live predominantly in these regions. These past differences in smoking prevalence might nowadays affect differences in smoking-attributable mortality. The higher smoking-attributable mortality in some regions in the south, which was only clearly observed for males, could indeed be due to religion.
In sum, regional differences in socio-economic status seem to be the most important—but not the only—factor that explains the regional differences in smoking and subsequent smoking-attributable mortality.
4.5 Sex differences in the contribution of smoking and in regional patterns of smoking-attributable mortality
Our results showed that smoking-attributable mortality, and thus past smoking behaviour, contributed to the regional differences in all-cause mortality, although these effects were especially clear among males, and were less clear among females. This difference between the sexes was also observed by Jenum, Stensvold, and Thelle (2001), and can, in our view, be linked to the differences between men and women in their experiences of the smoking epidemic (Lopez, Collishaw, and Piha 1994). In north-western Europe, men generally took up smoking first, with women following one or two decades later. By the time women took up smoking, more information was available about the negative effects of smoking, which led to a lower maximum smoking prevalence among females than among males. (Lopez, Collishaw, and Piha 1994) Data for the Netherlands in 1970 illustrate this striking sex difference: 42% of women smoked, compared to 75% of men (STIVORO 2011). Thus, smoking has been less widespread among women than among men, which leaves for women more room for contributions by other determinants in regional mortality differences.
Two likely explanations for the observed sex difference in the regional patterns in smoking-attributable mortality are (i) sex differences in the timing of the diffusion of the smoking epidemic from high-income regions to low-income regions, and (ii) sex differences in the association between urbanicity and smoking.
socio-economic status (SES) tend to adopt new lifestyles first, while people with lower SES tend to take up these lifestyles later, but then generally have more difficulty quitting (e.g., Fleischer 2010). This trend has indeed been observed for smoking (e.g., Kunst, Looman, and Mackenbach 1993). Because of the different timing between the sexes in the uptake of smoking, this diffusion is likely to have occurred first among males and later among females. Data for the Netherlands confirm this assumption. For the Netherlands in the 1960s, higher smoking prevalence was observed among males with lower SES than those with higher SES (aged 20+: 86%-87% vs. 70%-73%) and among females with higher SES than those with lower SES (aged 20-34: 60% vs. 51%; 35-49: 56% vs. 46%; and 50+: 30% vs. 18%) (van Reek 1982). In the 1970s, however, higher smoking prevalence was observed among both Dutch males and females (aged 20-49) with lower SES than among those with higher SES (males: aged 20+: 59%-67% vs. 54%-59%; females: aged 20-49: 53%-56% vs. 38%-41%) (van Reek 1982).
In considering the second explanation, it is important to note that, in recent years, the association between urbanicity, smoking, and lung cancer mortality seems to have become less pronounced for males (Schouten et al. 1996; Fleischer 2010). Also, in our study we found less evidence for a role of urbanicity among males than among females. This is in line with the increase in smoking prevalence among Dutch females in the 1970s, which still occurred predominantly in the urban population (Schouten et al. 1996, van Reek 1983). It is also likely that a diffusion process is taking place from urban to rural areas, which has already started for males, but is still less widespread among females.
4.6 Explaining the remaining regional variation in all-cause mortality
care, environment). In sum, factors in addition to smoking seem to have contributed to regional differences in all-cause mortality in the Netherlands.
4.7 Overall conclusion and implications
Our finding that smoking-attributable mortality is an important contributor to all-cause mortality—which can in turn be linked to past regional differences in smoking behaviour, mainly as a result of past regional differences in socio-economic variables— indicates that smoking behaviour can leave its mark on (regional differences in) mortality long before the associated mortality sets in.
Although they have been experiencing a decline in smoking prevalence in recent decades, the effects of smoking on mortality for the countries in the last phase of the smoking epidemic will remain for some time to come, based on current levels of smoking prevalence. For females, the role of smoking is expected to further expand due to on-going increases in smoking-attributable mortality in the coming years.
Regional differences in smoking-attributable mortality might become smaller as women, like men, reach the final stage of the smoking epidemic, and the differences in smoking prevalence between the sexes diminish. Accordingly, the diffusion of smoking behaviour from high- to low-income regions—and, potentially, from urban to rural areas—is likely to fade, as has already been observed for males.
5. Acknowledgements
We wish to thank Statistics Netherlands for supplying the data, Marinus de Bakker and Elena Uibel from the Groningen Centre for Spatial Information (CRIG) for their assistance in using ArcGIS, and Leo van Wissen (Population Research Centre, Groningen; Netherlands Interdisciplinary Demographic Institute) for his feedback on the methodology.
References
Bobak, M. and Marmot, M. (1996). East-West mortality divide and its potential explanations: Proposed research agenda. British Medical Journal 312(7028): 421-425. doi:10.1136/bmj.312.7028.421.
Bonneux, L.G., Huisman, C.C., and de Beer, J.A. (2010). Mortality in 272 European countries, 2002-2004: An update. European Journal of Epidemiology 25(2): 77-85. doi:10.1007/s10654-009-9415-y.
Bonneux, L.G., Looman, C.W.N., and Coebergh, J.W. (2003). Mortality because of smoking in the Netherlands: 1.2 million deaths caused by tobacco between 1950 and 2025 [in Dutch]. Nederlandsch Tijdschrift voor Geneeskunde 147(19): 917-921.
De Hollander, A.E.M., Hoeymans, N., Melse, J.M., Oers, J.A.M., and van Polder, J.J. (eds.) (2006). VTV Public Health Forecast 2006 – Care for health. Houten: Bohn Stafleu van Loghum.
Doll, R., Peto, R., Boreham, J., and Sutherland, I. (2004). Mortality in relation to smoking: 50 years’ observations on male British doctors. Journal of Epidemiology and Community Health 58(11): 930. doi:10.1136/bmj.38142.554 479.AE.
Engholm, G., Palmgren, F., and Lynge, E. (1996). Lung cancer, smoking, and environment: A cohort study of the Danish population. British Medical Journal 312(7041): 1259-1263. doi:10.1136/bmj.312.7041.1259.
Epstein, S.S. (1974). Environmental determinants of human cancer. Cancer Research 34(10): 2425-2435.
Ezzati, M., Henley, S.J., Lopez, A.D., and Thun, J. (2005a). Role of smoking in global and regional cancer epidemiology: Current patterns and data needs. International Journal of Cancer 116(6): 963-971. doi:10.1002/ijc.21100.
Ezzati, M., Henley, S.J., Thun, M.J., and Lopez, A.D. (2005b). Role of smoking in global and regional cardiovascular mortality. Circulation 112(4): 489-497.
doi:10.1161/CIRCULATIONAHA.104.521708.
Ezzati, M. and Lopez, A.D. (2004). Regional, disease specific patterns of smoking-attributable mortality in 2000. Tobacco Control 13(4): 388-395. doi:10.1136/tc. 2003.005215.
Fleischer, N.L. (2010). Social patterning of chronic disease risk factors: Cross-national and within-country comparison. [PhD thesis]. Ann Arbor: University of Michigan, Epidemiological Science.
Gatrell, A.C. (2002). Geographies of Health: An Introduction. Oxford, UK: Blackwell Publishers Ltd.
Gelder, B.M., Hoogenveen, R.T., and Leent-Loenen, H.M.J.A. (2010). What are the possible health consequenses of smoking? [in Dutch]. Bilthoven: RIVM. http://www.nationaalkompas.nl/gezondheidsdeterminanten/leefstijl/roken/wat-zijn-de-mogelijke-gezondheidsgevolgen-van-roken/.
Gunning-Schepers, L.J. (1988). The Health Benefits of Prevention. A Simulation ity Rotterdam.
Approach. Rotterdam: Erasmus Univers
Illing, E.M. and Kaiserman, M.J. (1995). Mortality attributable to tobacco use in
Canada and its regions, 1991. Canadian Journal of Public Health 86(4): 257-265.
Illing, E.M. and Kaiserman, M.J. (1999). Mortality attributable to tobacco use in
Canada and its regions, 1994 and 1996. Chronic Diseases in Canada 20(3): 111-117.
Illing, E.M. and Kaiserman, M.J. (2004). Mortality attributable to tobacco use in
Canada and its regions, 1998. Canadian Journal of Public Health 95(1): 33-44. Janssen, F., Kunst, A., and Mackenbach, J. (2007). Variations in the pace of old-age
mortality decline in seven European countries, 1950–1999: The role of smoking and other factors earlier in life. European Journal of Population 23(2): 171-188.
doi:10.1007/s10680-007-9119-5.
Jenum, A.K., Stensvold, I., and Thelle, D.S. (2001). Differences in cardiovascular disease mortality and major risk factors between districts in Oslo. An ecological analysis. International Journal of Epidemiology 30(Suppl.1): 59-65. doi:10.10 93/ije/30.suppl_1.S59.
Kunst, A.E., Looman, C.W.N., and Mackenbach, J.P. (1993). Determinants of regional differences in lung cancer mortality in the Netherlands. Social Science & Medicine 37(5): 623-632. doi:10.1016/0277-9536(93)90101-9.
Lopez, A.D., Collishaw, N.E., and Piha, T. (1994). A descriptive model of the cigarette epidemic in developed countries. Tobacco Control 3(3): 242-247. doi:10.1136/ tc.3.3.242.
Mackenbach, J.P., Huisman, M., Andersen, O., Bopp, M., Borgan, J.K., Borrell, C., Costa, G., Deboosere, P., Donkin, A., Gadeyne, S., Minder, C., Regidor, E., Spadea, T., Valkonen, T., and Kunst, A.E. (2004). Inequalities in lung cancer mortality by the educational level in 10 European populations. European Journal of Cancer 40(1): 126-135. doi:10.1016/j.ejca.2003.10.018.
Mackenbach, J.P., Looman, C.W.N., and Kunst, A.E. (1989). Geographic variation in the onset of decline of male ischemic heart disease mortality in the Netherlands. American Journal of Public Health 79(12): 1621-1627. doi:10.2105/AJPH.79. 12.1621.
Mackenbach, J.P., Kunst, A.E., and Looman, C.W.N. (1991). Cultural and economic determiniants of geographical mortality patterns in the Netherlands. Journal of Epidemiology and Community Health 45(3): 231-237.
Mamun, A.A., Peeters, A., Barendregt, J., Willekens, F., Nusselder, W., and Bonneux, L.G. (2004). Smoking decreases the duration of life lived with and without cardiovascular disease: A life course analysis of the Framingham Heart Study. European Heart Journal 25(5): 409-415. doi:10.1016/j.ehj.2003.12.015.
Mitchell, A. (2005). The ESRI guide to GIS analysis: Volume 2: Spatial measurements and statistics. Redlands, California: ESRI Press.
Mons, U. (2011). Tobacco-Attributable Mortality in Germany and in the German Federal States - Calculations with data from a microcensus and mortality statistics. Gesundheitswesen 73(4): 238-246. doi:10.1055/s-0030-1252039. Office for National Statistics (2010). Life expectancy at birth and at age 65 by local
areas in the United Kingdom, 2007-09. Statistical Bulletin 19 October 2010. Newport: Office for National Statistics.
Pampel, F.C. (2002). Cigarette use and the narrowing sex differential in mortality. Population and Development Review 28(1): 77–104. doi:10.1111/j.1728-4457. 2002.00077.x.
Pampel, F.C. (2005). Forecasting sex differences in mortality in high income nations: The contribution of smoking. Demographic Research 13(18): 455–484.
doi:10.4054/DemRes.2005.13.18.
Papastergiou, P., Rachiotis, G., Polyzou, K., Zilidis, C., and Hadjichristodoulou, C. (2008). Regional differences in mortality in Greece (1984-2004): The case of Thrace. BMC Public Health 8: 297. doi:10.1186/1471-2458-8-297.
Perez-Rios, M. and Montes, A. (2008). Methodologies used to estimate tobacco-attributable mortality: A review. BMC Public Health 8(22): 1-11. doi: 10.1186/1471-2458-8-22.
Peto, R., Boreham, J., Lopez, A.D., Thun, M.J., and Heath, C. (1992). Mortality from tobacco in developed countries: Indirect estimation from national vital statistics. The Lancet 339(8804): 268-278. doi:10.1016/0140-6736(92)91600-D.
Preston, S.H., Glei, D.A., and Wilmoth, J.R. (2010a). Contribution of smoking to international differences in life expectancy. In: Crimmins, E.M., Preston, S.H., and Cohen, B. (eds.). International differences in mortality at older ages: Dimensions and sources. Washington DC: National Academic Press: 105-131.
Preston, S.H., Glei, D.A., and Wilmoth, J.R. (2010b). A new method for estimating smoking-attributable mortality in high-income countries. International Journal of Epidemiology 39(2): 430-438. doi:10.1093/ije/dyp360.
Rostron, B.L. (2010). A modified new method for estimating smoking-attributable mortality in high-income countries. Demographic Research 23(14): 399-420.
doi:10.4054/DemRes.2010.23.14.
Rostron, B.L. and Wilmoth, J.R. (2011). Estimating the effect of smoking on slowdowns in mortality declines in developed countries. Demography 48(2): 461-479. doi:10.1007/s13524-011-0020-9.
Schouten, L.J., Meijer, H., Huveneers, J.A.M., and Kiemeney, L.A.L.M. (1996). Urban-rural differences in cancer incidence in the Netherlands, 1989-1991. International Journal of Epidemiology 25(4): 729-736. doi:10.1093/ije/25.4.729. Shafey, O., Dolwick, S., and Guindon, G.E. (eds.) (2003). Tobacco Control Country
Shaw, M., Orford, S., Brimblecombe, N., and Dorling, D. (2000). Widening inequality in mortality, between 160 regions of 15 European countries in the early 1990s. Social Science & Medicine 50(7-8): 1047-1058. doi:10.1016/S0277-9536(99)00 354-8.
Spijker, J. (2003). Socioeconomic and other determinants of mortality differences in Europe: A pooled, cross-country, time-series analysis. Barcelona: Centre d’Estudis Demogràfics.
Spijker, J. (2004). Socioeconomic determinants of regional mortality differences in Europe. [PhD thesis]. Amsterdam: University of Groningen, Spatial Sciences. Staetsky, L. (2009). Divergent trends in female old-age mortality: A reappraisal.
Demographic Research 21(30): 885-914. doi:10.4054/DemRes.2009.21.30. Statistics Netherlands (2008). Division of the Netherlands in 40 COROP (NUTS-3)
regions, 2008. [in Dutch]. Heerlen: Statistics Netherlands. http://www.cbs.nl/nl-NL/menu/themas/dossiers/nederland-regionaal/publicaties/
publicaties/archief/2008/2008-regionale-kaarten-pub.htm.
STIVORO (2011). Trendpublication smoking prevalence 2010 [in Dutch]. Den Haag: STIVORO. http://www.stivoro.nl/Voor_volwassenen/Feiten___Cijfers/index.aspx. Tanuseputro, P. Manual, D.G., Schultz, S.E., Johansen, H., and Mustard, C.A. (2005). Improving population attributable fraction methods: Examining smoking-attributable mortality for 87 geographic regions in Canada. American Journal of Epidemiology 161(8): 787-798. doi:10.1093/aje/kwi093.
Tyczynski, J.E., Bray, F., and Parkin, D.M. (2003). Lung cancer in Europe in 2000: Epidemiology, prevention, and early detection. The Lancet 4(1): 45-55.
doi:10.1016/S1470-2045(03)00960-4.
U.S. Department of Health and Human Services (2004). The Health Consequences of Smoking: A report of the Surgeon General. Atlanta: Centers for Disease Control and Prevention, National Center for Chronic Disease Prevention and Health Promotion, Office on Smoking and Health.
Vallin, J. and Meslé, F., (2004). Convergences and divergences in mortality. A new approach to health transition. Demographic Research Special Collection 2(2): 11-44. doi:10.4054/DemRes.2004.S2.2.
van Baal, P.H.M., Hoogenveen, R.T., de Wit, G.A., and Boshuizen, H.C. (2006). Estimating health-adjusted life expectancy conditional on risk factors: Results for smoking and obesity. Population Health Metrics 4(14): 1-13.
van Reek, J. (1979). Smoking and mortality: Explanatory research using provincial data [in Dutch]. Maastricht: Maastricht University.
van Reek, J. (1982). Mortality and socio-economic indicators in the Netherlands. Maastricht: University of Limburg.
van Reek, J. (1983). Smoking behaviour in the Netherlands, 1958-1982 [in Dutch]. Tijdschr Alcohol Drugs 9: 99.
Verkade, E., Vermeulen, W., and Brouwer, J. (2006). Regional developments, population and employment [in Dutch]. In: Welfare, Prosperity and Quality of the Living Environment [in Dutch]. The Hague: CPB & PBL: 17-43.
Völzke, H., Neuhauser, H., Moebus, S., Baumert, J., Berger, K., Stang, A., Ellert, U., Werner, A., and Döring, A. (2006). Urban-rural disparities in smoking behaviour in Germany. BMC Public Health 6: 146. doi:10.1186/1471-2458-6-146.
Williams, M.D. and Sandler, A.B. (2001). The epidemiology of lung cancer. Cancer Treatment & Research 105: 31-52.
World Health Organization (2002). The World Health Report 2002: Reducing risks, promoting healthy life. Geneva: WHO.
World Health Organization (2010). European Health for All Database. Copenhagen: WHO. http://data.euro.who.int/hfadb/.
Appendix
Figure A: Map with the 40 NUTS-3 (=COROP) regions in the Netherlands
4
3
6
7
8
13
1
14
12
10
36
17
9
35
5
29
33
15
40
18
34
37
23
16
31
38
32
39
2
28
30
11
19
24
26
25
20
27
21
1. Eastern Groningen 11. South-western Overijssel 21. Agglomeration Haarlem 31. Zeeuwsch-Vlaanderen 2. Delfzijl and
surroundings
12. Twente 22. Zaanstreek 32. Remaining Zeeland
3. Remaining Groningen
13. Veluwe 23. Great Amsterdam 33. Western
Noord-Brabant
4. Northern Friesland 14. Achterhoek 24. The Gooi and
Vechtstreek
34. Mid Noord-Brabant
5. South-western Friesland
15. Arnhem and Nijmegen 25. Agglomeration Leiden and Bollenstreek 35. North-eastern Noord-Brabant 6. South-eastern Friesland 16. South-western Gelderland 26. Agglomeration The Hague 36. South-eastern Noord-Brabant
7. Northern Drenthe 17. Utrecht 27. Delft and
Westland
37. Northern Limburg
8. South-eastern Drenthe
18. Upper north Noord-Holland
28. Eastern Zuid-Holland
38. Mid Limburg
9. South-western Drenthe
19. Alkmaar and surroundings
29. Great Rijnmond 39. Southern Limburg
10. Northern Overijssel 20. IJmond 30. South-eastern
Zuid-Holland
40. Flevoland