Journal of Chemical and Petroleum Engineering, University of Tehran, Vol. 46, No.1, Jun. 2012, PP. 1-11 1
* Corresponding author: Tel: +98-21-66165423 Fax: +98- 21-66022853 Email: [email protected]
Modeling and Optimization of Fixed-Bed Fischer-Tropsch
Synthesis Using Genetic Algorithm
Arezoo Sadat Emrani*1, Mohammad Saber2, Fatola Farhadi1
1 Department of Chemical and Petroleum Engineering, Sharif University of Technology,
Tehran, Iran
2 Department of Energy Engineering, Sharif University of Technology, Tehran, Iran
(Received 29 May 2012, Accepted 26 June 2012)
Abstract
In this paper, modeling and optimization of Fischer-Tropsch Synthesis is considered in a fixed-bed catalytic reactor using an industrial Fe-Cu-K catalyst. A one dimensional pseudo-homogenous plug flow model without axial dispersion is developed for converting syngas to heavy hydrocarbons. The effects of temperature, pressure, H2 to CO ratio in feed stream, and CO molar flow on the mass flow
rate of the desired product (C5+) are investigated. Since the Fischer-Tropsch synthesis produces a wide
range of hydrocarbon products, it is important to optimize the reactor operating parameters and feed conditions to maximize yield of reactor. Genetic algorithm was used as the optimization algorithm in this study. The processing variables are defined in the following ranges: Temperature: 493-542 K, Pressure: 10.9-30.9 bar, CO molar flow: 0.0815-0.3074 gmole/s and the H2/CO feed ratio: 0.98-2.99. A
reactor model was developed and along with appropriate reaction kinetics, the performance of the reactor was investigated. Model results were in good agreement with experimental data. After validating the model, the production of C5+ was optimized. The results indicated that the production of C5+
increased with increasing pressure while it decreased with increasing temperature, H2/CO ratio, and CO
molar flow rate in the feed stream.
Keywords
: Fischer-Tropsch synthesis, Fixed-bed reactor, Genetic algorithm, Modeling, OptimizationIntroduction
Fischer-Tropsch synthesis (FTS) converts syngas into a wide range of products including linear hydrocarbons and oxygenates. It is a promising and environmentally friendly option for production of transportation fuels such as gasoline and diesel from biomass, coal and natural gas. Various types of reactors (including fixed-bed, fluidized-bed and slurry phase) have been considered in the history of FTS process development [1]. The fixed-bed type reactor is one of the innovations being used in an industrial scale by Sasol over an iron-based catalyst [2] and by Shell [3].
Modeling of fixed-bed Fischer-Tropsch reactor has been performed in several previous investigations. Wang et al. [1] have proposed a one-dimensional heterogeneous reactor model to investigate the performance of fixed-bed Fischer-Tropsch reactor for hydrocarbon production. Jess and Kern [4] developed a two dimensional pseudo-homogeneous
model for multi-tubular reactors for FTS. The modeling of FTS using biosyngas in a single tube fixed-bed reactor over cobalt catalyst has been carried out by Rafiq et al [5].
2 Journal of Chemical and Petroleum Engineering, University of Tehran, Vol. 46, No.1, Jun. 2012 in several studies [8]. Schweitzer and
Viguié have investigated reactor modeling of a slurry bubble column for FTS with considering the gas recycle after condensation step [9]. Modeling and product grade optimization of FTS in a slurry reactor has been carried out by Fernandes [10]. Modeling and optimization of a large-scale slurry bubble column reactor for producing 10,000 bbl/day of Fischer–Tropsch liquid hydrocarbons have been investigated by Sehabiague et al [11]. In the present study, FTS and Water Gas Shift (WGS) reactions were considered in a fixed-bed reactor with a novel industrial catalyst. A one dimensional pseudo-homogenous reactor model was developed under non-isothermal and steady state conditions followed by optimization of operating conditions to maximize C5+
production as the desired product. The desired product (C5+) has been considered to
be in the range of C11 to C27. Genetic
Algorithm (GA) was used in the optimization procedure.
2. The development of the rector
model
2.1. Model assumptions:
The reactor was considered as a tubular fixed-bed reactor with length L and inner diameter din packed with a bed of Fe-Cu-K
catalyst. The main reactions are the following combination of FTS and WGS reactions:
1- Olefin formation reactions:
nCO + 2nH2 CnH2n + nH2O (1)
2- Paraffin formation reactions:
nCO + (2n+1)H2 CnH2n+2 + nH2O
(2) 3- Water gas shift reaction:
CO + H2O CO2 + H2 (3)
The main assumptions in the developed model are:
1- Non-isothermal condition is assumed as there is a considerable temperature change along the reactor.
2- Pressure drop across the bed is insignificant with the particle sizes and flow rates employed in this study (Wang et al., 2003).
3- A one dimensional plug flow model without axial dispersion.
The intrinsic reaction rates over an industrial Fe-Cu-K catalyst proposed by Wang et al. [12] were used in this study. It should be noted that, to match the conditions of the exclusion of intra-particle and external diffusion limitations, the kinetics experiments are performed by using small particle sizes and high space velocities. The sizes of catalyst particle used are within the recommended size range (<0.2 mm) for intrinsic FTS kinetics measurements [12].
2.2. Mathematical model
A one-dimensional pseudo-homogenous model was selected to simulate a tubular fixed-bed Fischer-Tropsch reactor. The reactor is therefore a multi-tubular shell with boiling water as the coolant in the shell. The mass and energy balance equations for the bulk gas phase could be written as follows [13]:
u C ρ TZ ρ 1 εB ∑NR ∆H R 4 U T T (4)
d U C
dz ρ 1 εB R (5)
The initial conditions for the inlet bulk phase were:
At Z=0: Ci = Ci,0, P=Pin, Tg = Tin
The mass and energy balance equations were solved with an ODE solver in MATLAB environment. The preferred fixed-bed reactor type is multi-tubular with the catalyst placed inside the tubes and cooling medium (pressurized boiling water) on the shell sides within the range of 503-533 K [14].
The tube-side heat transfer coefficient (hi)
Modeling and Optimization of ….. 3
calculation of overall heat transfer coefficient (U). Moreover, hi and ho were
calculated by Leva’s correlation [15]. The superficial gas velocity (us) along the
reactor axis was calculated based on the total mass flux and the local density of the gas mixture (ρg). The other required
properties such as fo, fi and kw were
obtained from references [16, 17].
2.3. Kinetics of FTS and WGS reactions:
The intrinsic reaction rates for FTS and WGS reactions over an industrial Fe-Cu-K catalyst, given by equations (6) to (9), were proposed by Wang et al. [12] using an experimental reactor consisting of a stainless steel tubing with inner diameter of 18 mm and an effective bed length of approximately 300mm. Experiments were carried out by using catalyst particles with a diameter between 0.15 and 0.18 mm (80– 100 ASTM mesh) (Wang et al., 2003).
Catalyst pretreatment, which essentially leads to a reduction of Fe2O3 to Fe3O4 and
FexC, is necessary in order to obtain an
active catalyst with good stability. The crystal phase changes of the fresh and used catalysts are characterized by using Powder X-ray Diffraction (XRD) test. The results of XRD test shows that the magnetite (Fe3O4)
is the dominant iron phase observed in the used catalysts and the peak characteristics of carbide (Fe5C2) are clearly evident. For
the unreduced fresh catalyst, the majority of peaks can be attributed to Fe2O3 (Wang et
al., 2003).
a) For paraffin’s reactions: RCH
k PH α
1 K K K 1 PH O
PH
1 K K P1H
1
K ∑N ∏ α (6) For n ≥ 2 :
RC H
k PH ∏ α
1 K K K 1 PH O
PH
1 K K P1H
1
K ∑N ∏ α (7) b) For olefin’s reactions:
RC H
k 1 β ∏ α
1 K K K1 PH O
PH
1 K K PH1
1
K ∑N ∏ α (8) c) For WGS reaction:
RCO
k PCOPH O
PH. P CO PH.
KP
1 K PCOPH O
PH.
(9) where α1 and αn are calculated from
equations (10) and (11):
α k PCO
k PCO k MPH n 1 (10)
α k PCO
k PCO k PH k 1 βn
n 2
(11)
And βn in equation (8) is defined in by:
β k k
PC H
αA k Pk PCO CO k PH
k
k PCO k PH k
(12) and αA in equation (12) is defined as:
αA k PCO
k PCO k PH k n 1 (13)
Temperature dependence of the reaction rate constants are given by an Arrhenius-type equation:
k T k, exp Ei
RT (14)
The equilibrium constant for the WGS reaction is estimated using equation (15):
lnKP 5078.0045
T 5.8972089 13.958689 x 10 T 27.592844 x 10 T
4 Journal of Chemical and Petroleum Engineering, University of Tehran, Vol. 46, No.1, Jun. 2012 Partial pressure of component i is
calculated using equations (16) and (17): Pi =C0(1-X)RT, for feed (16)
Pi = C0XRT, for paraffin and
olefin (17)
Rate parameters are summarized in Table 1 as reported by Wang et al. [12].
3. Results and discussion
The reactor model along with the reaction kinetics outlined by Wang et al. [12] were used to investigate the effect of various operating parameters on the C5+
yield from the experimental reactor used by Wang et al. [12]. Typical results are presented in Figure 1 for the effect of reaction pressure and feed flow rate on the C5+ yield indicating that when all other
parameters are remained unchanged, the C5+
yield would increase with increasing reactor pressure and decrease with increasing feed flow rate. Other important operating variables, including reaction temperature and the H2 to
CO ratio in the feed, can affect the overall reactor performance and thus a set of operating conditions would exist that optimizes the performance of the reactor.
Before proceeding with the optimization algorithm to identify the optimum conditions, the validity of the reactor model along with the proposed reaction kinetics was tested using the experimental data reported by Wang et al. [12]. The agreement between predicted and experimental product flow rates are presented in Figure 2 for CO, H2, CO2, CH4, H2O, and C5+ products. The
AARE (Absolute Average Relative Error) defined by equation (18) can be used as a criteria for model’s accuracy evaluation. These are reported in Table 2 for different components indicating a fair overall agreement.
AARE 1 n
C cal C exp C exp
100
(18)
Table 1: Parameter values for FT-WGS reactions [12]
Table 2: AARE for different components for evaluation of predicted yields versus experimental data by [12]
Component AARE, %
CO 9.95
H2 8.44
H2O 2.31
CO2 6.21
CH4 5.23
C5+ 10.79
Parameter Dimension Estimate Parameter Dimension Estimate k1 mol.g-1.bar-1.s-1 2.23x10⁻⁵ kv,0 mol.g-1.bar-1.s-1 15.7
k5m,0 mol.g-1.bar-1.s-1 4.65x10³ Ev kJ.mol-1 45.08
E5m kJ.mol-1 92.89 k-6 mol.g-1.bar-1.s-1 2.75x10⁻⁵
k5,0 mol.g-1.bar-1.s-1 2.74x10² Kv bar-0.5 1.13x10⁻³
E5 kJ.mol-1 87.01 K2 - 1.81x10⁻²
k6,0 mol.g-1.bar-1.s-1 2.66x10⁶ K3 - 4.68x10⁻²
Modelin (a T = 4. Optim After conditio compon obtained of the tempera and CO which c K, 10.9 0.3074 optimiz follows
GA i algorith of-the-f propose develop has been various image [20]. In with an populati successi Each
ng and Optimiza
a): Effect of pr = 518.15 K, F =
Figu
mization
validating ons to maxi nents in th d using GA e optimiz ature (T), p O inlet flow could vary w 9-30.9 bar, gmole/s ation probl :
Find: T, P Maximize Subject to 493 < T < 10.9 < P < 0.98 < H2
0.0815 < is a popul hm based on
fittest theor ed by Ho ped by Gold n widely an problems processing n GA, the
initial set o ion. The po ive iteratio
population
ation of …..
ressure on C5+
= 400 ml/min
ure 1: The
the model, imize the flo he product A. The deci
zation pr pressure (P) w rate to the within rang 0.98-2.99, s, respec lem can be P, H2/CO, F
e: C5+ mass
o: < 542 K
< 30.9 bar
2/CO < 2.99
FCO < 0.307
ation-based n the Darwi ry. The a lland [18] dberg [19] a nd successfu
like opera and cont solution pr of random so opulations e
ons, called contains
+ yield (g/s) at
n, H2/CO = 1.9 effect of op
, the optim ow rate of stream w ision variab roblem w ), H2/CO ra
e reactor (F ges of 493-5
, and 0.08 ctively. T
formulated
CO
flow rate (g
9
74 gmole/s d optimizat
inian surviv algorithm w
and furt and others. G fully applied ation resear trol proble rocedure sta olutions cal evolve throu d generati a set t 92 perating pa mum C5+ were bles were atio FCO)
542 15-The d as g/s) tion val-was ther GA d to rch, ems arts lled ugh ion. of ind chr dec iter ind par gen pop sol GA cro sel Cr cre nex ran T sim Th pot opt are var fea com opt var Wo tho
(b): Effect of T = 518.15 K
arameters o dividuals romosome cimal vari ration, th dividuals fr rents to pro neration. Ov pulation e lution. To c A uses ossover, and lects the ossover ope eate childre xt generatio ndom chang The main c multaneous his feature p tentially av timum. Som e [21]: Optimizes riables, Doesn’t req Simultaneo asible region Optimizes mplex objec May enco timization riables, and orks with e ose that thei
f flow rate on K, P = 20.92 ba
on the C5+ y
called ch contains a ables calle he GA rom the cur oduce the ch
ver success evolves to create the n
three ope d mutation.
individuals erator comb en, called o on. Mutatio ges to indivi
haracteristi evaluation provides a w voiding conv
me of the
with cont quire deriva ously search n of decisio
variables ctive functio
de the var is done d
xplicit obje ir explicit fo
C5+ yield (g/s
ar, H2/CO = 1 yield
hromosome string of b ed gene. A
randomly rrent popul hildren for ive generat ward an next generat erators: s . Selection s to be bines two pa off-springs, on operator
iduals. c of the GA
of many so wide search
vergence to advantages
tinuous or ative inform hes a wide on variables with ex on, riables so with the ective functi
orm is not a
5 ) at .94 . Each binary or At each selects lation as the next ions, the optimal tion, the election, operator parents. arents to for the r applies A is the olutions.
and it is o a local s of GA
6
Fig
gure 2: Comp
Journal of Ch
(a)
(c)
(e) parison of mo
a)
emical and Petr
odel predicte CO, b) CO2,
roleum Enginee
d product flo c) H2, d) H2O
ering, Universit
ow rates with O, e) CH4, f) C
ty of Tehran, V
(b)
(d)
(f) experimenta C5+
Vol. 46, No.1, Ju
al values [12]
un. 2012
for
Modelinng and Optimiza
Variable Pressure Temperature CO Molar Fl Feed Stream H2/CO Ratio
ation of …..
Fi
Ta
T
e
low Rate in m
o
igure 3: The
able 3: The be Parame Population
Crossover Mutation No. of Gene
Table 4: Opt Unit
Bar K gmole / s
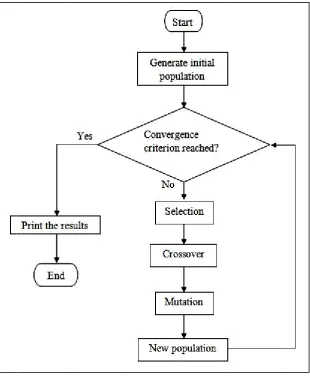
general flowc
est values for eter
n Size r Rate n Rate erations
imum operat Lower Boun
10.9 493 0.0815
0.98
chart of the G
GA paramet Value
50 70 % 10 % 39
ting condition nd Upper B
30 54 0.30 2.9
GA
ters
ns Bound 0.9 42 074 99
Optimum 30.9
493 0.0815
0.98
8 Journal of Chemical and Petroleum Engineering, University of Tehran, Vol. 46, No.1, Jun. 2012 In binary GA each chromosome is a
binary string and only can take a value of 0 or 1. Each decision variable of the optimization problem should be mapped to a binary string whose length depends on the feasible range and the precision of the decision variable. In the problems with continuous decision variables, each variable requires many bits to be represented in binary codes. If the number of variables is large, the size of the chromosome is also large. Hence, when the variables are continuous, it is more logical to represent them by real numbers. The continuous GA also has the advantage of requiring less memory and is inherently faster than the binary GA since the chromosomes do not have to be decoded prior to the evaluation of the cost function [21]. In this paper, the continuous GA was written in MATLAB platform as all variables were continuous.
The general flowchart of the GA is presented in Figure 3. In order to select the parents, the rank weighing random pairing method was used [21]. The selection of the chromosomes would begin by ranking the individuals according to their fitness function. Then the probability of the ith chromosome in the population was calculated as follows where Npop is the
population size:
P N i 1
∑N i (19)
After calculating the cumulative probabilities of the chromosomes, a random number between zero and one was generated. Starting at the top of the list, the first chromosome with a cumulative probability that was greater than the random number was selected as a parent. To create the off-springs from parents, arithmetic crossover was applied in which the off-springs were obtained through the following equations [21]:
Offspring β Parent 1 β Parent
(20)
Offspring β Parent 1 β Parent
(21) where β is a random variable between zero and one.
The crossover operation was applied with a rate called crossover rate which was the percentage of off-springs that were created by crossover that usually takes a value between 60 to 80%. The rest of the off-springs of the next generation were the best chromosomes of the previous generation which transfer to the next generation without any change. The latest is called elitism which is commonly applied in GA [21]. After crossover, the mutation operator applies random changes to individuals. The mutation operator is used to ensure the diversity of the population and to avoid the GA to converge too quickly to a local minimum especially for functions which have many local minima. In this operation, some of the genes are randomly selected and then their values are replaced by new random values. The number of genes which undergo mutation is determined by the mutation rate which is the percentage of all genes that are mutated. To achieve the best solution of objective function, the GA parameters - including population size, crossover rate and mutation rate, were tuned by testing different values. These tuned values are shown in Table 3.
The production of C5+ was optimized
using GA. The mass flow rate of C5+ has
been chosen as objective or fitness function and the variations of both average fitness function and best fitness function in two successive generations have been chosen as convergence criteria. The algorithm converged after 39 generations. The optimum operating conditions that maximize the C5+ product flow rate are
given in Table 4. The value of objective function (C5+ mass flow rate) at the
optimum point was 1.58 x 10⁻³ g/s. It can be seen that at the optimum point, pressure is at its maximum limit while temperature, H2/CO ratio, and FCO are at their minimum
Modeling and Optimization of ….. 9
5. Conclusions
The Fischer-Tropsch synthesis in a packed-bed reactor over an industrial Fe-Cu-K catalyst was modeled using a non-isothermal, one-dimensional flow reactor intrinsic reaction kinetics for both the Fischer-Tropsch and water-gas shift reactions over the above catalyst were obtained from literature and tested against the reported experimental data. Genetic algorithm optimization method was used to obtain the optimum conditions that would maximize the C5+ product yield. The
agreement between model-predicted and experimental product yields was satisfactory. The optimum point occurred at the reactor pressure set to its maximum limit and temperature, H2/CO ratio, and CO
feed rate set at their minimum levels.
Nomenclature
A Reactor area, m2
Ci Bulk gas concentrations of component i, mol.m-3
C0 Inlet gas concentration of component i, mol.m-3
Cp Residual heat capacity of i th
reaction, J.(kg.K)-1
din Inlet tube diameter, m
do Outlet tube diameter, m
dp Pellet diameter, m
E5 Activation energy for paraffin formation, kJ.mol-1
E5m Activation energy for methane formation, kJ.mol-1
E6 Activation energy for olefin formation, kJ.mol-1
Ev Activation energy for WGS reaction, kJ.mol-1
f Volume flow rate, m3.s-1 fi Tube fouling factor, m2.s.°C.J-1
fo Shell fouling factor, m2.s.°C.J-1
-∆Hj Reaction heat of jth reaction, J.mol-1
hi The tube-side heat transfer coefficient, J.(m2.s.K)-1
ho The shell-side heat transfer coefficient, J.(m2.s.K)-1
G Mass velocity, kg.m-2.s-1
k1 Rate constant of CO adsorption, mol.g-1.bar-1.s-1
k5 Rate constant of paraffin formation, mol.g-1.bar-1.s-1
k5 Pre exponential factor of paraffin formation (n≥2) , mol.g-1.bar-1.s-1
k5m
Pre exponential factor of rate constant of methane formation, mol.g-1.bar-1.s-1
k6
Pre exponential factor of rate constant of olefin desorption reaction, mol.g-1. s-1
kv Rate constant of COmol.g-1.bar-1.5.s-1 2 formation,
kv
Pre exponential factor of rate constant of CO2 formation,
mol.g-1.bar-1.5.s-1
k-6
Rate constant of olefin re-adsorption reaction, mol.g-1.bar
-1.s-1
k6 Rate constant of olefin desorption reaction, mol.g-1.s-1
K1
Equilibrium constant of elementary reaction step SI for FTS reactions
K2
Equilibrium constant of
elementary reaction step SII for FTS reactions
K3
Equilibrium constant of
elementary reaction step SIII for FTS reactions
K4
Equilibrium constant of
elementary reaction step SIV for FTS reactions
Kv Group of constants in WGS reaction, bar-0.5
Kp Equilibrium constant of WGS reaction
kw Conductivity, W.m-1.K-1
Npop Population size
NR Number of equations P Total pressure, bar
10 Journal of Chemical and Petroleum Engineering, University of Tehran, Vol. 46, No.1, Jun. 2012 Pin Inlet reaction pressure, bar
R gas constant, J.mol-1.K-1 Rj Rate of jth reaction, mol/ g.s
Ro,j Rate of j
th olefin reaction, mol/
g.s Rp,j Rate of j
th paraffin reaction, mol/
g.s
Rco2,j Rate of jth WGS reaction, mol/g.s
Tg Bulk temperature of gas phase, K
Tg,0 Inlet temperature of gas phases, K
Tcold Cooling temperature, K
Tw Wall temperature, K
us Superficial gas velocity, m/s
U Overall heat transfer coefficient, J/m2.s.K
X Conversion Z Reactor length, m Greek symbols
ρg Bulk gas density, kg/m3
ρp Catalyst pellet density, kg/m3
εB Bed void age, dimensionless
α1 Chain growth factor for carbon number of 1
αn Chain growth factor for carbon number of n (n≥2)
αA
Chain growth probability in the Anderson-Schulz-Flory
distribution
βn Re-adsorption factor of 1-olefin with carbon number of n
References
:
1- Wang, Y. N., Xu, Y. Y., Li, Y. W., Zhao, Y. L. and Zhang, B. J. (2003). “Heterogeneous modeling for fixed bed reactor for Fischer-Tropsch synthesis: Reactor model and its applications.” Chemical Engineering Science, Vol. 58, PP. 867-875.
2- Anastai, J. L. (1980). “SASOL: South Africa’s oil from coal story - background for environmental assessment.” U.S. EPA report 600/8-80-002.
3- Sie, S. T. and Krishna, R. (1999). “Fundamentals and selection of advanced Fischer– Tropsch reactors.” Applied Catalysis A: General, Vol. 186, PP. 55-70.
4- Jess, A. and Kern, C. (2009). “Modeling of multi-tubular reactors for Fischer-Tropsch synthesis.” Chemical Engineering Technology, Vol. 32, PP. 1164-1175.
5- Rafiq, M. H., Jakobsen, H. A., Schmid, R. and Hustad, J. E. (2011). “Experimental studies and modeling of a fixed bed reactor for Fischer-Tropsch synthesis using biosyngas.” Fuel Processing Technology, Vol. 92, PP. 893-907.
6- Fernandes, F. A. N. and Teles, U. M. (2007). “Modeling and optimization of Fischer– Tropsch products hydrocracking.” Fuel Processing Technology, Vol. 88, PP. 207-214.
7- Fernandes, F. A. N. (2005). “Polymerization kinetics of Fischer-Tropsch reaction on iron based catalyst and product grade optimization.” Chemical Engineering Technology, Vol.
Modeling and Optimization of ….. 11
8- Wang, Y., Fan, W., Liu, Y., Zeng, Z., Hao, X., Changa, M., Zhang, C., Xu, Y., Xiang, H. and Li, Y. (2008). “Modeling of the Fischer–Tropsch synthesis in slurry bubble column reactors.” Chemical Engineering and Processing, Vol. 47, PP. 222–228.
9- Schweitzer, J. M. and Viguié, J. C. (2009). “Reactor modeling of a slurry bubble column for Fischer-Tropsch synthesis.” Oil & Gas Science and Technology, Vol. 64, PP. 63-77.
10- Fernandes, F. A. N. (2006). “Modeling and product grade optimization of Fischer - Tropsch synthesis in a slurry reactor.” Industrial Engineering & Chemistry Research, Vol.
45, PP. 1047-1057.
11- Sehabiague, L., Lemoine, R., Behkish, A., Heintz, Y. J., Sanoja, M., Oukaci, R. and Morsi, B. I. (2008). “Modeling and optimization of a large-scale slurry bubble column reactor for producing 10,000 bbl/day of Fischer-Tropsch liquid hydrocarbons.” Journal of the Chinese Institute of Chemical Engineers, Vol. 39, PP. 169-179.
12- Wang, Y. N., Ma, W. P., Lu, Y. J., Yang, J., Xu, Y. Y., Xiang, H. W., Li, Y. W., Zhao, Y. L. and Zhang, B. J. (2003). “Kinetics modelling of Fischer-Tropsch synthesis over an industrial Fe-Cu-K catalyst.” Fuel, Vol. 82, PP. 195-213.
13- Froment, G. F. and Bischoff, K. B. (1979). Chemical reactor analysis and design. 1st Ed.
John Wiley & Sons, New Jersey, USA.
14- Steynberg, A. P. and Dry, M. E. (2004). In Studies in Surface Science and Catalysis: Fischer-Tropsch Technology. 1st Ed. Elsevier, Amsterdam, Netherlands.
15- Holman, J. P. (1997). Heat transfer. 8th Ed. McGraw Hill, USA.
16- Megyesy, E. F. (2001). Pressure Vessel Handbook. 12th Ed. Pressure Vessel Publishing,
Tulsa, Oklahoma, USA.
17- Ludwig, E. E. (1990). Applied process design for chemical and petrochemical plants. Vol
3, 3rd Ed. Gulf Professional Publishing, Oxford, United Kingdom.
18- Holland, J. H. (1975). Adaptation in natural and artificial systems. 1st Ed. University of
Michigan Press, Ann Arbor, USA.
19- Goldberg, D. E. (1989). Genetic algorithms in search, optimization and machine learning.
1st Ed. Addison Wesley, Boston, USA.
20- Hwang, S. and He, R. (2006). “A hybrid real-parameter genetic algorithm for function optimization.” Advanced Engineering Informatics, Vol. 20, PP. 7-21.
21- Haupt, R. L. and Haupt, S. E. (2004). Practical genetic algorithms. 2nd Ed. John-Wiley &
![Table 1: Parameter values for FT-WGS reactions [12]](https://thumb-us.123doks.com/thumbv2/123dok_us/8949055.1858423/4.595.68.527.460.596/table-parameter-values-ft-wgs-reactions.webp)